Chart Patterns All in One
- インディケータ
- Davit Beridze
- バージョン: 2.2
- アップデート済み: 16 8月 2024
- アクティベーション: 5
`All in One Chart Patterns`
チャートパターンはトレーダーの間で議論の的となっています。信頼できるシグナルだと考える人もいれば、そうでないと考える人もいます。当社の「Chart Patterns All-in-One」インジケーターは、これらのパターンを表示し、自分自身で理論を検証できるようにします。これらのパターンの収益性は、インジケーターの有効性を反映するものではなく、むしろパターン自体の評価です。「Chart Patterns All-in-One」インジケーターは、これらのパターンを視覚化するための優れたツールであり、取引戦略における有効性について自分自身で結論を下すことができます。
このインジケーターは、複数のチャートパターンを1つの統合ツールに組み合わせて、MetaTrader 4 (MT4) で使用します。チャートから直接各パターンをオンまたはオフに切り替える機能を提供し、カスタマイズ可能で効率的な分析を可能にします。以下は、インジケーターとその中に含まれるパターンの詳細な説明です。
#### 含まれるパターン:
1. **パターン 1-2-3**
- **説明**: このパターンは、市場の潜在的な反転を識別するために使用されます。トレンドの変化を示す3つのポイント(高値または安値)のシーケンスを探します。
- **シグナル**:
- 買いシグナル: 2つの連続する安値があり、2番目の安値が1番目の安値より高く、その後の高値が前の高値より低い場合に形成されます。
- 売りシグナル: 2つの連続する高値があり、2番目の高値が1番目の高値より低く、その後の安値が前の安値より高い場合に形成されます。
- **可視化**: パターンのポイントを接続するラインをチャート上に描画し、完了ポイントに矢印を配置します。
2. **ダブルトップとダブルボトム**
- **説明**: このパターンは、価格が2つの連続する高値(ダブルトップ)または安値(ダブルボトム)を形成し、それがほぼ等しい場合に、潜在的な反転ポイントを識別するのに役立ちます。
- **シグナル**:
- ダブルトップ: 弱気の反転シグナル。
- ダブルボトム: 強気の反転シグナル。
- **可視化**: 高値または安値を接続するラインを描画し、反転ポイントに矢印を配置します。
3. **トリプルトップとトリプルボトム**
- **説明**: ダブルトップとダブルボトムと似ていますが、3つの連続する高値または安値があります。このパターンは、ダブルトップとダブルボトムよりも強力と見なされます。
- **シグナル**:
- トリプルトップ: 弱気の反転シグナル。
- トリプルボトム: 強気の反転シグナル。
- **可視化**: 高値または安値を接続するラインを描画し、反転ポイントに矢印を配置します。
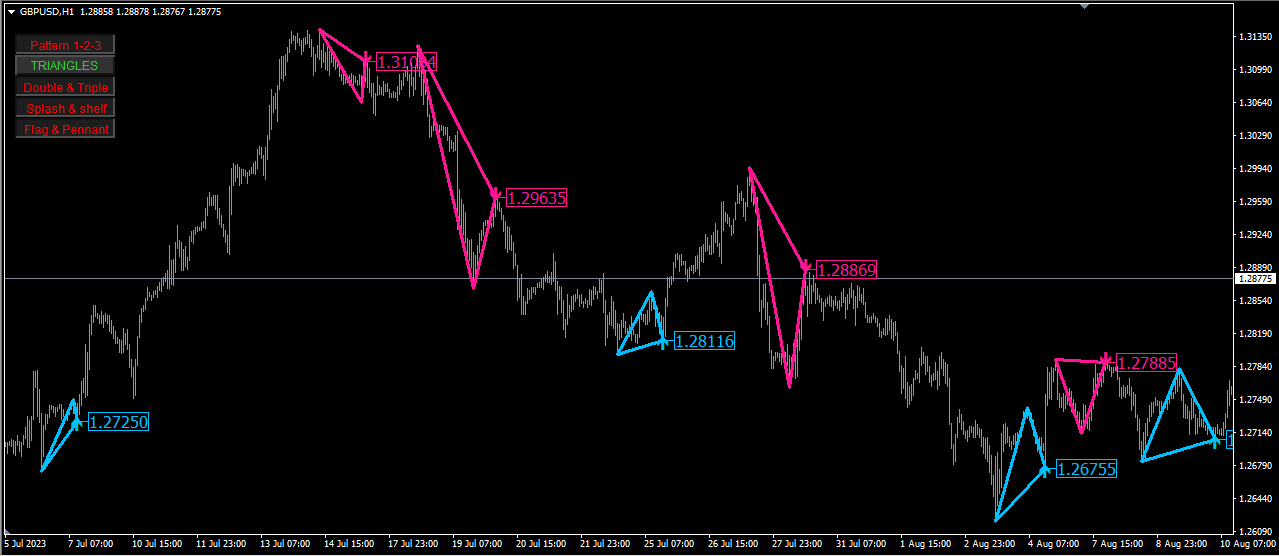
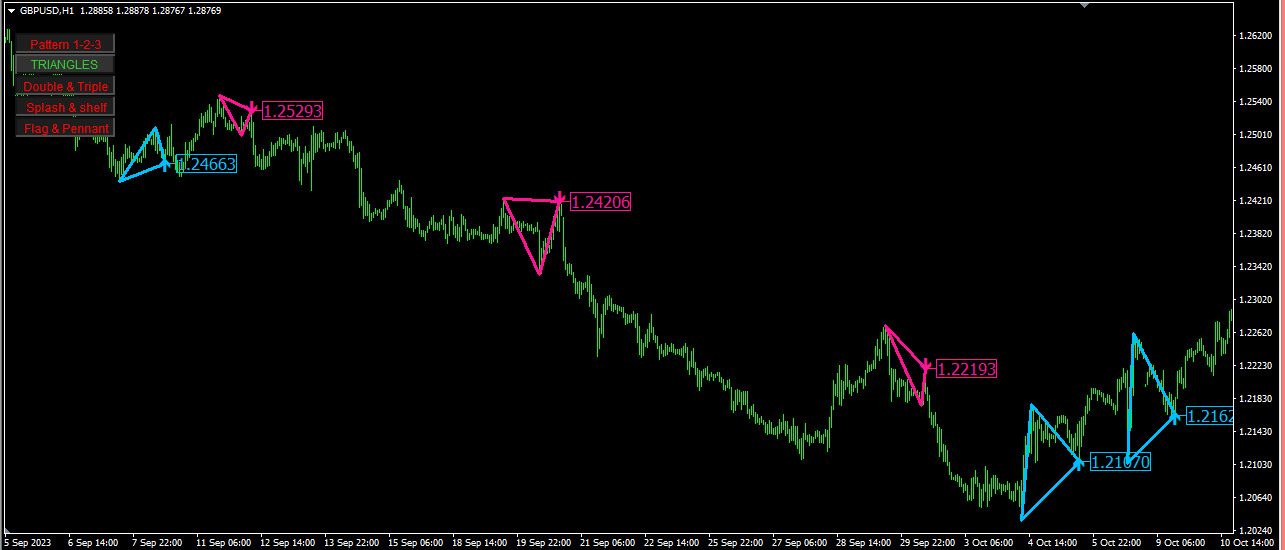
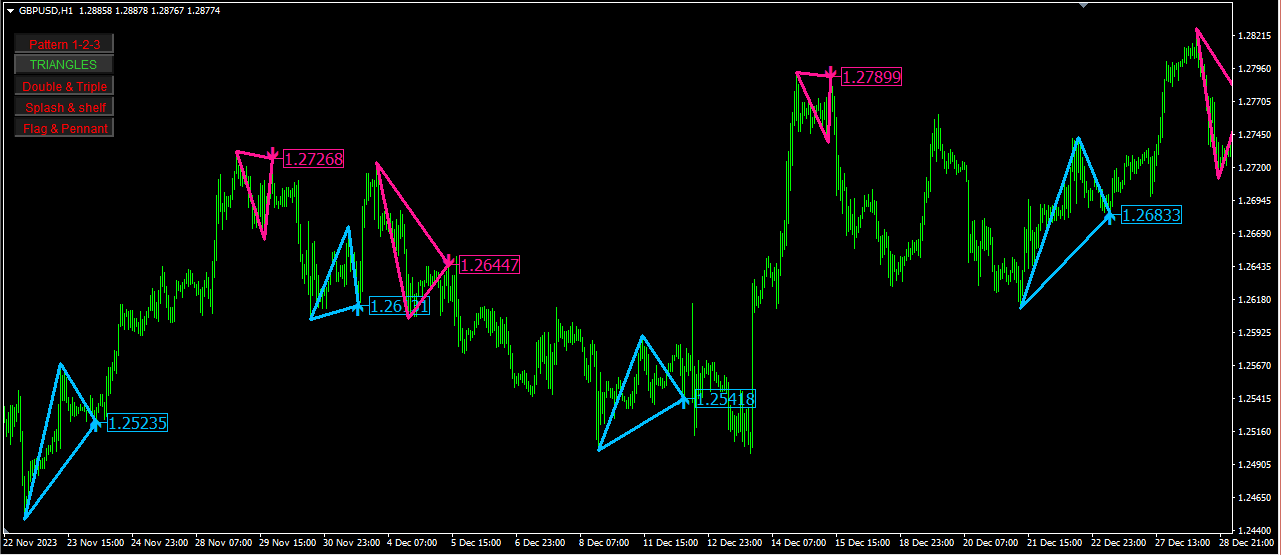
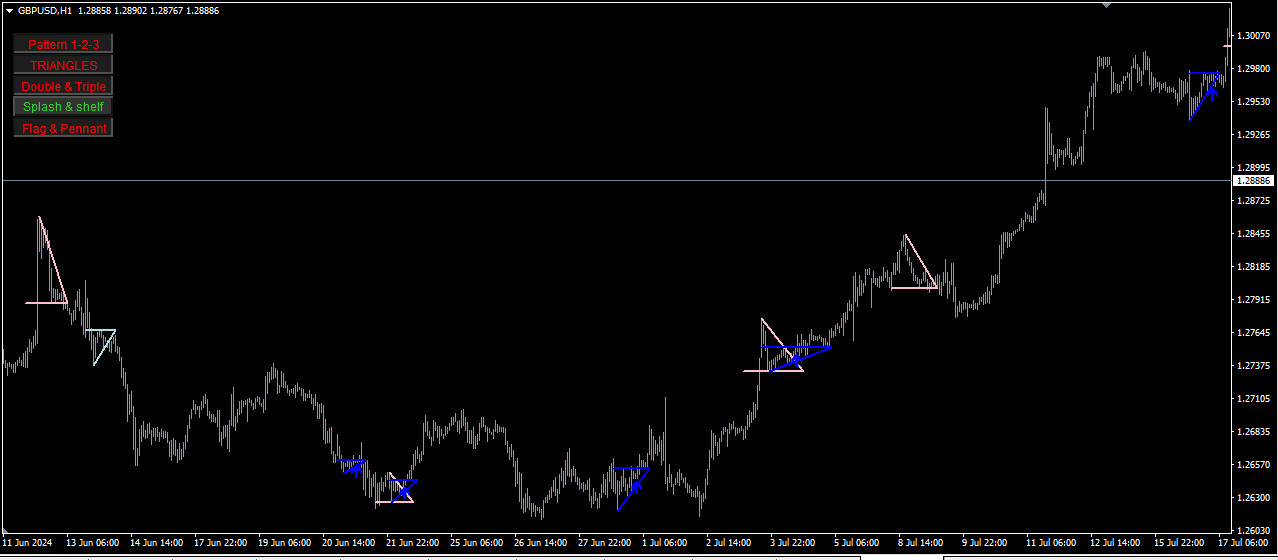
4. **トライアングル**
- **説明**: トライアングルは、価格が主要なトレンドの方向に継続する前に、統合期間を示す継続パターンです。このインジケーターは、上昇トライアングル、下降トライアングル、対称トライアングルを識別します。これはジグザグインジケーターに基づいているため、トライアングルはチャート上で数バー前に表示されることがあります。これは、ジグザグインジケーターが実際のピークよりも少し遅れて線を描画するためです。しかし、これは頻繁には起こりません。
- **シグナル**:
- 上昇トライアングル: 強気の継続シグナル。
- 下降トライアングル: 弱気の継続シグナル。
- 対称トライアングル: どちらの方向にもブレイクする可能性がある継続シグナル。
- **可視化**: トライアングルの形をチャート上に描画し、ブレイクポイントに矢印を配置します。
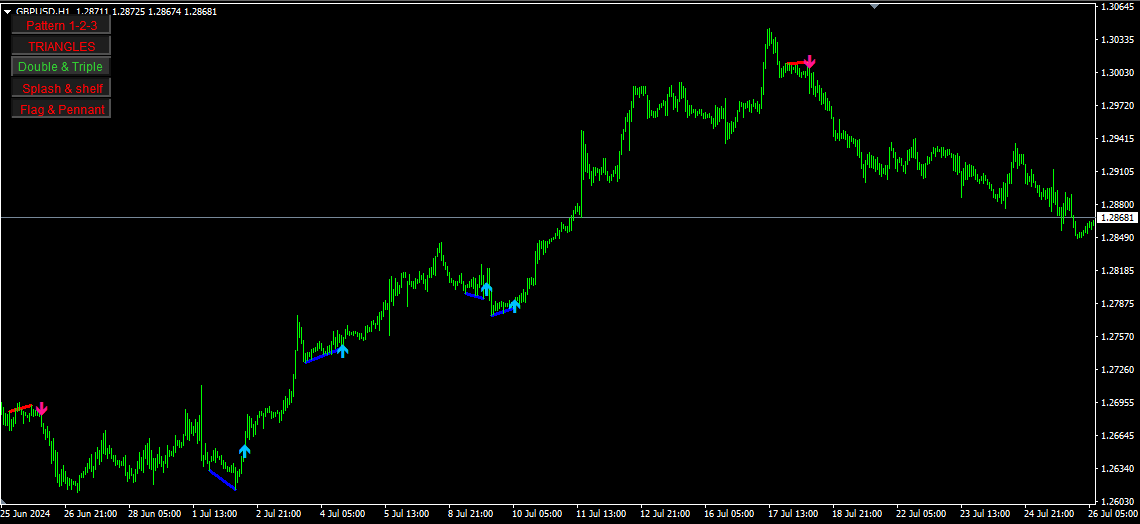
5. **スプラッシュとシェルフ**
- **説明**: このパターンは、価格の急激なスパイク(スプラッシュ)とその後の統合期間(シェルフ)を識別します。これは、潜在的なブレイクアウトまたは反転を発見するのに役立ちます。
- **シグナル**:
- スプラッシュ: 価格の急激な動きを示します。
- シェルフ: スプラッシュ後の統合期間を示します。
- **可視化**: スプラッシュのトレンドラインとシェルフの水平線を描画します。
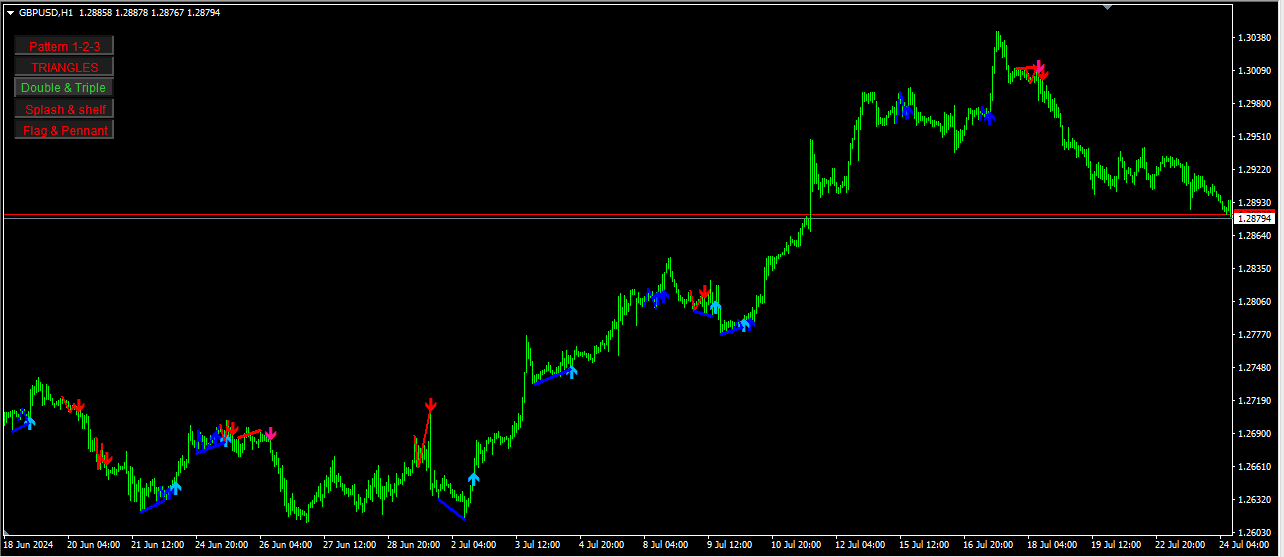
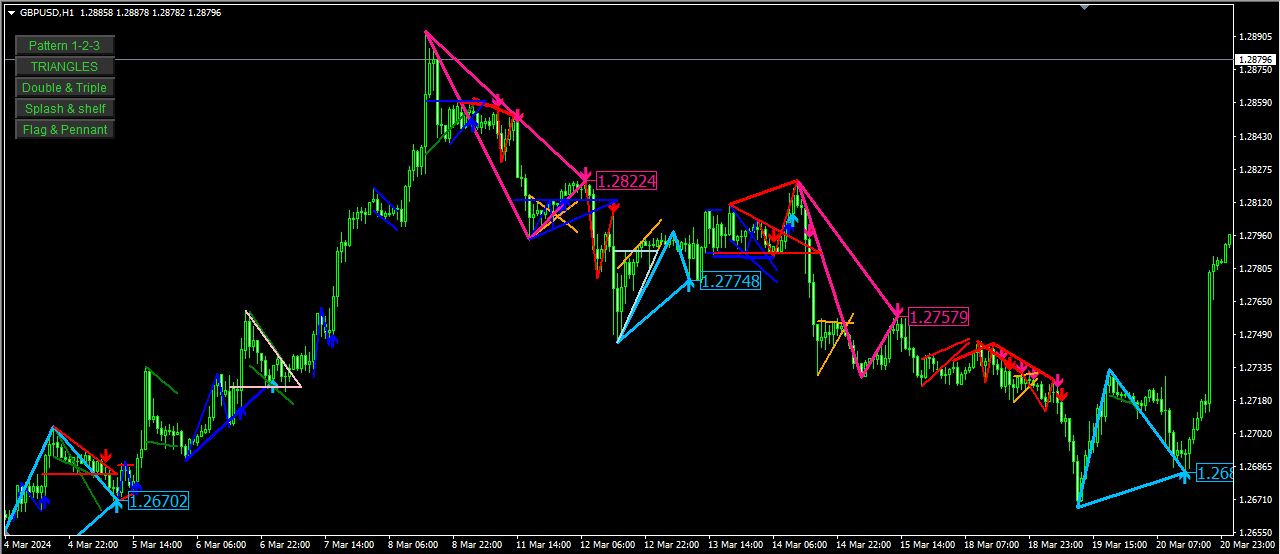
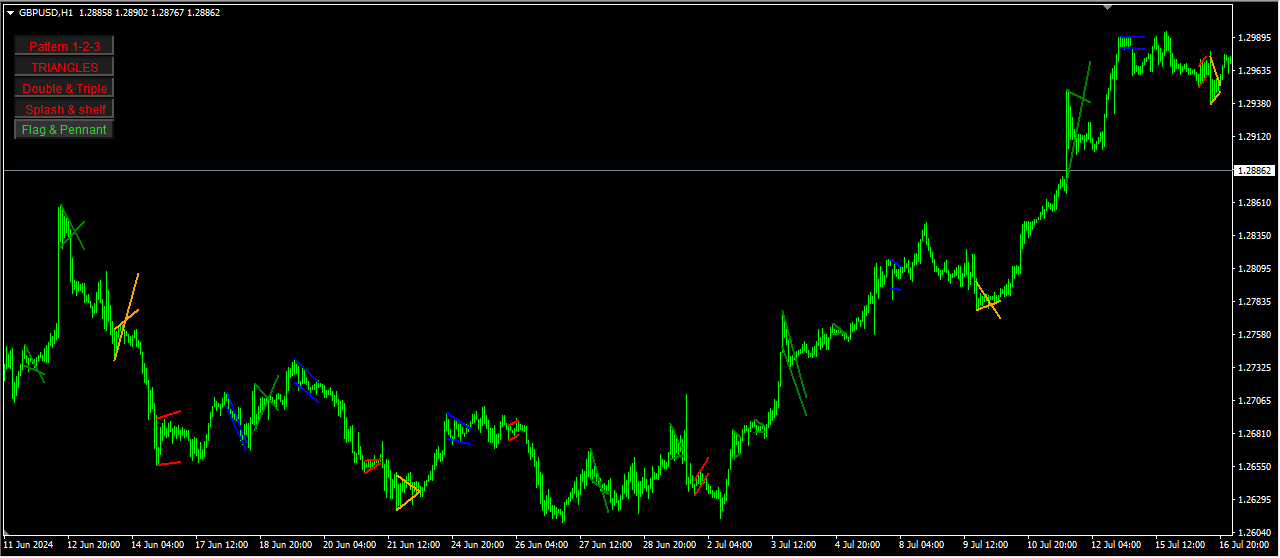
6. **フラッグとペナント**
- **説明**: フラッグとペナントは、短期的な継続パターンであり、主要なトレンドが続く前の短い休止を示します。
- **シグナル**:
- 強気のフラッグ: 強気の継続シグナル。
- 弱気のフラッグ: 弱気の継続シグナル。
- ペナント: 小さな対称トライアングルを形成する継続シグナル。
- **可視化**: チャート上にフラッグとペナントの形を描画し、ブレイクポイントに矢印を配置します。
#### 機能:
- **パターンのオン/オフ切り替え**: インジケーターは、各パターンをオンまたはオフに切り替えるためのボタンをチャート上に提供します。これにより、柔軟で効率的な分析が可能です。
- **カスタマイズ可能な色と設定**: ユーザーは、各パターンの色、幅、およびその他の設定をカスタマイズできます。
- **アラートと通知**: インジケーターは、パターンが識別されたときにアラート、プッシュ通知、および電子メールを提供するように設定できます。
#### 入力:
- **一般設定**: パターンの色、幅、およびその他の表示設定を含みます。
- **パターン固有の設定**:
- `Double_Triple_and_1_2_3`: ダブルトップ/ボトムおよびパターン1-2-3の設定。
- `Pattern_TRIANGLES`: トライアングルパターンの設定。
- `Splash_and_shelf`: スプラッシュおよびシェルフパターンの設定。
- `Flag_and_Pennant`: フラッグおよびペナントパターンの設定。
- **アラート設定**: アラート、通知、および電子メールの設定。
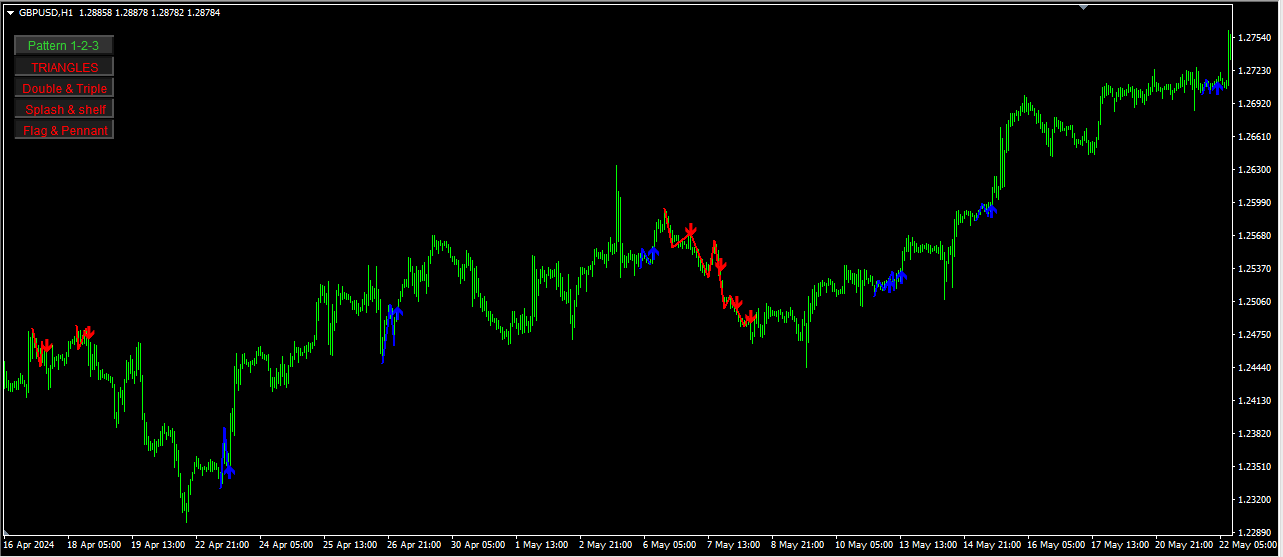
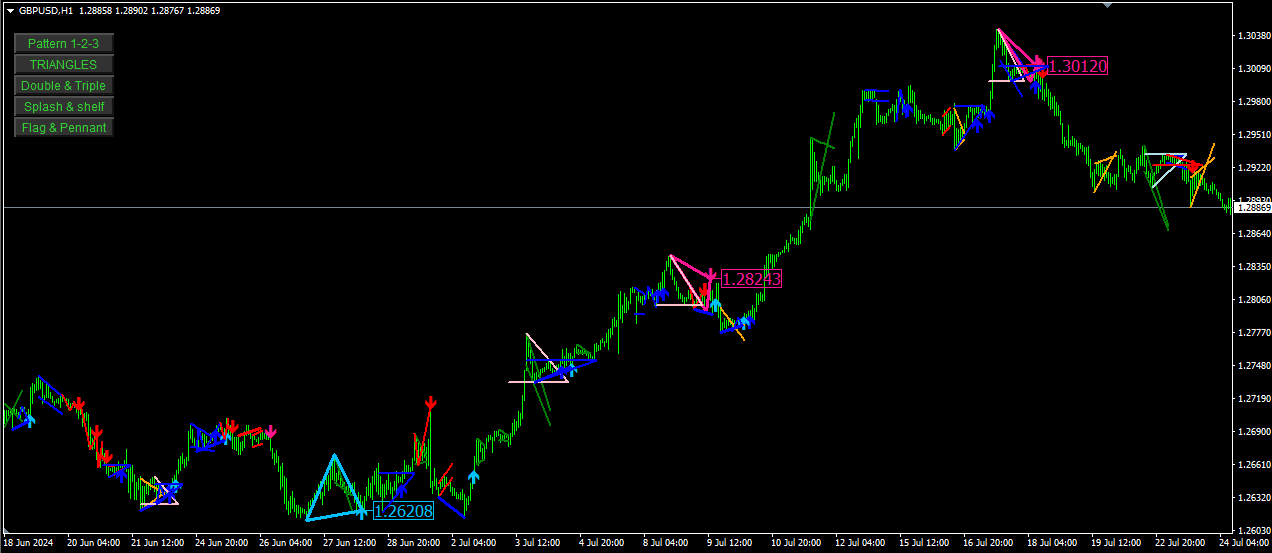
#### 可視化:
- **矢印とライン**: 各パターンは、チャート上に矢印とラインで可視化され、一目でパターンを識別できるようにします。
- **インタラクティブボタン**: 各パターンの表示を切り替えるためのボタンがチャート上にあります。
このオールインワンインジケーターは、複数のチャートパターンを技術分析に使用するトレーダーにとって強力なツールです。これらのパターンを1つのインジケーターに組み合わせることで、分析プロセスが簡素化され、トレーダーが情報に基づいた取引の決定を下すのを支援します。
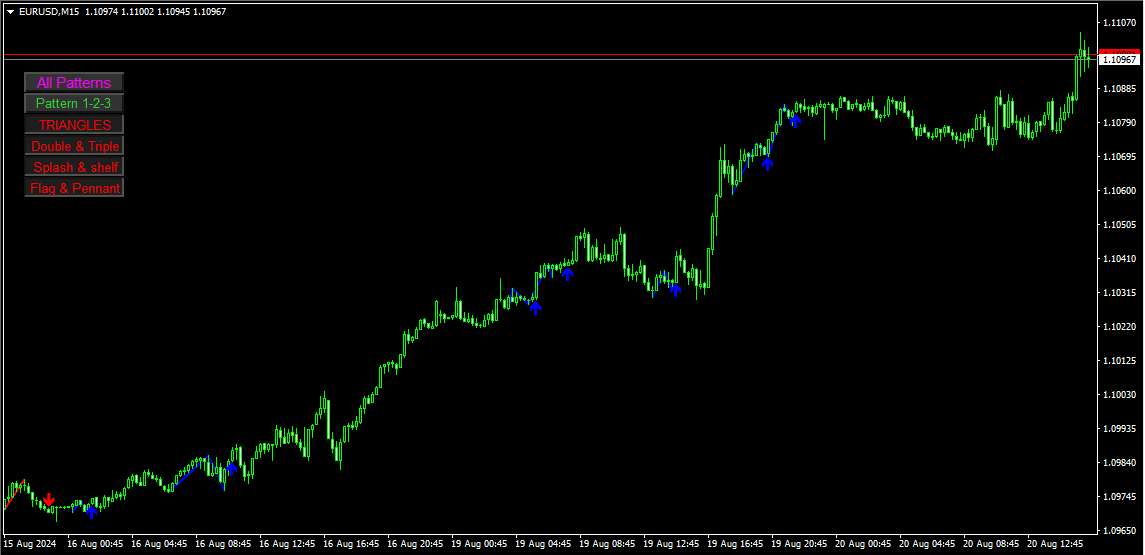


It is a very accurate indicator. I'm waiting for a sign on the 4-hour timeframe and looking for an entry point on the 15-minute timeframe, and both signs are valid.