Chart Patterns All in One
- Indicators
- Davit Beridze
- Version: 2.2
- Updated: 16 August 2024
- Activations: 5
You will get Huge Bonus in case of Full Purchase (not for Rent) contact me after purchase, Leave comment or DM me.
Backtest and Read Overview Before buying
Chart patterns have been a topic of debate among traders; some believe they are reliable signalers, while others do not. Our Chart Patterns All-in-One indicator displays various chart patterns to help you test these theories for yourself. The profitability of these patterns is not a reflection of the indicator's effectiveness but rather an evaluation of the patterns themselves. The Chart Patterns All-in-One indicator is an excellent tool for visualizing these patterns, allowing you to draw your own conclusions about their validity in your trading strategy.
"All in One Chart Patterns" current price will stay for the next 2 weeks, final price will be 150$. Comment or Write me directly to get Manual PDF.
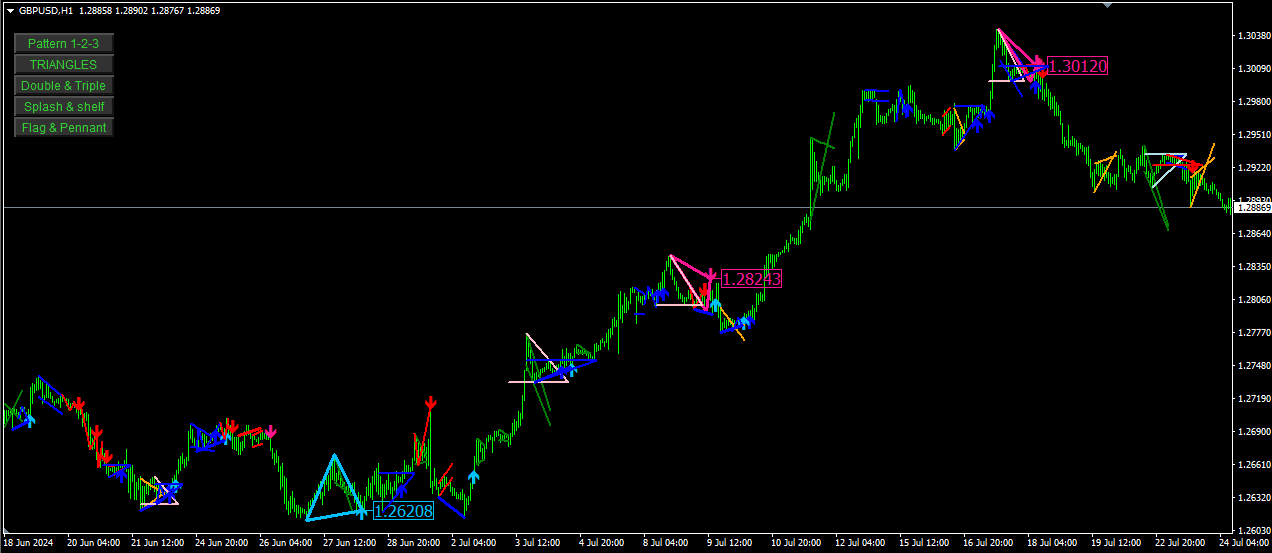
This indicator combines multiple chart patterns into a single, unified tool for MetaTrader 4 (MT4). It provides the functionality to toggle each pattern on or off directly from the chart, allowing for customizable and efficient analysis. Here is a detailed description of the indicator and the patterns it includes:
Patterns Included:
-
Pattern 1-2-3
- Description: This pattern is used to identify potential reversals in the market. It looks for a sequence of three points (highs or lows) that signal a change in the trend.
- Signals:
- Buy signal: Formed when there are two consecutive lows with the second low higher than the first, followed by a high lower than the previous high.
- Sell signal: Formed when there are two consecutive highs with the second high lower than the first, followed by a low higher than the previous low.
- Visualization: Draws lines connecting the points of the pattern on the chart and places arrows at the completion points.
-
Double Top and Bottom
- Description: This pattern helps identify potential reversal points where the price forms two consecutive highs (Double Top) or lows (Double Bottom) that are approximately equal, indicating a possible reversal.
- Signals:
- Double Top: Bearish reversal signal.
- Double Bottom: Bullish reversal signal.
- Visualization: Draws lines connecting the tops or bottoms and places arrows at the reversal points.
-
Triple Top and Bottom
- Description: Similar to the Double Top and Bottom, but with three consecutive highs or lows. This pattern is considered stronger than the Double Top and Bottom.
- Signals:
- Triple Top: Bearish reversal signal.
- Triple Bottom: Bullish reversal signal.
- Visualization: Draws lines connecting the tops or bottoms and places arrows at the reversal points.
-
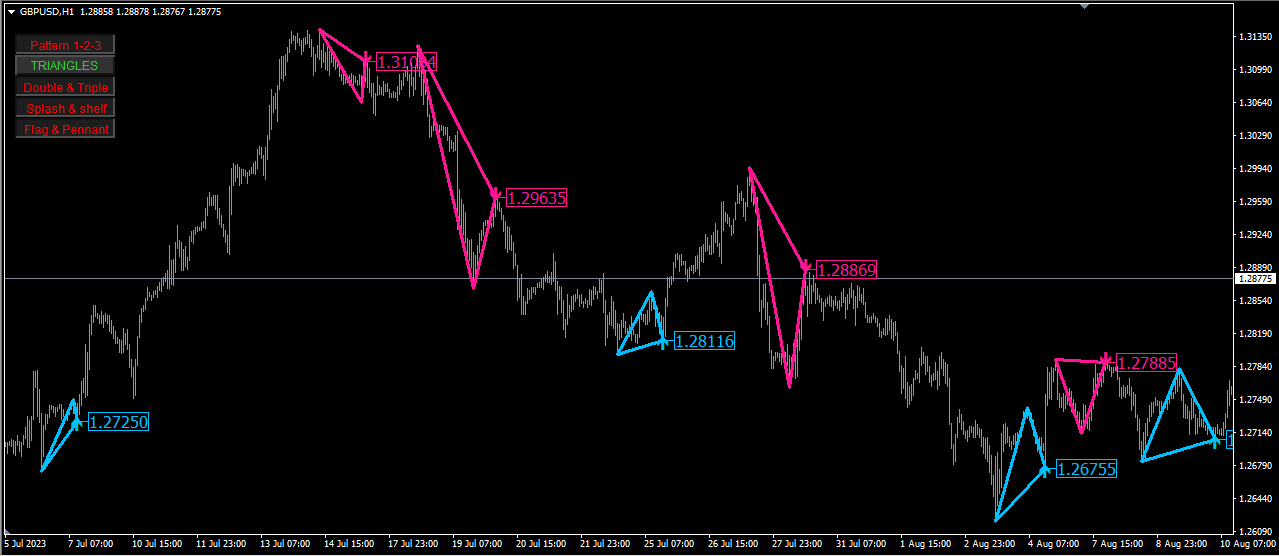
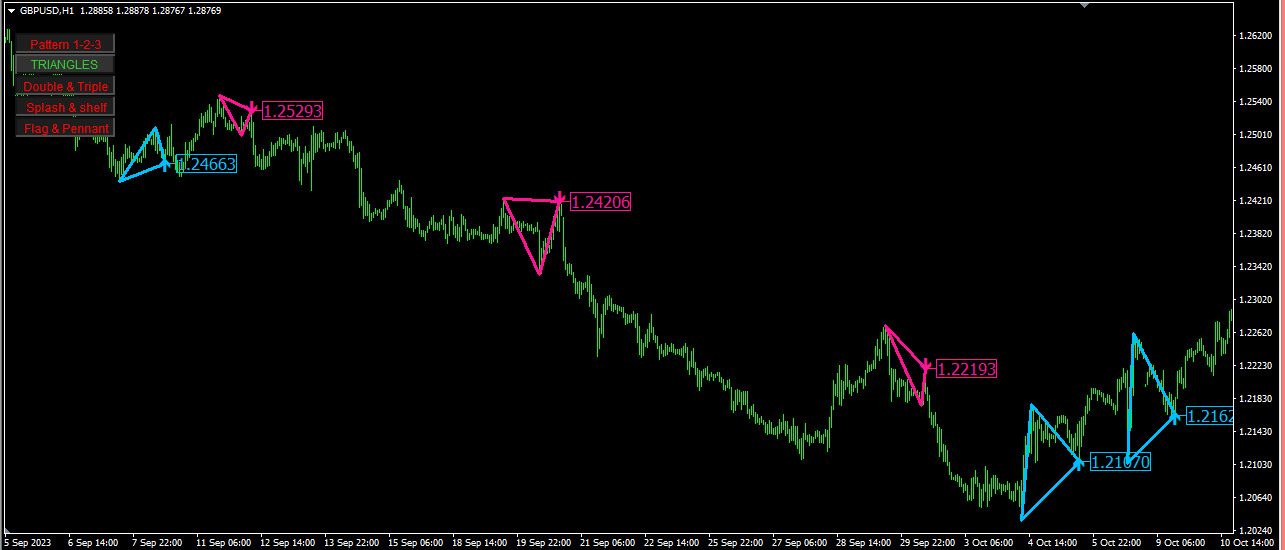
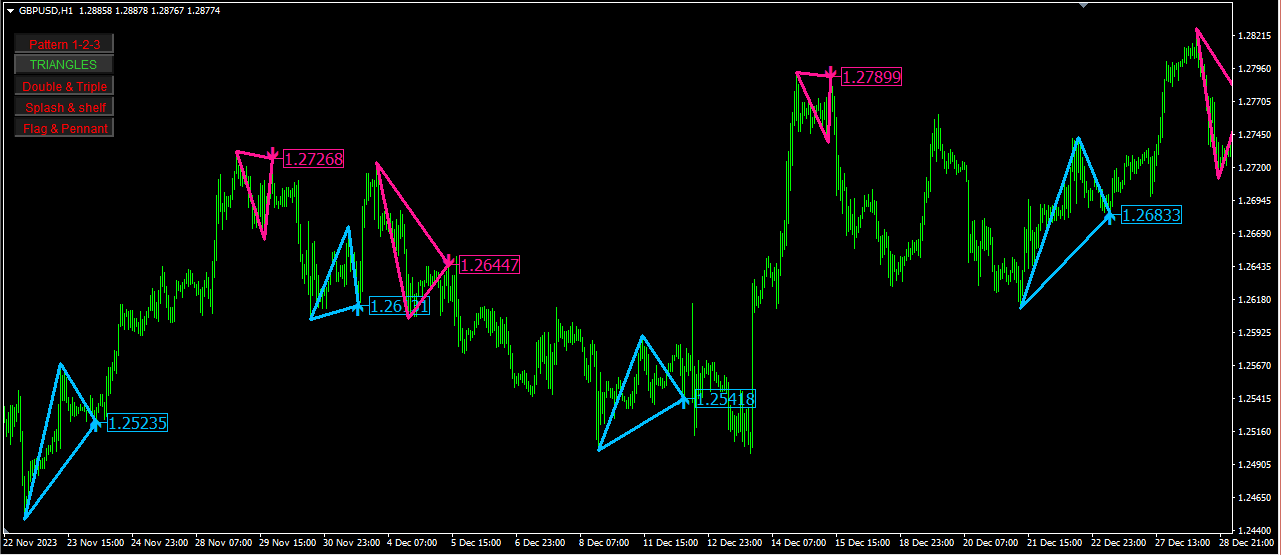
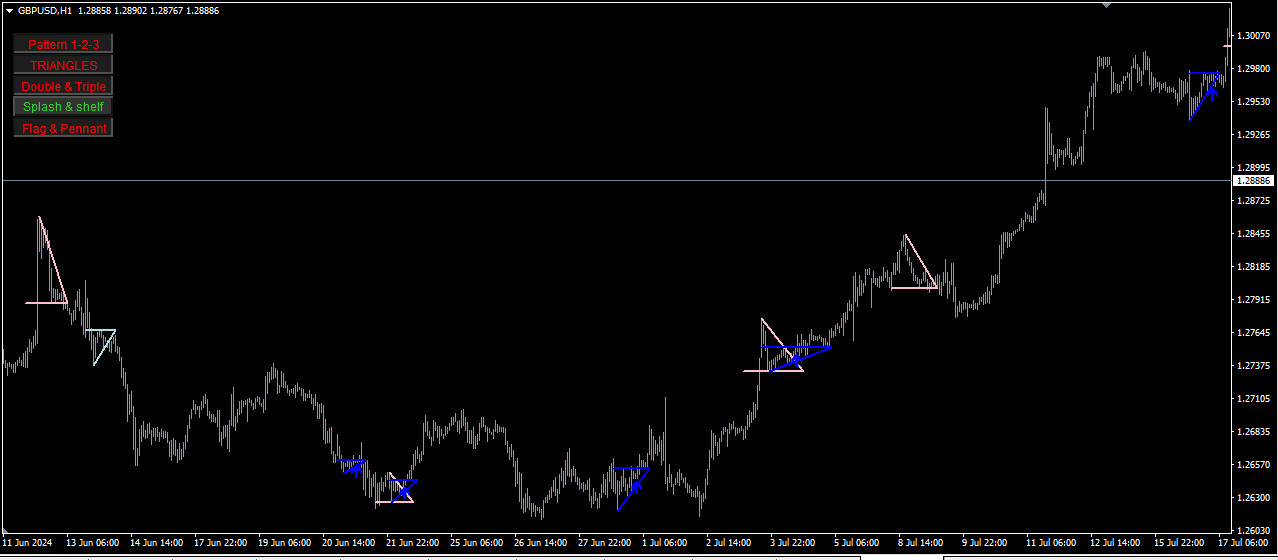
Triangles
- Description: Triangles are continuation patterns that signal a period of consolidation before the price continues in the direction of the prevailing trend. This indicator identifies ascending, descending, and symmetrical triangles. As it is based on the Zig-Zag indicator, sometimes the triangles can appear on the chart a few bars back. This happens because the Zig-Zag indicator draws its lines a little later than the peak occurred. Update: From further examination triangles sometimes can disappear as well but from back testing it shows that even with this characteristics of redraw it still gives reliable signals.
- Signals:
- Ascending Triangle: Bullish continuation signal.
- Descending Triangle: Bearish continuation signal.
- Symmetrical Triangle: Continuation signal that can break in either direction.
- Visualization: Draws the triangle shapes on the chart and places arrows at the breakout points.
-
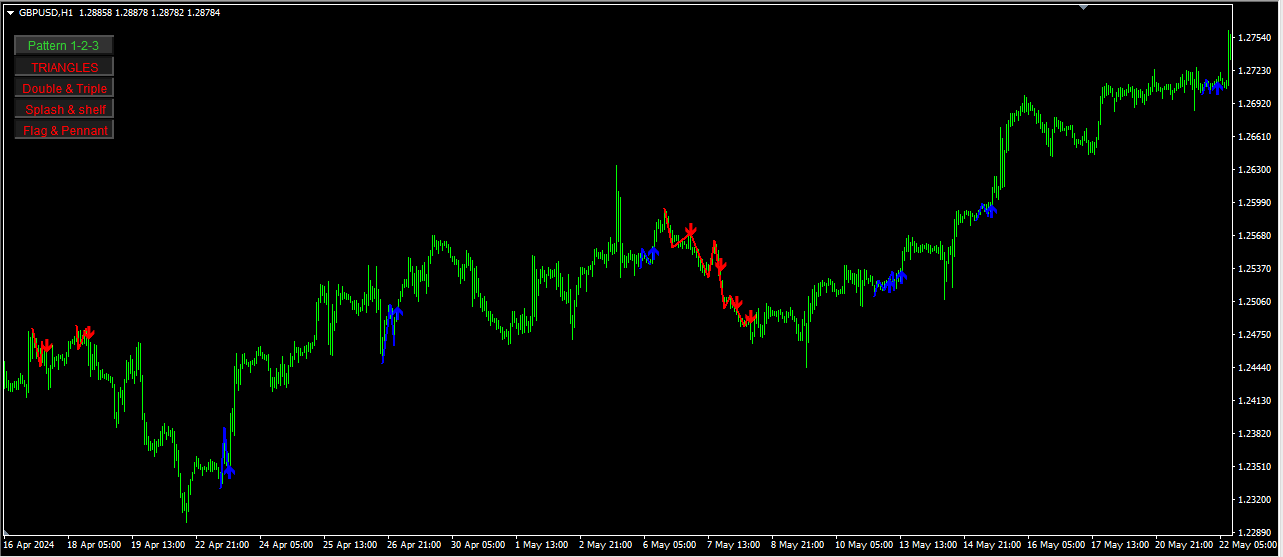
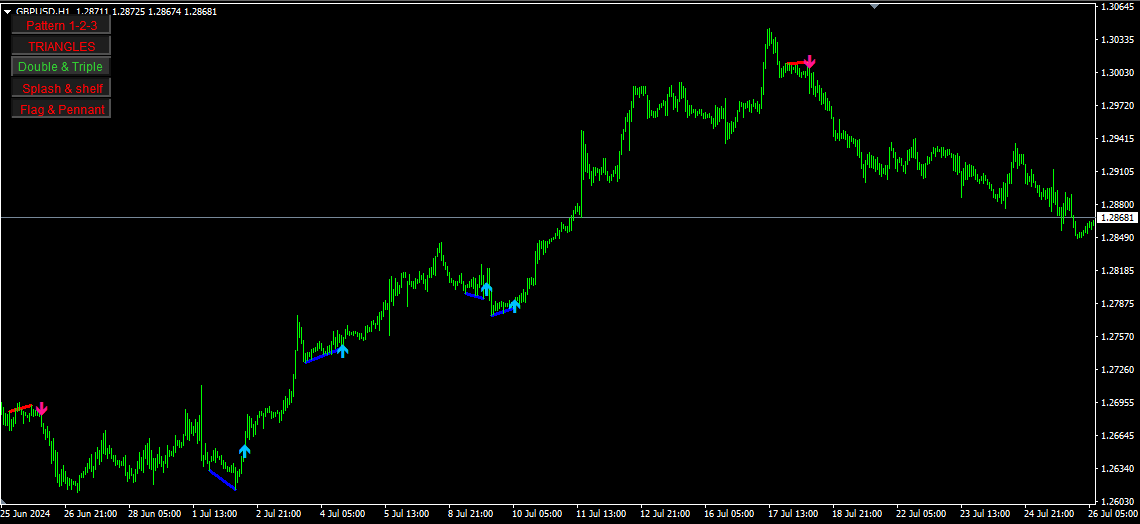
Splash and Shelf
- Description: This pattern identifies sudden spikes in price (splash) followed by periods of consolidation (shelf). It's useful for spotting potential breakouts or reversals.
- Signals:
- Splash: Indicates a sharp movement in price.
- Shelf: Indicates a consolidation phase after a splash.
- Visualization: Draws trend lines for the splash and horizontal lines for the shelf.
-
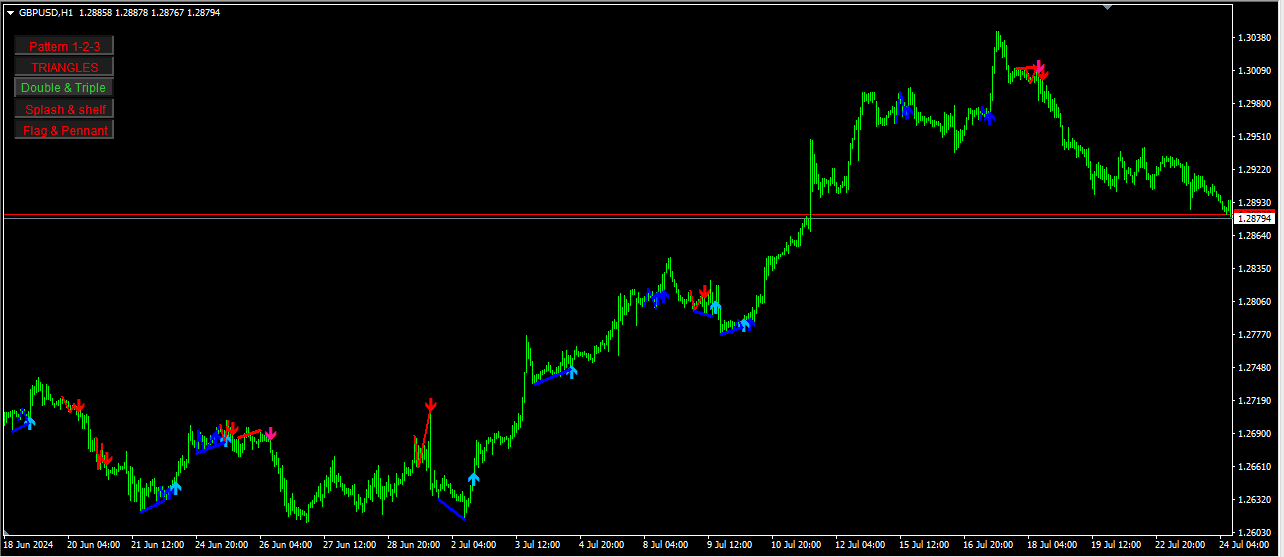
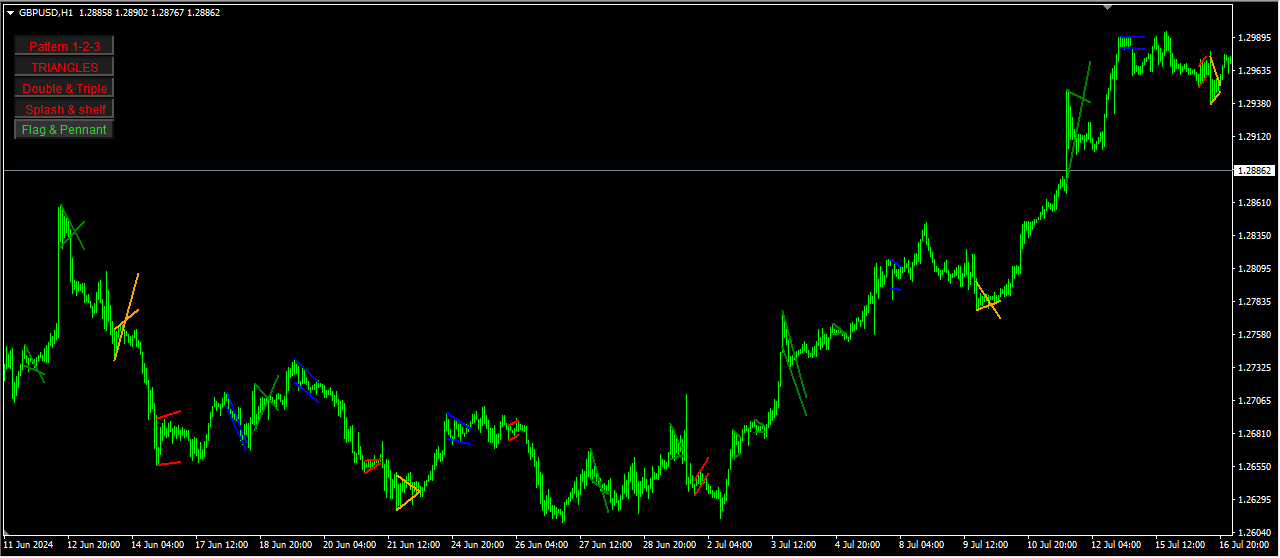
Flag and Pennant
- Description: Flags and pennants are short-term continuation patterns that signal a brief pause in the prevailing trend before it continues.
- Signals:
- Bullish Flag: Bullish continuation signal.
- Bearish Flag: Bearish continuation signal.
- Pennant: Continuation signal that forms a small symmetrical triangle.
- Visualization: Draws flag and pennant shapes on the chart and places arrows at the breakout points.
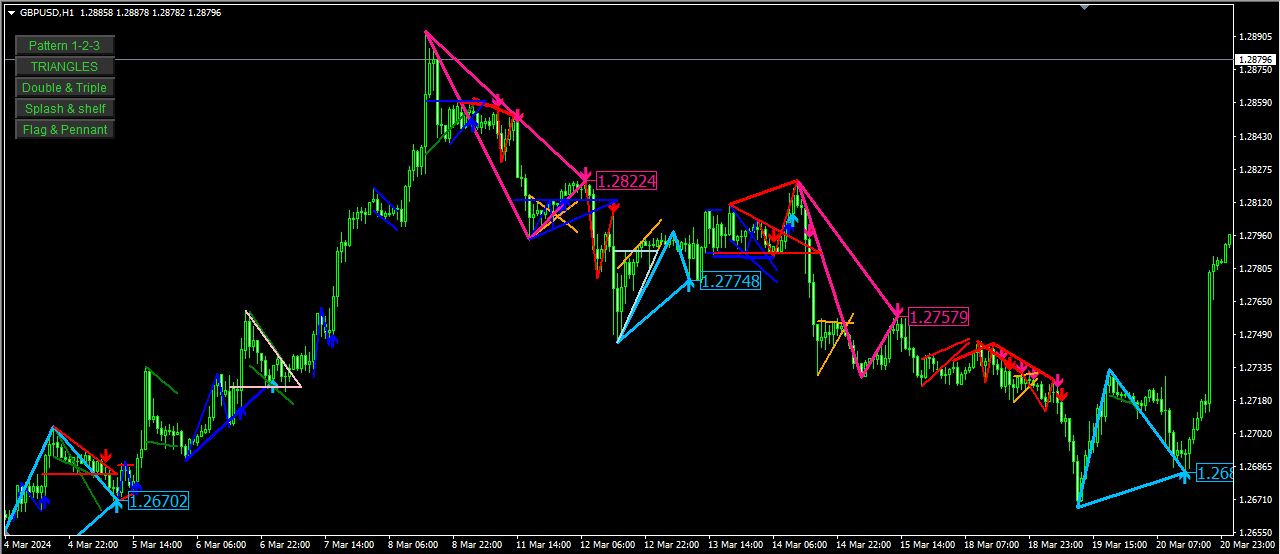
Features:
- Toggle Patterns On/Off: The indicator provides buttons on the chart to toggle each pattern on or off. This allows for flexible and efficient analysis.
- Customizable Colors and Settings: Users can customize the colors, widths, and other settings for each pattern.
- Alerts and Notifications: The indicator can be configured to provide alerts, push notifications, and emails when patterns are identified.
Inputs:
- General Settings: Includes colors, widths, and other display settings for the patterns.
- Pattern Specific Settings:
- Double_Triple_and_1_2_3 : Settings for Double Top/Bottom and Pattern 1-2-3.
- Pattern_TRIANGLES : Settings for Triangle patterns.
- Splash_and_shelf : Settings for Splash and Shelf patterns.
- Flag_and_Pennant : Settings for Flag and Pennant patterns.
- Alert Settings: Configure alerts, notifications, and emails.
Visualization:
- Arrows and Lines: Each pattern is visualized with arrows and lines on the chart, making it easy to identify patterns at a glance.
- Interactive Buttons: Buttons are provided on the chart to toggle the visibility of each pattern.
This all-in-one indicator is a powerful tool for traders who use multiple chart patterns in their technical analysis. By combining these patterns into a single indicator, it simplifies the analysis process and helps traders make informed trading decisions.
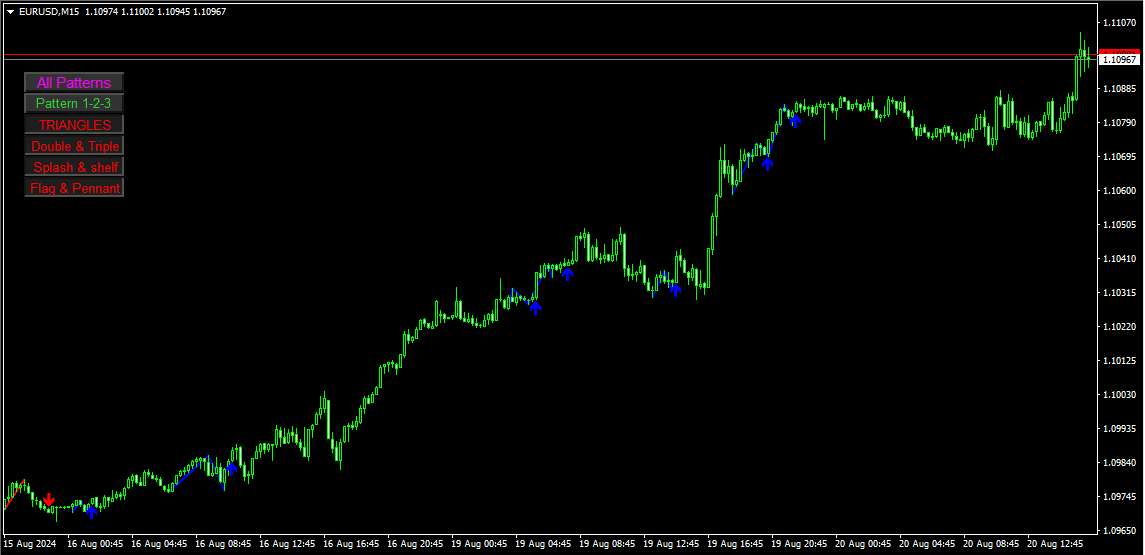


It is a very accurate indicator. I'm waiting for a sign on the 4-hour timeframe and looking for an entry point on the 15-minute timeframe, and both signs are valid.