Kostenpflichtige Handelsroboter und Indikatoren für den MetaTrader 5 - 18
The work of the utility is directed at opening new market orders, maintaining them, transferring the unprofitable orders into profit using an internal loss handling algorithm, trend filtering and various types of trailing stop and take profit. Suitable for any instruments and timeframes. The algorithm works separately for buys and sells, which allows simultaneously working in both directions as well. For the event when the additional orders opened by the utility do not become profitable, a Stop

Indicator that will show your Balance , and your Equity . Really simple to use, no specific requirements to install it. However you can deeply configure it for your own wishes. The pannel has 4 buttons. Only current will display the information of the chart you linked the indicator. If this is deselected, you will have the information of the whole account. Only Buys will display only the BUY orders and Only Sells will display only the SELL orders. Show Zero will display the 0

IMPORTANT: The indicator will remain at the price of $34.90 until the release of the update scheduled for July 16, 2024. The New Price will be $49.90 (taxes excluded) FVG indicator. If you are an SMC trader this indicator will be very useful to you, it automatically identifies the FVGs on the graph distinguishing them into 2 types: bearish FVGs and bullish FVGs (see the photos to understand better). This indicator works on any Timeframe and on any market you want to use it. If you are interested

MT5 Version Dashboard: Free scanner to monitor All pairs and timeframes. Please contact me after purchase, i will send it to you! MT4 version indicator: https://www.mql5.com/en/market/product/59127 Tip: This is an indicator for real-time signal display. When the indicator is loaded and running on the chart, the past signal cannot be displayed Market structure changes as price reverses And filter with all import features built inside one tool. Breaker's smart algorithm detects the reverses,
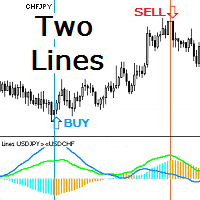
Индикатор показывает две линии динамики движения двух инструментов. Если один из коррелирующих инструментов убегает, другой будет его догонять. Этот принцип даёт точки входа в сделку по их кроссу или для синхронной покупки и продажи в парном трейдинге. Гистограмма индикатора показывает значение дистанции между линиями инструментов. При уменьшении и увеличении дистанции гистограмма принимает разные цвета. Треугольный значок показывает текущее состояние линий: расхождение ( Divergence ) или схо

Experience the Quantum Leap in Trading with Quantum Pending Wizard: Your Ultimate Path to Forex Success Welcome to the forefront of trading innovation with Quantum Pending Wizard ! Tired of the complexities of manual trading holding you back? It’s time to embrace a new era of efficiency and profitability with our cutting-edge automated trading solution. Unlock the Power of Quantum Pending Wizard Redefine your trading journey with Quantum Pending Wizard. Designed by the renowned expert Yuri Cong

The Volume indicator is an excellent tool for measuring tick volume or real volume activity. It quickly and easily helps traders evaluate the volume's current size. The indicator for classification of the volume size uses the moving average and its multiples. Accordingly, the area where the volume is located (relative to the moving average) is labeled as ultra-low, low, average, high, very high, or ultra-high. This indicator can calculate the moving average by four methods: SMA - Simple Moving

The construction of a breakdown system includes the following steps: 1. Determination of the current volatility and the breakdown threshold. The current volatility, in this case, is defined as the difference between yesterday's daily high and the daily low. The breakdown threshold is set at 70-75% of this value. 2. Setting pending buy and sell orders. 3. Entering into a transaction, placing stop loss and take profit orders. Breakouts occur, as a rule, during periods of consolidation. As can be s

BeST_Keltner Channels Strategies MT5 is an MT5 Indicator based on the original Keltner Channels Indicator and it can display in the Chart all the known Variations of Keltner Channels and also the corresponding 10 totally Strategies. Every such generally consists of a Central Moving Average Line and two Boundary Bands at a distance above and below it and can be traded mainly in a Trending Mode but also in a Ranging ReEntry Mode.
BeST_Keltner Channels Strategies Indicator Draws definite Bu

The initial price is 92.25 USD, the future price is 250 USD
Universal advisor with the use of economic and fundamental news " Smart News Trade ". Trading tactics are based on tracking the dynamics of the market and accelerating the price movement. Not guessing, not forecasting, only calculations with clear guidelines for the direction of positions. The work is carried out with pending orders, a stop loss is used to protect funds. A VPS server is required for smooth operation. Ease of use: Th

Trading strategy: Scalping by price speed. The Expert Advisor is based on a complex trading system based on high price fluctuations. The essence of the strategy is that the expert determines high price fluctuations on the chart using complex mathematical calculations and then, if there are good moments to enter the market, the adviser opens pending orders. The EA uses BuyStop and SellStop pending orders. Trading is conducted on the H1 timeframe. The EA does not use Martingale, Grid and other str

For those traders who really care about Volume as an important vector information on Price Action, here is an exclusive idea & creation from Minions Labs: Volume Speed . The Volume Speed indicator shows you visually how much time (in seconds, minutes, hours, you choose) the Volume took to reach the Average Volume of the past bars. This way you can have the exact idea of "what is happening right now with the Volume of the current bar..." and take action accordingly with your strategy, having even

Experte mit automatischer Optimierung aller Parameter für jedes Handelssymbol für MetaTrader 5. T rading EA ohne Einstellungen! Tick Hamster - Dies ist ein automatisierter Handelsexperte für Neulinge und Benutzer, die keinen Berater einrichten möchten! Die Handelsstrategie dieses Handelsberaters wurde 7 Jahre lang getestet. Machen Sie den Handel so einfach wie nie zuvor mit unserem automatisierten Handelsexperten, der speziell für Anfänger entwickelt wurde. Verabschieden Sie sich vom müh

The indicator is intended for recognition and marking 1-2-3 buy and sell patterns on a chart. The indicator will help a trade to determine the starting and signal fractals, and to specify the possible entry points on all timeframes in МetaTrader 5. Fibonacci lines are drawn on the chart to indicate supposed targets of moving on the basis of the wave theory. The 1-2-3 formations appear to be especially important as divergences (convergences) are formed on price tops and bottoms. The indicator has

Heiken Ashi Smoothed Strategy is a very simple but powerful system to get forex market trend direction. This indicator is actually 2 indicators in 1 pack, Heiken Ashi and Heiken Ashi Smoothed Moving Average both included. Because HA (Heiken Ashi) and HAS (Heiken Ashi Smoothed) are calculated in the same one system event with necessary buffers and loop only, so it is the FAST, OPTIMIZED and EFFICIENT HA having the combined indicator of MetaTrader 5. You can choose to display HA and HAS in the sam

Aktueller Preis nur für Erstkäufer. Dann wird es aufgehoben. Letztendlich wird der Roboter 1000 US-Dollar kosten. Blitz ist ein modernes Handelssystem von höchster Qualität. Dieser EA basiert auf den neuesten Entwicklungen im Bereich Deep Machine Learning und den neuesten Technologien neuronaler Netze. Mit uns erhalten Sie einen vollautomatischen Handel mit dem Währungspaar EURUSD. Nach jahrelangen Tests haben wir uns entschieden, den Roboter zum Verkauf freizugeben. Der Roboter verfügt über int
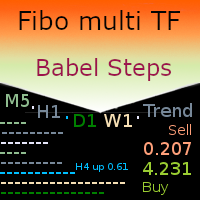
MT5 netting the “Babel Steps” robot uses the ZigZag indicator to generate Fibonacci levels on M1, M5, M15, H1, H4, D1, W1 periods of the charts , calculates the strength of trends for buying and selling. It opens a position when the specified trend level is exceeded plus Bollinger indicators and Stochastic indicators inform about oversold / overbought market. Stochastic and Bollinger indicators help to increase or decrease the position. If market moves into favorable direction the Robot genera

Yggdrasil is a fully automated hedging system . The EA opens orders in both direction on the chosen pairs by the user. Currency pairs aren't traded individually, all trades opened are part of the system. The algorithm will close the unprofitable orders with the available profit. It prevents drawdown to increase if a big trend occurs on a currency pair.
The EA is designed to be efficient with minimal settings . No need fine tuning parameters, it's a long term "set & forget" expert advisor.
A

BeST_Hull Single MA Strategy is an Metatrader Indicator based on the famous indicator Hull Mov.Average . This indicator can display the Single HMA Strategy of just 1 Hull MAvg. It uses added internal filters locating the most likely Entries while it can be used as a standalone system or as an add-on to other ones.
Generally the Hull Moving Average (HMA - developed by Alan Hull) is a directional trend indicator . It captures the current state of the market and uses recent price action to determi
Überwachung. Dieser Berater ist nur für Absicherungskonten gedacht. Metatrader 4-Version Quick Panel Pro
Merkmale Stapelberechnungen sind schnell und einfach. Berechnungen erfolgen sofort, wenn Sie die Stopplinie verschieben. Die meisten Geschäftsvorgänge können mit einem Klick auf diese Bedienfelder schnell erledigt werden. Wechseln Sie schnell zwischen den Panels, indem Sie einfach auf die grüne Schaltfläche klicken. EA kann im Strategy Tester ausgeführt werden. Mit dieser Funktion kö

The Multi Asset Monitor Panel is a game-changer for traders who need to keep an eye on multiple markets simultaneously. This innovative panel allows you to monitor any symbol and any timeframe you need, all within a single, organized interface. With up to three lists of symbols and customizable MT5 templates, you can tailor your monitoring setup to fit your specific trading strategy. What sets the Multi Asset Monitor Panel apart is its flexibility and customization options. You can control the s

BeST_ Elliot Wave Oscillator Strategies is an MT5 indicator which by default is the difference of two SMAs displayed as a histogram fluctuating around zero while a Signal Line generates Entry Signals either in a Reverse or in a Normal Mode and it is a very powerful tool that very often exploits huge market movements.
Signal Line comes in 2 types:
Advanced Get Type – like the corresponding one used in the homonym analysis package Mov. Average Type – as a Moving Average of the Elliot Oscillat

The Volume+ and VSA Signals indicator for MT5 is based on the Volume Spread Analysis (VSA) methodology to provide the signals. The signals are displayed at closing of bars on the main window or subwindow in the form of symbols. The symbols are not repainting. The indicator produces a signal on an individual bar and this signal is not buy or sell signal. When a minor trend goes in the opposite direction of a major trend, there are sequences of major trend-following signals that give a higher pro

This is a non-trading expert which transforms unstructured web-pages into structured data tables. It downloads and parses an HTML file, then creates DOM ( Document Object Model ) for it, and finally applies specified CSS ( Cascading Style Sheets ) selectors for required fields and extracts data for them. You may consider it as a powerful and highly customizable HTML to CSV ( Comma-Separated Values ) converter. The EA can process web-pages from remote sites (using MetaTrader's WebRequest ) or loc
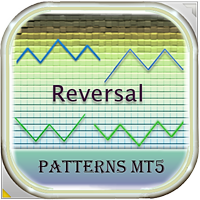
Dieser EA findet Muster der technischen Analyse, die oft vor einer Trendumkehr auftreten: Double Bottom, Triple Bottom, Head and Shoulders und ihre entgegengesetzten Gegenstücke. Der Expert Advisor ist in der Lage, sie auf dem Chart eines Währungspaares zu identifizieren und zu handeln, wenn das Muster gebildet und durchbrochen wurde. Um unnötige Signale auszuschließen (z. B. bei schwacher Volatilität), können Sie auch die Messwerte einiger Indikatoren (Stochastic, ADX) und den Filter nach Kerze

The "Candle Pips MT5" indicator is a tool that helps us a quick way to see the size of the candles on our platform; this is not only of great help to any trader who wants to study the market thoroughly, it is helpful in various strategies that are based on size of the candles. The indicator shows the value in Pips of each candle to our current graph, rounded to an integer.
The indicator also shows the information as a histogram, at the bottom of the graph. It has simple inputs: Candle Type:

Willkommen zur Revolution des Tradings! Wir sind ein Team aus Trading-Experten mit mehrjähriger Erfahrung, das seine Expertise in die Entwicklung von Zazen EA einfließen ließ. Zazen EA kann auch mit PropTrading Firmen (zum Beispiel FTMO) genutzt werden. Die EA verfügt über viele Funktionen (zum Beispiel Drawdown Limit), welche speziell im Bereich PropTrading benötigt werden. Der Name "Zazen" ist kein Zufall. Er leitet sich von der buddhistischen Meditationspraxis ab, die Ruhe, Gelassenheit und K
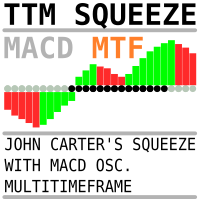
The same indicator as here https://www.mql5.com/ru/market/product/105089?source=Site+Market+My+Products+Page but with timeframe change possibility. It is convinient to see picture from different timeframes in the single chart. When using multiple timeframes, it is recommended (A.Elder "The new trading for a living") to adhere to a coefficient of 5 or 6. That is, the two older timeframes for a 5-minute chart will be 30 minutes and 3 hours.

You can see Binance Spot data instantly in Metatrader 5 and it allows you to use all the features that Metatrader has provided to you. You can access the data of all symbols listed on Binance Futures. Don't forget to set the timezone. Binance it's 00:00 UTC. You need to fix it according to your own country You need to install the free Binance Spot Symbol List plugin. https://www.mql5.com/tr/market/product/83507 After loading, it automatically downloads the data of the cryptos in the market obser

You can see Binance Futures data instantly in Metatrader 5 and it allows you to use all the features that Metatrader has provided to you.
You can access the data of all symbols listed on Binance Futures. Don't forget to set the timezone. Binance it's 00:00 UTC. You need to fix it according to your own country You need to pre-install the free Binance Future Symbol List plugin. https://www.mql5.com/tr/market/product/82891 After loading, it automatically downloads the data of the cryptos in the

The indicator is designed for pair trading with 2 highly correlated instruments.
Indicator charts can be displayed as lines or histograms. There is an MTF mode, the maximum and minimum deltas for the calculated number of bars are displayed with a check for a specified minimum value. It is possible to enable the calculation of trade operations with checking the current correlation coefficient for the minimum specified, the current delta in points or percent of the maximum (minimum) delta and

Stochastic: It was developed by George Lane in the early 1950s. It is based on the principle that the price closes close to the maximum if the asset is on an uptrend, and close to the minimum if it is on a downtrend. Following the idea of the inercial movement of prices. This indicator can generate possible signals of overbought moments or about asset sales. In a usual way it can used according to some standards;
Slow Stochastic: A moving average of 3 periods is calculated on the stochastic i
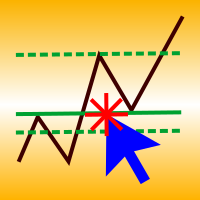
A simple panel to help you to place orders on the chart using the mouse. Hold Left Shift or Left Ctrl and the panel will show the lines where it will place the order already with stop loss and take profit. Use Shift to place buy orders and Ctrl to place sell orders, the panel will switch between stop or limit orders depending if the mouse is above or below the price. Please be aware that Ctrl key is used by Metatrader to copy an object, try to avoid using this panel with charts where you copy ob

MACD divergence signals MACD is called Convergence and Divergence Moving Average, which is developed from the double exponential moving average. The fast exponential moving average (EMA12) is subtracted from the slow exponential moving average (EMA26) to get the fast DIF, and then 2× (Express DIF-DIF's 9-day weighted moving average DEA) Get the MACD bar. The meaning of MACD is basically the same as the double moving average, that is, the dispersion and aggregation of the fast and slow moving a

The principle of construction - on top of any number of bars set by the user, a channel is constructed with maximum and minimum lines so that the bars touch the maximum and minimum of the channel at exactly three points. The name of the indicator follows from this principle. Both vertical lines can be moved along the graph by the user, thus specifying the period on which the channel is built. After a specified period, channel rays are drawn that define a channel in which the price can move.

Created by trader and journalist Larry Williams, Setup 9.1 is a simple strategy that is easy to understand and execute, which is why it is so well known and popular in the world of traders and technical analysis. It is a REVERSION setup, where operations are sought when the moving average changes direction.
Setup Logic
With the open candlestick chart, at any time chart, it is only necessary to add the 9-period Exponential Moving Average (MME9). That done, we look for assets in which the MME

Tool that allows viewing candles in multiple timeframes. This way, it helps the analysis in multiple timeframes.
This is another product developed by Renato Fiche Junior and available to all MetaTrader 5 users!
Input Parameters
- Option 1 - TimeFrame: Standard MT5 timeframe - Option 2 - Custom TimeFrame (in minutes): Or, if this value is different from zero, the timeframe will be customized. This allows you to choose timeframe other than the MT5 standard. - Total Candles: Number of candle

Hello dear traders. Advisor Index 24!
Analogues do not exist! The starting price of the adviser has been reduced! Advisor trades 24 hours a day! Installed on the US30 chart. The EA's algorithm is based on the analysis of the behavior of stock indices on the available history. Trades are opened when stock indices diverge in history. Unique hedging algorithm for two indices at the same time! Due to which the adviser trades with minimal drawdowns. Use a virtual server that works 2

Description: The indicator of tick volumes Better Volume MT5 allows you to assess the general mood of the market and quite accurately catch the moments of the formation of large movements. The indicator is a color histogram in an additional window. In the calculation of Better Volume MT5 the Price Action combinations are taken into account, the values of the volumes with the height of columns and color marking are displayed. Input parameters: MAPeriod - period for calculating the moving average

The trend is your friend!
Look at the color of the indicator and trade on that direction. It does not repaint. After each candle is closed, that's the color of the trend. You can focus on shorter faster trends or major trends, just test what's most suitable for the symbol and timeframe you trade. Simply change the "Length" parameter and the indicator will automatically adapt. You can also change the color, thickness and style of the lines. Download and give it a try! There are big movements

RTS5Pattern-touch-mouse -EN is a revolutionary statistical indicator designed for the MetaTrader 5 platform, bringing an innovative approach to technical analysis and market movement prediction. This indicator combines advanced mathematical methods, including normalization and historical data analysis, with a user-friendly interface and precise trading capabilities. RTS5Pattern-touch-mouse -EN is an ideal tool for traders looking to improve their trading strategies and achieve better results.
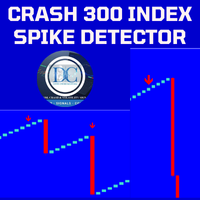
Spike Detector for Boom and Crash Indices
The Spike Detector is specifically designed to cater to the unique needs of traders in the Boom and Crash indices markets. Optimized for M1 (1-minute) and M5 (5-minute) timeframes, this tool ensures you receive timely and actionable insights. Below, you'll find a comprehensive guide on its key features, advantages, installation process, and how to use it effectively.
Key Features and Advantages
1. Non-Repainting: The Spike Detector guarantees accu

O LIVRO VISUAL é uma ferramenta que auxilia na identificação de escoras e renovação de ordens, para quem opera Tape Reading ou fluxo no gráfico é uma excelente ferramenta. Porem ele funciona somente em Mercados Centralizados ou com profundidade nível 2. É de fundamental importância você saber que ele não funciona em Mercado de FOREX. Porem pode ser utilizado no Mercado da B3.
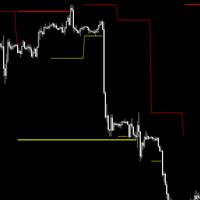
## Check screenshots to see proof that this indictor is a must! ##
Do you hate having to have a Monthly, Weekly, Daily chart when looking at your lower timeframes? I hated it too, so I made this. It will show you the High and Low of other timeframes on your chart, so you will always be aware where some support/resistance may be! Even on the 1 minute chart!
I recommend you use it 3 times, one with Day, Week and Month selected with different line widths.
I use this on every chart I look at

This Expert Advisor (EA) provides automated risk management for your trades by applying essential risk control measures. Upon execution of an order, the EA promptly sets predefined Stop Loss (SL) and Take Profit (TP) levels to safeguard your positions. In addition to SL and TP settings, you have the flexibility to establish a Break Even (BE) price level. This feature automatically adjusts the SL to the BE level once your trade has accumulated a specified number of pips in profit, ensuring that y
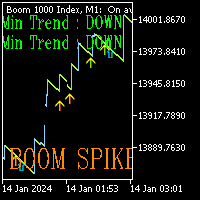
Boom Spike mater is the future for trading Boom markets. It has been designed to run on Boom 300 , 500 and 1000 markets on the 1 minute timeframe. It has 2 different trading modes (Aggressive and Normal) Aggressive mode will plot Yellow and blue arrows. 2 different conditions to help you make the right choice. Enter first trade on yellow arrow and second trade on blue candle. SL in this mode will be 10 Candles from the blue arrow. Normal mode will only plot red arrows on the chart. This mode is

OPTMIISE THE EA BEFORE TEST AND USE. Gold Rush 15 is an Expert Advisor (EA) designed for trading the XAU/USD currency pair on 15-minute charts. This EA is programmed to identify and take advantage of trends in the XAU/USD market, which involves trading the value of gold (XAU) against the US dollar (USD). The primary objective of Gold Rush 15 is to automate trading decisions based on a predefined set of rules and algorithms. It continuously monitors the price movement of XAU/USD on 15-minute time
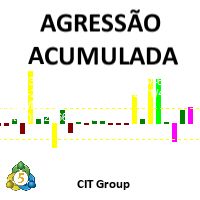
Apresentação:
- O Indicador "Agressão Acumulada" da CIT Group é um indicador especializado na bolsa brasileira (B3).
Objetivo:
- Especificamente desenvolvido para o perfil de pessoas que operam IntraDay.
Funcionamento:
- Calculado com base nos trades realizados durante o pregão, sendo atualizado a cada 1 segundo, tendo maior precisão da agressão
Funcionalidades:
- Entrega de um conjunto de parâmetros para calcular a média de agressão (Volume ou Quantidade), estes podendo

This is a trend follwing indicator, where you can find signals, when there's a crossover between the lines. When current price is above the lines, you are on a long term situation and when price is below the lines, you are on a short one. Period of calculations can be edited. So, with this, if you add other indicators to filter bad signals, you can have a good profitable strategy.

This indicator Displays current spread in the main window of the chart. You can modify the font parameters, indicator's position and the normalization of the spread value. The spread is redrawn after each tick, ensuring the most current and active spread value. This can be useful for brokers with variable spreads or with spreads that are widened often. You can also enable a spread label to be shown near the current Bid line. you can also set alert : Email, and push notifications.
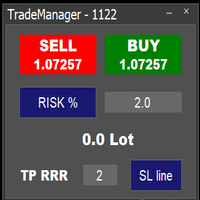
Easy to use trade manager/lotsize calculator. You can chose if you want to risk exact percentage of your account or exact amount of money. You can chose your risk to reward based on stoploss. Then you click on SL line and you can move where exactly you want to have stoploss. When you click on buy or sell, manager will calculate lotsize for you and opens trade. :) :)

--- StudentK Sync Chart --- 1. Move charts at the same time 2. Cross check among different Symbols and Timeframes 3. Plan your own trading strategies
--- Context --- StudentK is not indicated as a master or K Sir for knowledgeable person who claims for winning all the time. (But lots of traders should know the fact that it is rarely truth, especially in fluctuated period of time)
StudentK is a group of years-experienced traders who want to share amazing tools in Free and Paid versions. Aimi
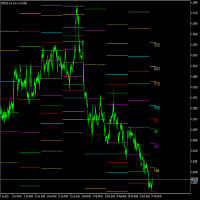
Fibonacci Pivots is a multi-timeframe indicator with custom alerts, designed to help traders easily identify key levels of support and resistance on any financial instrument. This advanced indicator uses the popular Fibonacci sequence to calculate pivot points based on the specified timeframe, depth, and backstep parameters. It also comes with customizable alerts. You can choose to be alerted when the price crosses any of the pivot points or when the price is within a specified frequency and pi

Assistant for all those who forget to set StopLoss, TakeProfit and Trailing Stop in deal parameters, or trade on a very fast market and fail to place them in time. This tool automatically tracks trades without StopLoss, TakeProfit, Trailing Stop and checks what level should be set in accordance with the settings. The tool works both with market and pending orders. The type of orders to work with can be set in the parameters. It can track either trades for the instrument it runs on, or all

This EA helps to Close all Positions opened. It saves you the time of closing multiple positions manually.
Parameters: Buy: Close Buy Positions Only Sell: Close Sell Positions Only Buy & Sell: Close Buy & Sell Positions Pending: Close Pending Orders
More Advanced MT5 version available at: https://www.mql5.com/en/market/product/93301?source=Unknown%3Ahttps%3A%2F%2Fwww.mql5.com%2Fen%2Fmarket%2Fmy More Advanced MT4 version available at: https://www.mql5.com/en/market/product/93468?source=U

A useful scanner/dashboard that shows the RSI values for multiple symbols and Time-frames. It can be easily hidden/displayed with a simple click on the scanner man top left of the dashboard. You can input upper and lower RSI values and the colours can be set to show when above/below these values. The default values are 70 and 30. There are also input colours for when the RSI is above or below 50 (but not exceeding the upper/lower levels
Symbols and time-frames are input separated by commas.

The Spots Expert Advisor is the automated trading bot was created using the Spots indicator based on the common candlestick patterns such as: engulfing, hanging man, doji etc. The main objective for creating this EA is to have a fully automated and low drawdown bot. I'm sharing the first set file on the website, please feel free to optimize it for other pairs and with your forex broker using the preset parameters.

Get a free complementary EA after your purchase! Contact me and ill provide it for you.
MT4 Version: https://www.mql5.com/en/market/product/80369
Time frame: M1
Leverage : Higher the better
Spread: Lower the better
Account type : All types
(EA may enter hedge positions, if you want to disable this feature deactivate either Buy, or Sell from the setting)
Please please do not take unnecessary ris

US30 Ninja is a 5 minute scalping indicator that will let know you when there is a trade set up (buy or sell). Once the indicator gives the trade direction, you can open a trade and use a 30 pip stop loss and a 30 pip to 50 pip take profit. Please trade at own own risk. This indicator has been created solely for the US30 market and may not yield positive results on any other pair.

The market price usually falls between the borders of the channel .
If the price is out of range, it is a trading signal or trading opportunity.
Basically, Fit Channel can be used to help determine overbought and oversold conditions in the market. When the market price is close to the upper limit, the market is considered overbought (sell zone). Conversely, when the market price is close to the bottom range, the market is considered oversold (buy zone).
However, the research can be used

九转序列,源自于TD序列,是因TD序列的9天收盘价研判标准而得名。 汤姆·德马克(Tom DeMark)技术分析界的着名大师级人物,创建了以其名字首字母命名的TD系列的很多指标,价格反转的这个指标就是其中重要的一个,即TD序列。 德马克原版TD序列指标要复杂一些,想研究就自行看关于德马克的资料吧。这里只说简单的TD序列(九转序列)。 九转序列分为两种结构,低九买入结构和高九卖出结构。 TD高九卖出结构:连续出现的九根K线,这些K线的收盘价都比各自前面的第四根K线的收盘价高, 如果满足条件,就在各K线上方标记相应的数字,最后1根就标记为9,如果条件不满足,则K线计数中断,原计数作废重新来数K线。如出现高9,则股价大概率会出现转折。 TD低九买入结构:连续出现的九根K线,这些K线的收盘价都比各自前面的第四根K线的收盘价低,如果满足条件,就在各K线下方标记相应的数字,最后1根就标记为9,如果条件不满足,则K线计数中断,原计数作废重新来数K线。如出现低9,则股价大概率会出现转折。
结构的本质是时间和空间的组合,时间是横轴,空间是纵轴,不同的时间周期和空间大小的组合,形成不同的结构形态,不同

The Multitimeframe-Candles (MCandles) - Indicator for MT5 shows the contour of an higher, free selectable, timeframe as an overlay on the current timeframe. You can freely choose the timeframe, number of candles and color of the overlays. The indicator only calculates the current candle frequently, so it saves computing capacities. If you like the indicator, please left a comment.
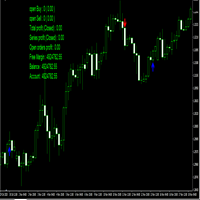
This EA will open buy or sell orders depending on any buffer indicator just but Buy buffer and sell buffer there is a lot of settings in EA like take profit stop loss trailing stop duration time auto lot double lot required profit dollars to close close it reverse
and more you can download demo version and try it back test
Good luck -------------------------------------------------------------- السلام عليكم هذا الاكسبيرت سيفتح شراء او بيع اعتمادًا على اي مؤشر بفر الاكسبيرت يحتوي على الكثير

Version2.1: -Reduced Draw Dawn. Version2: -Added Aggressive Option in inputs to double profit.
-It is time to double your money !! 2x 3x 4x..... -Always Win Strategy. -Enter Balance ONLY and keep other inputs zero. Note: Price will increase 50$ each 10 purchases... Hurry up and catch the discount.
With our strategy, simply the Expert will handle your investment and keeps making you profit. The Expert is developed by experts in reading bars and indicators to analyze EUR-USD, back test

The Donchian Channel Indicator helps to identyfy the market trend and the breakouts of the channel. Breaking above means the momentum of the market is highly bullish. Breaking below means the momentum of the market is highly bearish.
SETTINGS: PERIOD - default value 20. The number of last candles beeing taken into account when generating the line. OFFSET - default value 0. The percentage number that makes the channel bigger or smaller. LINE_COLOR - default color is set Blue. Here you can set w

Crash5 EA ,I s a automatic robot that has the level of professional decision when to take a trade without any emotion. The bot will help in your scalping decision making with its own TP (take profit) and SL (stop loss) with the trail stop when in profit. This is a trend based spike catching ,looking on whats happening in real time charts no repainting of any signals. The robot helps in making decisions on the candle stick pattern opened and closed lat price with the help of RSI ,MACD and the EMA
DEX900 down ,I s a automatic robot that has the level of professional decision when to take a trade without any emotion. The bot will help in your scalping decision making with its own TP (take profit) and SL (stop loss). This is a trend based spike catching ,looking on whats happening in real time charts no repainting of any signals. The robot helps in making decisions on the candle stick pattern opened and closed lat price with the help of RSI ,MACD and the ichimoku cross over for support and
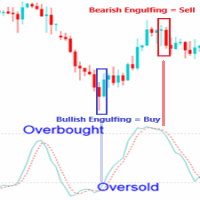
EXPERT ADVISOR DESCRIPTION
- Expert Advisor Engulfing in OBOS (Overbought Oversold) is an expert advisor consisting of a combined candle engulfing pattern and Stochastic Oscillator indicators. A Buy position occurs when engulfing are formed when the signal stochastic indicator is in the oversold area, A sell position occurs when engulfing are formed when the signal stochastic indicator is in the overbought area. - You can combine engulfing that form in certain timeframes with a signal stochas

RaysFX (Average Directional Movement Index)
Technical indicator (ADX) helps to determine the market trend. It was developed and described in detail by Welles Wilder.
The simplest trading method based on the system of directional movement implies comparison of two direction indicators: the 14-period +DI one and the 14-period -DI.
To do this, one either puts the charts of indicators one on top of the other, or +DI is subtracted from -DI.
W. Wilder recommends buying whenever the +DI crosses ab

Tick Speed Pro povides a charted record of tick speed to allow you to see the ebb and flow of market activity. Observing patterns in tick speed may allow you to better time entries to reduce slippage and re-quotes.
The tick speed plot updates it's entire position to show you only the last N seconds you choose, ideal for scalping and HFT approaches. An alert is provided to signal when the instrument is getting ticks at a higher rate than the alert limit. Multiple loadings are supported to compar
MetaTrader Market - der einzige Shop, in dem man Handelsroboter als Demoversion herunterladen und testen sowie anhand historischer Daten optimieren kann.
Lesen Sie die Beschreibung und Bewertungen anderer Kunden über das gewünschte Produkt, laden Sie es direkt ins Terminal herunter und erfahren Sie, wie man einen Handelsroboter vor dem Kauf testet. Nur bei uns können Sie ein Programm testen, ohne dafür zu bezahlen.
Sie verpassen Handelsmöglichkeiten:
- Freie Handelsapplikationen
- Über 8.000 Signale zum Kopieren
- Wirtschaftsnachrichten für die Lage an den Finanzmärkte
Registrierung
Einloggen
Wenn Sie kein Benutzerkonto haben, registrieren Sie sich
Erlauben Sie die Verwendung von Cookies, um sich auf der Website MQL5.com anzumelden.
Bitte aktivieren Sie die notwendige Einstellung in Ihrem Browser, da Sie sich sonst nicht einloggen können.