Conheça o Mercado MQL5 no YouTube, assista aos vídeos tutoriais
Como comprar um robô de negociação ou indicador?
Execute seu EA na
hospedagem virtual
hospedagem virtual
Teste indicadores/robôs de negociação antes de comprá-los
Quer ganhar dinheiro no Mercado?
Como apresentar um produto para o consumidor final?
Pagamento de Expert Advisors e Indicadores para MetaTrader 5 - 18

The ICT Propulsion Block indicator is meant to detect and highlight propulsion blocks, which are specific price structures introduced by the Inner Circle Trader (ICT). Note: Multiple Timeframe version avaiable at here
Propulsion Blocks are essentially blocks located where prices interact with preceding order blocks. Traders often utilize them when analyzing price movements to identify potential turning points and market behavior or areas of interest in the market.
USAGE (fingur

Para aqueles que adoram negociar usando os Candlesticks Heikin Ashi, aqui está mais um aliado poderoso: Heikin Ashi Volume . Este indicador é uma ideia e criação exclusiva nossa aqui na Minions Labs para você. A ideia por trás deste indicador é ter uma pista visual sobre os candlesticks Heiken Ashi apontando para aqueles com grande volume. Para que isso aconteça, você pode escolher entre 2 técnicas diferentes de identificar o volume "alto": Volume maior acima da média dos últimos N bars anterior

The construction of a breakdown system includes the following steps: 1. Determination of the current volatility and the breakdown threshold. The current volatility, in this case, is defined as the difference between yesterday's daily high and the daily low. The breakdown threshold is set at 70-75% of this value. 2. Setting pending buy and sell orders. 3. Entering into a transaction, placing stop loss and take profit orders. Breakouts occur, as a rule, during periods of consolidation. As can be s

BeST_Keltner Channels Strategies MT5 is an MT5 Indicator based on the original Keltner Channels Indicator and it can display in the Chart all the known Variations of Keltner Channels and also the corresponding 10 totally Strategies. Every such generally consists of a Central Moving Average Line and two Boundary Bands at a distance above and below it and can be traded mainly in a Trending Mode but also in a Ranging ReEntry Mode.
BeST_Keltner Channels Strategies Indicator Draws definite Bu

The initial price is 92.25 USD, the future price is 250 USD
Universal advisor with the use of economic and fundamental news " Smart News Trade ". Trading tactics are based on tracking the dynamics of the market and accelerating the price movement. Not guessing, not forecasting, only calculations with clear guidelines for the direction of positions. The work is carried out with pending orders, a stop loss is used to protect funds. A VPS server is required for smooth operation. Ease of use: Th

Void is an advanced grid system that has been operational on real accounts for several years. Unlike many systems that rely on historical data, Void was specifically created to capitalize on existing market inefficiencies, using real market mechanics to generate profits effectively. It supports currency pairs like any currencies in any timeframe. It enters trades without any rules. So, it will directly enter a new trade when you attach to the chart. IMPORTANT! Start trading as low as $40 with

Trading strategy: Scalping by price speed. The Expert Advisor is based on a complex trading system based on high price fluctuations. The essence of the strategy is that the expert determines high price fluctuations on the chart using complex mathematical calculations and then, if there are good moments to enter the market, the adviser opens pending orders. The EA uses BuyStop and SellStop pending orders. Trading is conducted on the H1 timeframe. The EA does not use Martingale, Grid and other str

This indicator shows when user set sessions are active and returns various tools + metrics using the closing price within active sessions as an input. Users have the option to change up to 4 session times.
The indicator will increasingly lack accuracy when the chart timeframe is higher than 1 hour.
Settings
Sessions
Enable Session: Allows to enable or disable all associated elements with a specific user set session.
Session Time: Opening and closing times of the user set session

This is the Full Version, to get the free version please contact me.
The free version works on “AUDNZD” and “XAUUSD” charts.
All symbols and time frames scanner
Head and Shoulder
One of the most popular Price Action patterns is the Head and Shoulders pattern. The pattern has three local tops that resemble the left shoulder, head, and right shoulder. The head and shoulders chart pattern appears in all kinds of markets, including Forex, cryptocurrency, commodities, stocks, and bonds. The

tO indicador é destinado ao reconhecimento e marcação dos padrões 1-2-3 comprar e vende de um gráfico. O indicador vai ajudar um negócio para determinar o início e o sinal de fractais, e especificar os possíveis pontos de entrada em todos os tempos do МetaTrader 5. Linhas de Fibonacci são desenhados no gráfico para indicar supostos alvos de movimento sobre a base da teoria ondulatória. As formações 1-2-3 parecem ser especialmente importante como as divergências (convergências) são formados em to

O rompimento de uma linha de tendência, bem como uma alta ou baixa, geralmente sinaliza uma mudança (ou continuação) da tendência. Este indicador exibe linhas nas máximas e mínimas do preço, bem como localiza e exibe linhas de tendência inclinadas. Assim que o preço ultrapassa a linha e o candle fecha, o indicador sinaliza isso com uma seta (você também pode ativar alertas). Este indicador é fácil de usar, no entanto, existem muitas estratégias de negociação que se baseiam nas rupturas das linh

Heiken Ashi Smoothed Strategy is a very simple but powerful system to get forex market trend direction. This indicator is actually 2 indicators in 1 pack, Heiken Ashi and Heiken Ashi Smoothed Moving Average both included. Because HA (Heiken Ashi) and HAS (Heiken Ashi Smoothed) are calculated in the same one system event with necessary buffers and loop only, so it is the FAST, OPTIMIZED and EFFICIENT HA having the combined indicator of MetaTrader 5. You can choose to display HA and HAS in the sam

Túnel de Vegas, com até 20 níveis, permitindo plotar ou não cada nível com troca de cor, espessura das linhas e visualização ON/OFF para facilitar a utilização.
Recomendado a utilização para timeframes:
Original --> H1
Fractais --> M15, M30, H4, D1 e W1 Teste em Gráfico W1 apresentando consistência.: https://www.mql5.com/pt/signals/2211259 Acompanhe os resultados no meu sinal:
https://www.mql5.com/pt/signals/2211259
Tiago Lacerda Telegram: @tfmlacerda
E-mail: mediador@gmail.com
Yo
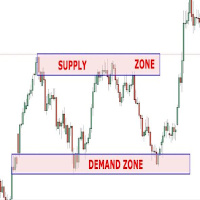
This Expert Advisor can be applied to many markets because It exploits basic supply/demand and price action concepts. It identifies the major rotation zones (PRZ), supply and demand zones and supports and resistances within major price trends. It buys at discount zones and sells at premium prices. It can and should be optimized through the Metatrader tester to find the best parameters to use for current market conditions. This is not a fixed strategy rather a full trading algo that will find whi

BeST_Hull Single MA Strategy is an Metatrader Indicator based on the famous indicator Hull Mov.Average . This indicator can display the Single HMA Strategy of just 1 Hull MAvg. It uses added internal filters locating the most likely Entries while it can be used as a standalone system or as an add-on to other ones.
Generally the Hull Moving Average (HMA - developed by Alan Hull) is a directional trend indicator . It captures the current state of the market and uses recent price action to determi
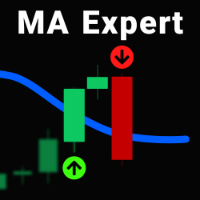
In previous products , we have published an indicator of this strategy, but now we offer you an Expert Advisor to make it easier for traders
The procedure is whenever the price or the candle (depending on entry condition in the "Inputs" section, "Touch_Line", or "Close_Candle"), hits the Moving Average, the EA will open a position buy/sell automatically based on the volume, SL and TP that you specify in the " Inputs " section.
You also can define the direction of the positions, Buy, Sell, o
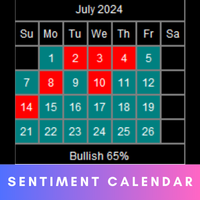
The Market Sentiment calendar provides a visual representation of market sentiment for each day or month. It will display daily and monthly BIAS . The calendar also highlights the percentage of bullish days or months within a given month or year. MT4 version - https://www.mql5.com/en/market/product/120767/ Inputs Frequency: Choose between "Daily" and "Monthly" calendar views. Sentiment Method: Select the method to determine daily or monthly sentiment: " L inear Regression ", " Accumu

Blahtech Fisher Transform indicator is an oscillator that displays overbought and oversold locations on the chart. The Fisher Transform algorithm transforms prices with any distribution shape into a normal distribution. The end result is a curve with sharp turning points that may help to identify bullish or bearish trends. Fisher Transform values exceeding 1.66 on the daily chart are considered to be good areas for reversal trades. Links [ Install | Update | Training | All Products ]

OPTIMIZE BEFORE BACKTEST AND USE Trade crude oil with this EA. No EA turns hundreds into millions in a year or 2, This is a lie if presented this way. Black Gold trades Brent Crude on 1 min charts. It uses RSI, moving averages and directional indicators. Try it out, load it onto the tester if you have the history and ability to trade Brent crude.
Adjust and optimize to get the most out of the expert advisor

Close All and Change Take Profit and Stop Loss All Orders. Main Features
Ability to Close All Orders the Symbol you put this EA. Ability to Change Take Profit to All Order. Ability to Change Stop Loss to All Order. Show Order count. Show Average price with info and Horizontal Line. Show lot open.
Show Price diff from average to price now Show broken price with info and Horizontal Line. Easy to use . How to use
Close All (Symbol) PC : you can click on Clos

All Symbols AND All Time frames Scan
Document Introduction
A breakout refers to when the price of an asset moves above a resistance zone or moves below a support zone. A breakout indicates the potential for a price trend to break.Break provides a potential business opportunity. A break from the top signals to traders that it is better to take a buy position or close a sell position. A breakout from the bottom signals to traders that it is better to take sell positions or close the

The Accurate Gold indicator is a user-friendly tool that is both intuitive and simple to use , regardless of traders' level of experience. It is designed for traders seeking precise signals on the M5 timeframe in the gold market. This indicator employs advanced mathematical algorithms to analyze price movements and volume dynamics, generating accurate buy and sell signals. The distinctive features of this indicator, including its non-repainting nature, provide traders with valuable insi

This is a non-trading expert which transforms unstructured web-pages into structured data tables. It downloads and parses an HTML file, then creates DOM ( Document Object Model ) for it, and finally applies specified CSS ( Cascading Style Sheets ) selectors for required fields and extracts data for them. You may consider it as a powerful and highly customizable HTML to CSV ( Comma-Separated Values ) converter. The EA can process web-pages from remote sites (using MetaTrader's WebRequest ) or loc

The trading system is designed to work with gold on time periods: 30M, 1H. The indicator allows you to adjust to the market situation.
Parameters for 1H : PERIOD=9F , FILTER=300 .
Parameters for 30M : PERIOD=22B , FILTER=450 .
A small adjustment to a specific broker is allowed .
If you change the amount of history displayed, you may also need to adjust the parameters.
The indicator is not redrawn.
"Gold n XAU" uses different rules for entering a trade and different
Esta é a Boleta Long & Short NT-HDG, um Expert Advisor criado com a função que irá facilitar e muito as operações realizadas em Long & Short. > Com apenas um clique é possível montar posição em dois ativos simultaneamente, acelerando ainda mais suas ações logo após a tomada de decisão. > Com ela é possível também operar em contas Hedge podendo montar posição no mesmo ativo, para aqueles que possuam estratégias com essa finalidade. > Pode ser usada em vários mercados e ativos. > Na nova versão f
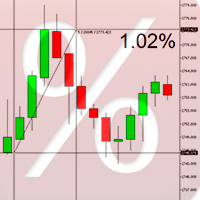
Percent Crosshair é uma ferramenta de medida percentual poderosa e fácil. Meça a porcentagem de seu gráfico de maneira muito mais rápida! Não desperdice mais o seu tempo! Basta anexar o indicador Percent Crosshair ao gráfico, selecione o modo de cruz na barras de ferramentas ou pressione "Ctrl + F" e comece a usar a cruz como você sempre fez! A medida em percentagem estará ao lado do preço indicativo. Personalize o seu indicador da maneira que você quiser! Há 4 parâmetros de entrada: Positive %

O Heikin Ashi Delta PRO aproveita a refinada elegância dos candlesticks Heikin Ashi, conhecidos por sua capacidade de filtrar ruídos do mercado e destacar tendências e reversões mais claras. Construído sobre uma base sólida, este indicador avançado integra o método da Média Móvel de Hull, aprimorando sua precisão e responsividade. Junto com um sistema de alerta intuitivo, ele transforma os dados brutos do mercado em insights comerciais acionáveis, capacitando os traders a tomar decisões mais inf
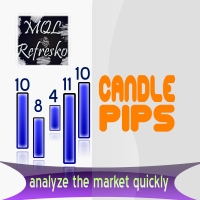
The "Candle Pips MT5" indicator is a tool that helps us a quick way to see the size of the candles on our platform; this is not only of great help to any trader who wants to study the market thoroughly, it is helpful in various strategies that are based on size of the candles. The indicator shows the value in Pips of each candle to our current graph, rounded to an integer.
The indicator also shows the information as a histogram, at the bottom of the graph. It has simple inputs: Candle Type:

Welcome to the revolution of trading! We are a team of trading experts with many years of experience who have channelled their expertise into the development of Zazen EA. Zazen EA can also be used with PropTrading companies (for example FTMO). The EA has many functions (e.g. drawdown limit) that are specifically required in the area of prop trading. The name "Zazen" is no coincidence. It is derived from the Buddhist meditation practice that promotes calmness, serenity and clarity. Zazen EA is no

Warren Buffett famously said: "Be greedy when others are fearful. Be fearful when others are greedy." This expert advisor captures the very essence of this wisdom.
Indeed, since 1871, the U.S. stock index S&P500 has been growing at an average annual rate of 10%. That is why Warren Buffett has been advocating investing in it.
This EA boosts the annual return to 150% (or 8% monthly) by utilizing a grid approach. Simply attach it to the S&P500 chart (or "US500" / "US500Cash" for some brokers)
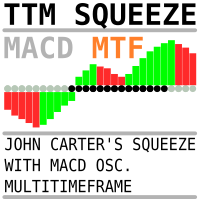
The same indicator as here https://www.mql5.com/ru/market/product/105089?source=Site+Market+My+Products+Page but with timeframe change possibility. It is convinient to see picture from different timeframes in the single chart. When using multiple timeframes, it is recommended (A.Elder "The new trading for a living") to adhere to a coefficient of 5 or 6. That is, the two older timeframes for a 5-minute chart will be 30 minutes and 3 hours.

You can see Binance Spot data instantly in Metatrader 5 and it allows you to use all the features that Metatrader has provided to you. You can access the data of all symbols listed on Binance Futures. Don't forget to set the timezone. Binance it's 00:00 UTC. You need to fix it according to your own country You need to install the free Binance Spot Symbol List plugin. https://www.mql5.com/tr/market/product/83507 After loading, it automatically downloads the data of the cryptos in the market obser

Estocástico: Ele foi desenvolvido por George Lane no início da década de 1950. Ele é baseado no princípio de que o preço fecha perto da máxima se o ativo está em uma tendência de alta, e perto da mínima caso esteja em uma tendência de baixa. Seguindo a ideia do movimento inercial dos preços. Este indicador pode gerar possíveis sinais de momentos de sobrecompra ou sobre vendas de ativos. De um modo usual ele pode utilizado segundo alguns padrões;
Estocástico Lento: Uma média móvel de 3 período

MACD divergence signals MACD is called Convergence and Divergence Moving Average, which is developed from the double exponential moving average. The fast exponential moving average (EMA12) is subtracted from the slow exponential moving average (EMA26) to get the fast DIF, and then 2× (Express DIF-DIF's 9-day weighted moving average DEA) Get the MACD bar. The meaning of MACD is basically the same as the double moving average, that is, the dispersion and aggregation of the fast and slow moving a

Description: The indicator of tick volumes Better Volume MT5 allows you to assess the general mood of the market and quite accurately catch the moments of the formation of large movements. The indicator is a color histogram in an additional window. In the calculation of Better Volume MT5 the Price Action combinations are taken into account, the values of the volumes with the height of columns and color marking are displayed. Input parameters: MAPeriod - period for calculating the moving average

This indicator will draw a label above or below each candle based on Rob Smith's The Strat as they develop over time on your chart.
As price evolves, a candle can switch between three states. When the candle first opens, if it sits completely within the previous candles high and low, then it will start as a Type 1. As time moves on, if it breaks either the high or low of the previous candle, it will be come a type 2, and should the price action be volatile and directionless, it may then

This indicator/dashboard , is place on a single symbol. It shows the percentage of movement withing all time frames from M1 to W1.The text will change green if all % are in the positive for a buy signal.The text will change red if all % are below zero and in negative for a sell signal. There are audible notifications, as well as on screen notifications along with push notifications that can be turned on and ON/OFF in the settings.
This is a sure way to Find trends quickly and efficiently, with

RTS5Pattern-touch-mouse -EN is a revolutionary statistical indicator designed for the MetaTrader 5 platform, bringing an innovative approach to technical analysis and market movement prediction. This indicator combines advanced mathematical methods, including normalization and historical data analysis, with a user-friendly interface and precise trading capabilities. RTS5Pattern-touch-mouse -EN is an ideal tool for traders looking to improve their trading strategies and achieve better results.
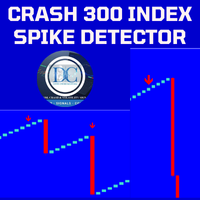
Spike Detector for Boom and Crash Indices
The Spike Detector is specifically designed to cater to the unique needs of traders in the Boom and Crash indices markets. Optimized for M1 (1-minute) and M5 (5-minute) timeframes, this tool ensures you receive timely and actionable insights. Below, you'll find a comprehensive guide on its key features, advantages, installation process, and how to use it effectively.
Key Features and Advantages
1. Non-Repainting: The Spike Detector guarantees accu
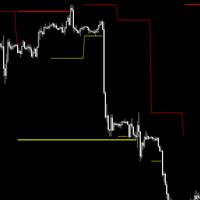
## Check screenshots to see proof that this indictor is a must! ##
Do you hate having to have a Monthly, Weekly, Daily chart when looking at your lower timeframes? I hated it too, so I made this. It will show you the High and Low of other timeframes on your chart, so you will always be aware where some support/resistance may be! Even on the 1 minute chart!
I recommend you use it 3 times, one with Day, Week and Month selected with different line widths.
I use this on every chart I look at

indicator is no repaint trend indicator.for mt5 when white stars up to Red histogram that is probably end of long trades. when White stars up to Blue histogram that is probably end of down trades. indicator can use all pairs and lower than weekly charts, to use weekly chart need to at least 500 bars data on back.and lowering processing value 500. it is also suitable for 1m charts. indicator hold long way to go. there is not too many signals.

This Expert Advisor (EA) provides automated risk management for your trades by applying essential risk control measures. Upon execution of an order, the EA promptly sets predefined Stop Loss (SL) and Take Profit (TP) levels to safeguard your positions. In addition to SL and TP settings, you have the flexibility to establish a Break Even (BE) price level. This feature automatically adjusts the SL to the BE level once your trade has accumulated a specified number of pips in profit, ensuring that y

OPTMIISE THE EA BEFORE TEST AND USE. Gold Rush 15 is an Expert Advisor (EA) designed for trading the XAU/USD currency pair on 15-minute charts. This EA is programmed to identify and take advantage of trends in the XAU/USD market, which involves trading the value of gold (XAU) against the US dollar (USD). The primary objective of Gold Rush 15 is to automate trading decisions based on a predefined set of rules and algorithms. It continuously monitors the price movement of XAU/USD on 15-minute time

This indicator Displays current spread in the main window of the chart. You can modify the font parameters, indicator's position and the normalization of the spread value. The spread is redrawn after each tick, ensuring the most current and active spread value. This can be useful for brokers with variable spreads or with spreads that are widened often. You can also enable a spread label to be shown near the current Bid line. you can also set alert : Email, and push notifications.

Grid trading is when orders are placed above and below a set price, creating an order grid with increasing and decreasing prices. Grid trading is most commonly associated with the foreign exchange market. In general, the technique seeks to capitalize on the normal volatility of an asset's price by placing buy and sell orders at certain regular intervals above and below a predefined base price. For example, a forex trader can place buy orders every 15 pips above a set price, while also placing se

This EA helps to Close all Positions opened. It saves you the time of closing multiple positions manually.
Parameters: Buy: Close Buy Positions Only Sell: Close Sell Positions Only Buy & Sell: Close Buy & Sell Positions Pending: Close Pending Orders
More Advanced MT5 version available at: https://www.mql5.com/en/market/product/93301?source=Unknown%3Ahttps%3A%2F%2Fwww.mql5.com%2Fen%2Fmarket%2Fmy More Advanced MT4 version available at: https://www.mql5.com/en/market/product/93468?source=U

The Spots Expert Advisor is the automated trading bot was created using the Spots indicator based on the common candlestick patterns such as: engulfing, hanging man, doji etc. The main objective for creating this EA is to have a fully automated and low drawdown bot. I'm sharing the first set file on the website, please feel free to optimize it for other pairs and with your forex broker using the preset parameters.
RSI Trade X MT5 is an EA based on Relative Strength Index. Relative Strength Index parameters such as Period, BuyShift, BuyValue, SellShift and SellValue can be adjusted. RSI Trade X MT5 applies BTN TECHNOLOGY's state-of-the-art intelligent technology to help you create optimal results for your trades. May your dreams come true through RSI Trade X MT5. Good luck. === Inquiries === E-Mail:support@btntechfx.com

This EA will open buy or sell orders depending on any buffer indicator just but Buy buffer and sell buffer there is a lot of settings in EA like take profit stop loss trailing stop duration time auto lot double lot required profit dollars to close close it reverse
and more you can download demo version and try it back test
Good luck -------------------------------------------------------------- السلام عليكم هذا الاكسبيرت سيفتح شراء او بيع اعتمادًا على اي مؤشر بفر الاكسبيرت يحتوي على الكثير

Hello You can copy orders between terminals for any computer via Internet (MT4 to MT4) or (MT4 to MT5) or (MT5 to MT4) or (MT5 to MT5)
it's fast Open orders Modification Stop Loss and Take Profit Close Orders This is EA (slave) put it in Experts folder you must buy (Copy orders for any computer via Internet Master) EA too from this link if you want to copy from MT4
https://www.mql5.com/en/market/product/55096 if you want to copy from MT5
https://www.mql5.com/en/market/product/56397

Hello You can copy orders between terminals for any computer via Internet (MT4 to MT4) or (MT4 to MT5) or (MT5 to MT4) or (MT5 to MT5) it's fast Open orders Modification Stop Loss and Take Profit Close Orders This is EA (Master) put it in Experts folder you must buy (Copy orders for any computer via Internet Slave) EA too from this link if you want to copy to MT4
https://www.mql5.com/en/market/product/55097 if you want to copy to MT5
https://www.mql5.com/en/market/product/56414
Pleas
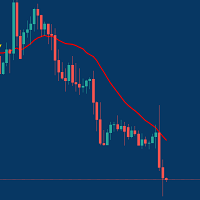
Managing Trades With Moving Average EA : Many Traders like using Moving Averages for trend confirmation , and timing Entry and Exits . With Semi- Automatic Moving Average EA we provide effective way to manage open trades as per your Moving average strategy and uses MA as trailing stop loss. EA considers only closing price of candle therefore avoids stop outs caused by sudden price fluctuations and helps to stay in trend longer. You can decide which MA to use and various settings of MA

The indicator show Higher timeframe candles for ICT technical analisys Higher time frames reduce the 'noise' inherent in lower time frames, providing a clearer, more accurate picture of the market's movements.
By examining higher time frames, you can better identify trends, reversals, and key areas of support and resistance.
The Higher Time Frame Candles indicator overlays higher time frame data directly onto your current chart.
You can easily specify the higher time frame candles yo

Introducing the BlackWing Signal Provider—an advanced EA designed to enhance your trading experience by facilitating seamless communication between your MetaTrader 5 platform and Telegram channels, groups, or individual users.
Key Features:
1. Real-Time Event Notifications: Receive instant alerts on new trades, modified orders, closed positions, and deleted orders. Stay informed and make well-timed decisions.
2. Interactive Chart Snapshots: Share chart snapshots along with new trades and

Технический индикатор широко известен читателям и поклонникам стратегии «черепах». Отображается линией по нижней/верхней точке цены за определенный интервал времени. Значение ценового канала также используют для определения зон поддержки и сопротивления. Если котировки актива прорывают и закрываются ниже/выше канала, то это является сигналом работы в сторону пробоя. Способы применения: Индикатор является самодостаточным и не требует дополнительных фильтров для начала работы. Однако для надёжност

In the ever-evolving world of Forex trading, understanding the different trading sessions is paramount to making informed trading decisions. Each trading session brings its own unique characteristics, opportunities, and challenges, and recognizing these can greatly enhance your trading strategies. Whether you're a novice or a seasoned trader, the Forex market's three main trading sessions – Asian, London, and New York – are crucial milestones that dictate market behavior and potential trade set

READ BEFORE TESTING! This EA works with EURUSD Best inputs already chosen. This is a simplified version of my other ea "The 3bar high ea". It as shown better results since I took out the macd filter. Below I present to you a 4 year backtest using a 10k account, trading 0.5 every time. The results are astonishing, check it out: 2020 --- 30 July 2024
2050 trades 1571 profitable (76,63%) 24 consecutive winning trades Low drawdown, (
EXPERT ADVISOR DESCRIPTION
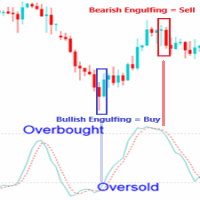
- Expert Advisor Engulfing in OBOS (Overbought Oversold) is an expert advisor consisting of a combined candle engulfing pattern and Stochastic Oscillator indicators. A Buy position occurs when engulfing are formed when the signal stochastic indicator is in the oversold area, A sell position occurs when engulfing are formed when the signal stochastic indicator is in the overbought area. - You can combine engulfing that form in certain timeframes with a signal stochas

The indicator helps the trader in identifying potential liquidity levels. The algorithm used in this indicator checks the behavior of the asset taking into account the price levels, momentum and volume analysis. Features:- Parameters for signal optimization and alerts. Usage:- The levels formed by the indicator can be helpful to traders in identifying potential entries, breakouts or reversals. it can assist traders of technical trading background or even pure price action trading.
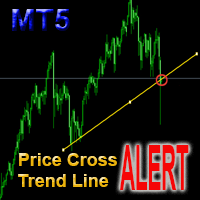
This is a support tool that will notify you when the price crosses a trend line, you can draw any trend line by manual, and you can change or drag it on chart in working time This tool will automatically update the new location of the trend line to alert you How to use: after added it on chart, you will draw a trend line and set name of the trend line same as in input of the tool (the parameter LineName ) There are 3 notification methods : Pop Up Alert, Send Email or Notification You can choose
This EA trails your stops based on percentage of current TP, for both manually and auto-opened trades. You can edit the percentage value in the inputs. Trailing stop is a more flexible variation of a normal exit order. T railing stop is the practice of moving the stop-loss level closer to the current price when the price moves in your favor. Trailing the stop-loss allows traders to limit their losses and safeguard their positive trades. It is a very popular practice. This EA will manage you

MACD is probably one of the most popular technical indicators out there. When the market is trending, it actually does a pretty good job, but when the market starts consolidating and moving sideways, the MACD performs not so well. SX Impulse MACD for MT4 is available here . Impulse MACD is a modified version of MACD that works very well for trading Forex, stocks, and cryptocurrencies. It has its own unique feature which perfectly filters out the values in a moving average range and enables it

The Schaff Trend Cycle indicator is the product of combining Slow Stochastics and the moving average convergence/divergence (MACD). The MACD has a reputation as a trend indicator, but it's also notorious for lagging due to its slow responsive signal line. The improved signal line gives the STC its relevance as an early warning sign to detect currency trends. this indicator is converted from Trading View code of STC Indicator - A Better MACD [SHK]

The KT Knoxville Divergence is a powerful tool that reveals unique price divergences in a financial instrument by employing a carefully crafted combination of the Relative Strength Index (RSI) and a momentum oscillator. This indicator effectively captures subtle variations in market dynamics and assists traders in identifying potentially profitable trading opportunities with greater precision. Knoxville Divergences is a type of divergence in trading developed by Rob Booker. Divergence in tradin

Rayert - утилита, позволяющая расставлять уведомления на необходимых уровнях. Уведомления происходят как в самом терминале, так и на мобильныйх устройствах путем Push уведомлений. Варианты использования Разметка ликвидности на графике и реагирование при сборе ликвидности. Устанвока уведомлений на уровнях приняти решений. Настройка Можно указать различные цвета линий выше и ниже свечи, до пересечения ценой и после пересечения соответственно. Рисование линий на переднем или заднем фоне. Примагничи
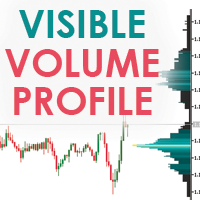
Visible Market Profile graphically represents the amount of trades made on each price level. This indicator in particular, unlike the daily market profile , is calculated on the visible area of the chart.
Visible Market Profile cannot be considered an indicator of operational signals, but it can be a good support for reading the market, in addition to what is already used by every trader in his work process. The Visible Market Profile is able to determine with a good approximation the pric
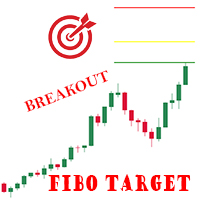
Indicador mostra no gráfico 3 níveis de expansão de Fibonacci, baseado no último Pivô rompido. Os pivôs são calculados com base na volatilidade (ATR), por isso funciona em qualquer ativo, em qualquer Timeframe. As linhas são exibidas apenas após o rompimento do pivô. Um comentário no canto superior esquerdo mostra o valor mínimo calculado para os pivôs. Parâmetros: Variação: variação mínima para considerar o pivô. Fator de multiplicação da ATR. (default 3) Periodo ATR: Período para cálculo da AT

Any financial instrument that is traded on the market is a position of some active towards some currency. Forex differs from other markets only in the fact, that another currency is used as an active. As a result in the Forex market we always deal with the correlation of two currencies, called currency pairs.
The project that started more than a year ago, helped to develop a group of indicators under a joint name cluster indicators. Their task was to divide currency pairs into separate currenci

Multi-timeframe indicator Relative Strength Index displays information simultaneously from different periods in one subwindow of the chart.
Parameters Period of averaging — averaging period for the RSI calculation. Type of price — price used. Timeframes for RSI — list of periods, separated by a space or comma or semicolon. Number of bars for each period — the number of bars displayed for each period. Sort periods — sort periods if they are listed in no particular order. Current period first —

This indicator provides a true volume surrogate based on tick volumes. It uses a specific formula for calculation of a near to real estimation of trade volumes distribution , which may be very handy for instruments where only tick volumes are available. Please note that absolute values of the indicator do not correspond to any real volumes data, but the distribution itself, including overall shape and behavior, is similar to real volumes' shape and behavior of related instruments (for example, c
O Mercado MetaTrader é o melhor lugar para vender robôs de negociação e indicadores técnicos.
Você apenas precisa desenvolver um aplicativo para a plataforma MetaTrader com um design atraente e uma boa descrição. Nós vamos explicar como publicar o seu produto no Mercado e oferecer a milhões de usuários MetaTrader.
Você está perdendo oportunidades de negociação:
- Aplicativos de negociação gratuitos
- 8 000+ sinais para cópia
- Notícias econômicas para análise dos mercados financeiros
Registro
Login
Se você não tem uma conta, por favor registre-se
Para login e uso do site MQL5.com, você deve ativar o uso de cookies.
Ative esta opção no seu navegador, caso contrário você não poderá fazer login.