Handelsroboter und Indikatoren für den MetaTrader 5 - 94

Professional Candles It is the indicator 4 of the Safari pack It has an oscillator that marks each point of the forces of the candles Not only that, but it also measures it by color to be able to fit in perfectly. It is used for scalping and intra day, works for forex markets and synthetic indices works for all pairs ideal for volatility and jumps! works for all seasons! Good profit!

Filter Professional , Safari pack indicator 3, It has an indicator that is a type of moving average with color that will mark the entrance perfect at different times, when it marks the green line, an upward trend is coming and it is entry for purchase, when it marks the gold line it is a downtrend gives bearish entry zone. It is used for the Forex markets and synthetic indices all pairs! All temporalities! Good profit!

Renko Professional, Safari pack indicator 2 . On this occasion it has the professional renko indicator, which has the strategy of support, resistance, bullish green line and bearish red line. It marks the entry points and accumulation points very well! It works for all seasons! For the forex markets and synthetic indices ! Works for all pairs! Good profit!

Strength Safari , First indicator of the safari pack On this occasion we have an oscillator that gives perfect crosses indicating where the clear input is At two points is the green line and the gold line where the entrance marks you where it touches the floor or ceiling At the crossing of the lines, the green one above the gold marks the ascent zone, The gold crossing the truth marks the drop zone, ideal for grabbing long trends! used at any time in the Forex and Synthetic Indices markets! Good

This is the MT5 version of the absolute OCD tool that delivers Position Size Calculator and many more other options of the matured PSI Position Smart Indicator NEW check the FULL Version Including the private ICT tools limited so far until the release of the full 2016 Mentorship Core Content to the public. Indicator type: Money Management Calculator; Forex Position Size Calculator; Fixed or ATR value for Stop Loss and Take Profit levels; Average Position Size Indicator (True Average Price); Acc

dmi jungle It is the last indicator of the jungle pack On this occasion, it has the DMI jungle indicator, which goes from the strategy of the oscillator with the line crossing, and the color changes, when it gives a line crossing and a color change from gold to lightgreen it is a trend change vice versa it is always the same with the crossing of the line! It works for Forex markets and synthetic indices! Suitable for all seasons! Good profit!

Stochastic Jungle . It has a new pack called jungle, on this occasion I bring the indicator, stochastic jungle that has the strategy of high ranges and low ranges to better hunt trends and entries according to their temporality He is professionally programmed to make entries with high effectiveness percentages, where it touches the green ceiling and changes color to orange marks entry into low where it is upside down and touches the floor with the orange color changing to green is an upward entr

Profit Aqua , It is an indicator that belongs to the jungle project that has 3 indicators On this occasion, play with the profit aqua indicator, that has the strategy of a professionally programmed moving average to facilitate all types of entry It has the color change strategy, as seen in the photo when it changes red it is clearly marking a short entry when the green color clearly marks you in long, You can do scalping and at long periods of time! It is used for forex and synthetic indices Sui

EA AMPV System is an automated trading advisor based on the RSI, Bollinger Bands and MACD combined strategy which is well suited for both beginners and experienced traders.
The minimum deposit is $100 for a 1:100 leverage.
I recommend to use a 1:100 ECN account with a low spread and a fast VPS.
Optimized for XAUUSD pair on 1 minute timeframe.
Due to the simplicity and convenience of this EA every user can give it a try and choose the strategy and the appropriate lot size which will matc
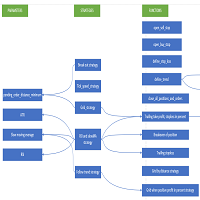
This EA can be used to automatically trade several strategies, or can be used as trade assistant. Following strategies can be used: · Break out strategy; · Tick speed strategy; · Grid strategy; · RSI and slow MA strategy; · Follow trend strategy. Explaining some parameters: orderable_spread – spread in points. If symbol’s spread is greater than the parameter EA does not open positions. Video for introduction and use as an assistant: https://www.youtub

Get the best out of your forex trading experience with our Superb Trend indicator! Our revolutionary technology helps you make smarter and more successful trades, no matter your skill level. With a simple and intuitive interface, you'll be able to analyze trends and make wiser decisions in no time. Stop gambling with your money; start leveraging our Superb Trend Indicator to outperform the market!
Trend Signals: Bullish trend will show as Green line. Bearish trend will show as Red line.
Su
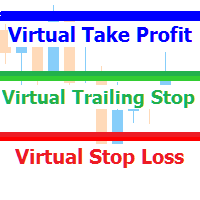
A utility for managing open positions using virtual (invisible to the broker) stops. Virtual stop loss and virtual take profit can be freely moved around the chart. If the price touches the virtual stop line (TP, SL, TS), the EA will close all orders of the same direction on the current chart. Closing orders by virtual take profit is possible only if there is a profit.
With the help of the built-in trading simulator, you can, in the strategy tester, see how the adviser works. Parameters Block

Events Timer EA allows you to place a trade at a specific time and close it at a specific. The stop loss is trailed automatically. The EA performs one trade at time until the time elapses. Since it has a Trailing Stop, it will open another trader when it gets stopped out. It is ideal for trading news events using a very short trading time. Inpits: -Trade Time -Stop Trade Time -Trade Type(buy/sell) -lot -stoploss points

My Pivot Pro is the Pro Version of the Indicator " My PIVOT " ( Link: https://www.mql5.com/en/market/product/90336 ) This indicator will help you a lot to decide the Market Range and Movement. This Indicator is based on Pivot Lines and Support-Resistance zones. Now we can Plot Standard/Classic; Fibonacci; Demark; Camarilla nd Woodies Pivot Levels as per our requirements.
Steps to Setup the Indicator: Install the Custom Indicator; Set the Pivot Type; Period and Time ( We recommend to use

Equal Highs and Lows Indicator
Find and Mark Equal Highs and Lows on chart of Selected Multi Time frames. Options:
set min and max bars between Equal High's / Low's bars set max points difference between High's / Low's ( Sensitivity )
Select time frames by buttons on chart Select / Filter only High's or Low's by a button Extend Equal High's / Low's line forward for chart reference
Manual
MT4 version
MT5 version
Other Indicators

Identify Pinbar Candle Pattern with Arrows & Alert (built-in RSI filter).
This indicator helps you to identify Pin bar Candlestick Pattern (or shooting star & hammer pattern) on the chart with arrows, along with an alert when a new Pin bar appears. Pin bar pattern is one of the most important reversal Price Action signals.
You can set Minimum Percent of Wick (or Tail) Length over full bar length (Recommended: 60%, 70%, 75%).
Alerts can be turned on and off: Popup Email Push Notification S

GBP Portfolio EA is a Fully Automated Trading System that works on any session and trade only one pair (GBPUSD) Оnly 10 Copies available at $87! Next Price --> $199 The EA Does NOT use Grid or Martingale . Default Settings for GBPUSD H1 Only The EA has 56 Strategies with different parameters. It will automatically enter trades, take profit and stop loss using reverse signal modes. If a trade is in profit it will trail it until a reverse signal is detected. The EA works on GBPUSD on H1

This is a derivative of John Carter's "TTM Squeeze" volatility indicator, as discussed in his book "Mastering the Trade" (chapter 11).
Black crosses on the midline show that the market just entered a squeeze ( Bollinger Bands are with in Keltner Channel). This signifies low volatility , market preparing itself for an explosive move (up or down). Gray crosses signify "Squeeze release".
Mr.Carter suggests waiting till the first gray after a black cross, and taking a position in

Dieses DYJ-Signal ist ein vollständiges Handelssystem, das auf ATR-Spezifikationen basiert. Diese Indikatoren zeichnen den aktuellen Status jedes Krafttrends in jedem Zeitrahmen und in jedem analysierten Währungspaar auf. Durch die Auswertung dieser Daten erstellt das DYJ-Energiesignal eine Liste von Trendintensität und Eingangssignalen. Wenn eines der beiden Paare genau übereinstimmt, wird eine entsprechende Warnung angezeigt. Zu den Listendaten gehören Symbol, M5 MN1, BuTypeContent, SellPerce

Identify Engulfing candle pattern with Arrows & Alert ( built-in RSI filter). This indicator helps you to identify Engulfing candle pattern or Outside bar (OB) on the chart with arrows, along with an alert when a new Engulfing candle appears. Engulfing candle pattern is one of the most important reversal Price Action signals. You can choose between standard Engulfing (Engulfing based on candle body) or non standard Engulfing (Engulfing based on candle high - low )
Alerts can be turned on
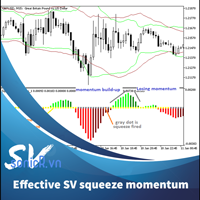
Introduced by “John Carter”, the squeeze indicator for MT5 represents a volatility-based tool. Regardless, we can also consider the squeeze indicator as a momentum indicator, as many traders use it to identify the direction and strength of price moves. In fact, this squeeze indicator shows when a financial instrument is willing to change from a trending market to another that trades in a considerably tight range, and vice versa. Moreover, it indicates promising entries as well as exit points For

The RSI2.0 indicator uses normalized price data and signal processing steps to get a normal distributed oscillator with no skew (mean is zero). Therefore, it can give much better reads than the traditional RSI. Areas/Levels of reversal: Overbought or oversold levels from traditional RSI have no statistical significance, therefore the standard deviation bands are implemented here, which can be used in similar way as possible reversal points. Divergence: As the indicator is nearly normal dist

Es ist eine sichere automatisierte Markthandelssoftware. Die Architektur ist zu einem vollautomatischen autonomen Expertenroboter fähig selbstständig den Markt analysieren und Handelsentscheidungen treffen Effizient. Es ist ein fortschrittliches und professionelles Handelssystem. Anforderungen Unterstützte Währungspaare: CADJPY,GBPCHF,AUDJPY,USDCHF,EURCAD,EURNZD,NZDJPY; Bestes Paar CAD/JPY; Zeitrahmen: H1; Der EA reagiert möglicherweise nicht auf Spread und Slippage. Ich rate Ihnen, einen guten

The Accumulation / Distribution is an indicator which was essentially designed to measure underlying supply and demand. It accomplishes this by trying to determine whether traders are actually accumulating (buying) or distributing (selling). This indicator should be more accurate than other default MT5 AD indicator for measuring buy/sell pressure by volume, identifying trend change through divergence and calculating Accumulation/Distribution (A/D) level. Application: - Buy/sell pressure: above

Panel for send/modify orders/positions by handle moved levels for take profit, stop loss, open price and expire at with lot calculations in several modes. Settings: Risk management Lot calculation mode: default: Free margin, Modes: Fixed, Free margin, Equity, Balance Minimal lot size - default: 0.01 Maximal lot size - default: 0.1 Fixed lot - default: 0.01 Percents - default: 5 Trade when have free margin (0 - disabled) - default: 30 Levels Style - default: Dash Width - default: 1 Panel Positio

The B.O.S.S. Bot stands for Break Of Structure Sniper and this time with PATTERNS! This is a break of structure EA that will open trades based on BOS VIA PATTERNS. This EA has been designed to be the ULTIMATE BOS EA! The ea has many setting options giving the ability to meet needs of scalpers, day traders, and swing traders! No risky martingale strategy no grid style trading! This is based on a BOS strategy VIA PATTERNS!
MAKE SURE TO JOIN OUR DISCORD SERVER FOR FULL TRAININGS AND SET FILES. D

Lets dabble a bit into Elliot Waves.
This is a simple indicator which tries to identify Wave 1 and 2 of Elliot Impulese Wave and then projects for Wave 3.
Ratios are taken from below link: https://elliottwave-forecast.com/elliott-wave-theory/ - Section 3.1 Impulse
Wave 2 is 50%, 61.8%, 76.4%, or 85.4% of wave 1 - used for identifying the pattern. Wave 3 is 161.8%, 200%, 261.8%, or 323.6% of wave 1-2 - used for setting the targets
Important input parameters
MaximumNumBars : To calc

The CashFlow EA arbeitet nach dem Prinzipe der Breakout-Strategie.
Einführungspreis 99 USD , zukünftiger Preis 149 USD.
Beschreibung: Über Stop Orders werden die Ausbrüche von Hochs und Tiefs, getradet Durch den einstellbaren Trailing Stop, werden Gewinne so hoch wie möglich und die Verluste so gering wie nötig, mitgenommen.
Es wird dringend Empfohlen mit einem Broker zu handeln, der einen niedrigen Spread und Provision anbietet.
Bitte gehe verantwortungsbewusst mit deinem Handelskapit

Торговля парами включает в себя поиск активов с высокой степенью корреляции. Цены на эти активы имеют тенденцию двигаться вместе. Когда цены отклоняются друг от друга; например, один падает, а другой нет; это создает потенциальную сделку возврата к среднему. Это также иногда называют статистическим арбитражем . Минимальное количество настроек. 1. Выбор пар 2. % Профита 3. Усреднение отклонения цены

This indicator labels swing highs and swing lows as well as the candle pattern that occurred at that precise point. The indicator can detect the following 6 candle patterns: hammer , inverse hammer , bullish engulfing , hanging man , shooting star and bearish engulfing .
The notations HH, HL, LH, and LL you can see on the labels are defined as follows:
HH : Higher high
HL : Higher low
LH : Lower high
LL : Lower low
Setting
Length: Sensitivity of the swing high/low de
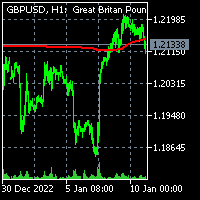
To get access to MT4 version please click here . - This is the exact conversion from TradingView: "Trend Regularity Adaptive Moving Average","TRAMA" By " LuxAlgo ". - This is a light-load processing and non-repaint indicator. - Buffer is available for the main line on chart. - You can message in private chat for further changes you need. Thanks for downloading

Forex Fighter ist ein fortschrittliches Mehrwährungssystem, das mit folgenden Symbolen handelt: EURJPY, GBPCHF, EURGBP, USDCAD, AUDNZD, USDJPY und AUDCAD. Die Strategie basiert auf eingebauten Indikatoren, die ich selbst entwickelt habe. Forex Fighter folgt einzigartigen Mustern, die sich wiederholen, aber sehr oft ist das menschliche Gehirn nicht in der Lage, sie zu erfassen. Der Entscheidungsträger sind hier zwei neuronale Netze, die sich einigen müssen, ob ein bestimmter Trade platziert wird

Moving Level , Special indicator for hunting trends and scalping! programmed to use it in any temporality, It has the trend volume strategy by marking an arrow if it is long or short accompanied by the colors blue yellow and red when it marks the yellow line with the arrow pointing up and is accompanied by blue lines, it is an uptrend When it marks the down arrow with the yellow line and is accompanied by red lines, it is a downtrend. It is used in the synthetic index markets in all pairs, It is
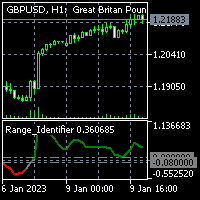
To get access to MT4 version please click here . - This is the exact conversion from TradingView: "Range Identifier" By "Mango2Juice". - All twelve averaging options are available: EMA, DEMA, TEMA, WMA, VWMA, SMA, SMMA, RMA, HMA, LSMA, Kijun, McGinley - This is a light-load processing and non-repaint indicator. - Buffer is available for the main line on chart and not for thresholds. - You can message in private chat for further changes you need.
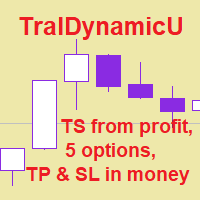
The utility for managing open positions can work with stops (take profit and stop loss) in money, percentages or points. The built-in trailing stop starts working from profit, the size of which can be set in currency or as a percentage. Trailing stop can work in three modes and for five instruments. With the help of the built-in trading simulator, you can check how the utility works in the strategy tester. Benefits setting stop loss and take profit in the deposit currency, as a percentage of the

Sniper rank, It has a gang programmed to hunt down perfect tickets. It has two lines that are used to hunt perfect pivots when the sails of the band come out, They work for all pairs of synthetic indices, perfect for volatility and jumps It also serves for marking forex, it operates in all pairs It is used for scalping and higher temporalities! Perfect Profit!!!!

An Ultimate Tool for quick and efficient market analysis. Unique combination of solid indicators defining market direction for trend tracking and filtration designed for you to stay on the right side of the market.
Market Rider Oscillators gives you access to one of the most used from professional trades indicators on worldwide, which were not build in for MT4 and MT5 terminals . These are unique non-repainting oscillators designed to be used on all time frames for all instruments class

An Ultimate Tool for quick and efficient market analysis. Unique combination of solid indicators defining market direction for trend tracking and filtration designed for you to stay on the right side of the market.
Market Rider Tools gives you access to one of the most used from professional trades indicators on worldwide, which were not build in for MT4 and MT5 terminals . These are unique non-repainting indicators designed to be used on all time frames for all instruments classes: Fo

Critical Trading, Currency Strength This indicator allows for viewing true value changes in the 8 major currencies, this ability has many applications for simple and advanced forex trading. No need to switch to inaccurate 3rd party applications or websites. Trend catching: No need to watch 28 charts, pair up the strongest and weakest performing pairs. Optimize entries: Show the currencies of your current chart and enter on reliable pullbacks for further confluence on your trades. Currency perfo
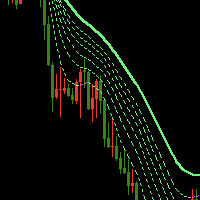
The Waterfall Trend Indicator MT5 uses line regression algorithm, using "Waterfall" in its name is in that it like waterfall when there is a strong down market trend. The indicator draws seven lines, one of which is sold line, others are dash line, the sold line is more stable. Indicator introduction The indicator can effectively filter price noise since it is calculated with line regression. It can be used to analyze market trend and design new expert that is based on trend. When the trend lin

The problem with trading candlestick patterns becomes obvious, after some experience in live markets. Hypothetical branching of candlestick patterns, are not necessary for successful trading. As a Price action trader, my principle is to keep things simple and consistent. My focus is on buying and selling pressure, which is visible in market structure. Trade Management and discipline are my secondary core elements. This indicator detect 4 Simple but Effective Price action Patterns! Yellow = Insi

The EA MuliIndy Swing Trade uses a swing trade system + martingale system + neural network system + indicator strategy (AWESOME OSCILLATOR (AO),STD,ATR) working together to find the best profit and low drawdown for trading. using historical data statistics probability. Let's give the weight of each indicator, which gives good results when the graph fluctuates up and down. without looking at trends alone For EURUSD M15 best default setting EA, it can be used Optimization Backtest to trade other

The EA Trend Pivot Point uses pivot values to choose a buy or sell trade and uses two indicators, STD and ATR, to measure market volatility and choose if market volatility is high not to trade. If the market volatility is less, then trading is allowed. Use pivot point calculations alone for probabilistic weighting of 10 AI pivot values. Based on a 20 year retrospective data backtest Resulting in the weight of this pivot value, for default it is for trading EURUSD Timeframe M15 which user can fin

The EA MultiIndy Hybrid Trend used to a trading system that combines 11 indicators 1. BOLLINGER BAND 2.RSI 3.MA 4.AO 5.MACD 6.CCI 7.MOMENTUM 8.FRACTAL 9.PARABOLIC SAR 10.STD 11.ATR and then AI to find the probability of each indicator as its weight value. Common use of martingale Then backtest twenty years to become this automated trading system. EA can send alerts through the program line, can adjust the risk. or turn off the martingale according to user requirements or can trade any currency

The EA AI Trend Price Action uses a trading strategy of Price Action and AI combined with Martingale The results of the backtest data 2003-2023. Using 100% reliable tick data, choose safe trades with very low risk even with martingale. But limiting the risk, not too high which can be set by the user himself as well. Requirements Supported currency pairs: EURUSD Timeframe: M30 The minimum deposit is $200 for a 1:400 leverage

Swing Trade MA is auto trading Use a system of MA Fast crossover with MA Slow and in the AI(neural network) to measure the probability weights of 10 MA lines and using the Martingale system. Backtest tick data 100 % from 2003-2023 by default setting trading EURUSD Timeframe M15. Requirements Supported currency pairs: EURUSD Timeframe: M15 The minimum deposit is $5 00 for a 1:400 leverage EXPERT DESCRIPTION Variable Description Stop Loss Stop Lost Take Profit Take Profi

Stochastic Strategy Revealer This EA uses Stochastic Oscillator to generate strategies for almost all markets and trade them using this EA. How will this EA help you? We all know trading is hard, and creating a strategy is even harder, so this EA will let us sit back and let the strategies reveal themselves to us and select the ones we like. this ea was made to get rid of wondering and headaches and you will only search for good markets. Positions Sizing This EA uses the basic position sizing m
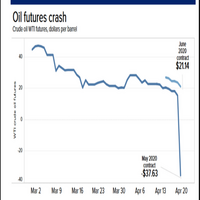
EA VOR TESTEN UND VERWENDEN OPTIMIEREN.
Rohöl-Futures wurden mit realen Futures-Marktdaten in einem einstündigen Zeitrahmen von Januar 2022 bis Dezember 2022 erstellt. Testen Sie diese Daten für Backtests und Analysen. Optimieren Sie bei Bedarf.
Handeln Sie auf dem realen Terminmarkt oder testen Sie beim Handel mit Ölderivaten die Parameter, um zu sehen, wie sie zu den Daten und dem von Ihnen verwendeten Broker passen. Futures sind zentral gespeicherte Daten und alle Daten sind für alle gle

The Trend Snatcher is a multi-timeframe indicator that detects swings on the price market chart. Important levels, such as Supply and Demand levels, Trendline touches, reversal patterns, and others, can also be added as confluence when making trading decisions.
The indicator employs two lines that aim for the highest selling and lowest buying levels. When the two lines cross, a signal is generated.
All trading instruments are compatible, including currency pairs, synthetic indices, metals
The utility for managing open positions can work with stops (take profit and stop loss) in money, percentages or points. The built-in trailing stop starts working from profit, the size of which can be set in currency or as a percentage. With the help of the built-in trading simulator, you can check how the utility works in the strategy tester. Benefits setting stop loss and take profit in the deposit currency, as a percentage of the account balance or by points; adding stop loss and take profit

Sniper2 , It has points of lines, with colors that are showing you an entrance, that work as support and resistance! green dotted lines green shows entry for sale, the red dotted lines show a buy entry, pay attention to the supports that work as a break to catch long candles in a longer period of time. works for forex all pairs works for synthetic indices all pairs ! indicator on sale!
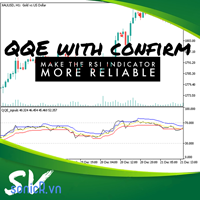
New QQE with confirm The relative strength index (RSI) is a technical indicator of momentum that measures the speed and change of price on a scale of 0 to 100, typically over the past 14 periods. Cause RSI measures the speed and change of price, trader normally use this indicator in two way: + Buy when oversold, sell when overbougth. + buy or sell when identifying divergence from rsi with price. In two way, it wrong when rsi in overbouth (for example) for long time or divergence. Even price ju

Multipound Scalper MT5 is a multicurrency Expert Advisor that works with a customizable trading time filter, Moving Averages and Bollinger Bands Indicators to determine the market entry and exit points. ONLY 7 out of 10 copies left going at 62$ . NEXT PRICE : 98$ . SETUP The following is an overview of the settings used in this Expert Advisor: EA Comment = Comment of the order placed by the EA (Multipound Scalper). Fixed Lot size = 0.1 Use Risk = true (true means risk % will be used and false m
Was ist Double Top and Bottom?
Doppelte Top- und Bottom-Muster sind Diagrammmuster, die auftreten, wenn sich die zugrunde liegende Anlage in einem ähnlichen Muster wie der Buchstabe „W“ (Double Bottom) oder „M“ (Double Top) bewegt. Die Double-Top-and-Bottom-Analyse wird in der technischen Analyse verwendet, um Bewegungen in einem Wertpapier oder einer anderen Investition zu erklären, und kann als Teil einer Handelsstrategie verwendet werden, um wiederkehrende Muster auszunutzen.
Sie können
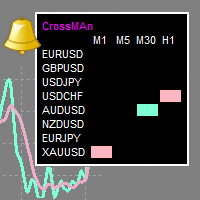
"CrossMAn" is a table indicator that gives signals about the intersection of two moving averages, on selected instruments and time periods.
The intersection of moving averages is one of the most popular signals on the stock exchange.
The signal is displayed as colored rectangles in the table. Thus, you can assess at a glance which tool should be paid attention to.
(Crossman does not add moving averages to the chart.)
The indicator table can be dragged with the mouse.
The size of the table

The diamond top and bottom are reversal patterns. It represents a rally to a new high with a drop to a support level followed by a rally to make a new high and a quick decline, breaking the support level to make a higher low. The bounce from the higher low is then followed by a rally, but making a lower high instead. Once this behavior is identified, prices then break the trend line connecting the first and second lows and start to decline further. You can find MT4 version hier
Indicator show

Dieser Z-Score Indikator zeigt den korrekten Z-Score eines Assets, da es die normierten (normal-verteilten) Preisdaten benutzt. Das ist der einzige Weg den Z-Score richtig zu berechnen. Der Z-Score darf nur basierend auf normal-verteilten Daten berechnet werden, deshalb wird für die Berechnung die normierten Returns benutzt, als normalverteilt angenommen werden. Die Berechnung des Z-Scores basierend nur auf dem Preis selbst ist nicht zulässig, da der Preis einer eher log-normal Verteilung folgt.
Trend Following Strategy Generator The following Expert Advisor helps to generate robust trend-following strategies using price action and a few parameters. the story behind the expert Advisor is to unfold market behavior for an instrument and choose how we can trade it best. After finding your favorite strategy you can save the parameters and start trading the strategy in no time. There is no limit to how many strategies you can generate. How will this EA help you? We all know trading is hard,

"Recovery Drawdown" is an Expert Advisor (EA) specifically designed to address and overcome the challenge of drawdown in trading accounts. Drawdown occurs when an account experiences a series of consecutive losses, resulting in a significant decrease in available balance. This EA follows a cyclical strategy composed of several key steps. The first step is to close winning trades. This approach is implemented to secure the profits obtained up to that point and prevent them from turning into loss
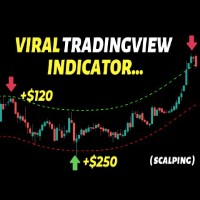
This indicator builds upon the previously posted Nadaraya-Watson Estimator. Here we have created an envelope indicator based on kernel smoothing with integrated alerts from crosses between the price and envelope extremities. Unlike the Nadaraya-Watson Estimator, this indicator follows a contrarian methodology. Settings
Window Size: Determines the number of recent price observations to be used to fit the Nadaraya-Watson Estimator.
Bandwidth: Controls the degree of smoothness of the envelop

Build your own model to predict averages of turning points of the Triple Moving Average Oscillator. It is simple. Rate me with stars. Just load the indicator Triple Moving Average Oscillator in you platform and choose the period. Scroll through to observe the averages of the highs and lows over a period of time. Add the levels for a buy and a sell on the Triple Machine and this will show the average of highs and lows to look for buys and sell. You can load multiple copies with multiple levels.
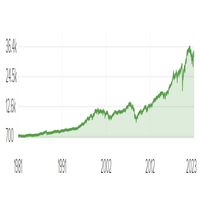
Der EA ist optimierbar und wird ab Januar 2022 optimiert.
Dow Jones Lot Trader wurde mit maschinellem Lernen erstellt und handelt die Futures Dow Jones auf 1-Stunden-Charts mit festen Lots. Der EA wurde auf Basis echter Futures-Daten des Mikro-Dow Jones erstellt.
Möglicherweise müssen Sie einen Backtest durchführen, wenn Sie mit Derivaten des Dow Jones handeln, um zu sehen, ob sie mit den realen Futures-Daten übereinstimmen. sl und tp basieren auf der durchschnittlichen wahren Reichweite.

Fibonacci retracement levels—stemming from the Fibonacci sequence—are horizontal lines that indicate where support and resistance are likely to occur. Each level is associated with a percentage. The percentage is how much of a prior move the price has retraced. The Fibonacci retracement levels are 23.6%, 38.2%, 61.8%, and 78.6%. While not officially a Fibonacci ratio, 50% is also used. The indicator is useful because it can be drawn between any two significant price points, such as

“Percentile of Historical Volatility” und “Correlation Coefficient” zeigt an, ob der Kurs zur Zeit billig oder teuer bzgl. ihrer normalen Volatilität ist. Benutzt wird der Indikator, um einen guten Einstieg zu finden. “Percentile of Historical Volatility” ordnet die Historische Volatilität prozentual. Der zweite Indikator korreliert den nicht direktionalen PHV mit dem Anlagenkurs, um eine Indikation über die Richtung der bevorstehenden Bewegung zu bekommen. Historische Volatilität (historical

DIESER EA HAT OPTIMIERBARE EINGÄNGE.
Nice Little Bot handelt GBP/USD auf 1-Stunden-Charts. Es handelt mit Keltner-Kanälen, Bollinger-Bändern und LWMA für Logik. Es wurde mit maschinellem Lernen erstellt und ist ein netter kleiner Roboter.
Es gibt Eingaben, die optimiert oder geändert werden könnten, wenn Sie sie finden. Die Geldverwaltung verwendet skalierte % des Guthabens. Es gibt % des Guthabens und maximale Lots. Probieren Sie den Backtest aus
ab 2013.

Dieser Indikator zeigt OutsideBars (OB) und InsideBars(IB) im Chart in Kerzenform. Die Farben der Kerzen können individuell eingestellt werden. Auch unterschiedliche Farben für bärische und bullische IBs oder OBs sind möglich.
Zusätzlich ist auch die Farbe der Dochte bzw. Umrandung einstellbar. OutsideBars und InsideBars zeigen oft gute Zonen für Unterstützung oder Widerstand.

Das Binary Trade Panel ist ein sehr nützliches Tool für den Handel mit binären Optionen auf der MT4/MT5-Plattform. Es ist nicht mehr erforderlich, Plugins außerhalb von MT4/MT5 einzurichten. Dies ist ein einfaches und praktisches Panel direkt im MT4/MT5-Chart. Das Binary Trade Panel ist ein nützliches Tool für Händler, die die MT4/MT5-Plattform zum Handel mit binären Optionen nutzen. Es handelt sich um ein einfaches und praktisches Panel, das es Händlern ermöglicht, Binäroptionsgeschäfte direkt
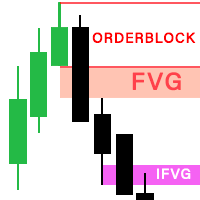
The latest version 2.0 of the FVG Indicator is fully integrated into an all-in-one package, including: Fair Value Gaps (FVG). See more => How to trade with FVG Implied Fair Value Gap (IFVG). See more => How to trade with IFVG OrderBlock (OB). See more => How to trade with OrderBlock The options in the settings section are relatively easy to navigate, and you can even use them right away upon activation without encountering difficulties when using the default configuration. The indicator utilize

Der Indikator „Probability Range Bands“ zeigt eine Vorhersage, um wieviel sich ein Kurs bzgl. seines bisherigen Wertes bewegen wird. Die Bänder grenzen einen Bereich mit einer bestimmten Wahrscheinlichkeit ein, dass die aktuelle Kerze nicht über/unter dem bestimmten Preislevel schließt. Dieser Indikator basiert auf statistischen Methoden, Wahrscheinlichkeiten und Volatilität. Der Anlagenkurs wird als log-normal-verteilt angenommen. Deshalb werden zur Berechnung der Bereichsbänder die „log retu
Pack Dragon , Indicator 3/1, Dragon signal It has the strategy of an oscillator programmed to grab supports and resistances to take advantage of every candle in the market, and it gives you to take your time and a simple analysis it is simple where you mark the green dots at the bottom gives you input for long And when it does not mark anything, it is giving you a short warning! works for all seasons for forex markets and synthetic indices !
Der MetaTrader Market ist die beste Plattform für den Verkauf von Handelsroboter und technischen Indikatoren.
Sie brauchen nur ein gefragtes Programm für die MetaTrader Plattform schreiben und schön gestalten sowie eine Beschreibung hinzufügen. Wir helfen Ihnen, das Produkt im Market Service zu veröffentlichen, wo Millionen von MetaTrader Benutzern es kaufen können. Konzentrieren Sie sich auf dem Wesentlichen - schreiben Sie Programme für Autotrading.
Sie verpassen Handelsmöglichkeiten:
- Freie Handelsapplikationen
- Über 8.000 Signale zum Kopieren
- Wirtschaftsnachrichten für die Lage an den Finanzmärkte
Registrierung
Einloggen
Wenn Sie kein Benutzerkonto haben, registrieren Sie sich
Erlauben Sie die Verwendung von Cookies, um sich auf der Website MQL5.com anzumelden.
Bitte aktivieren Sie die notwendige Einstellung in Ihrem Browser, da Sie sich sonst nicht einloggen können.