YouTubeにあるマーケットチュートリアルビデオをご覧ください
ロボットや指標を購入する
仮想ホスティングで
EAを実行
EAを実行
ロボットや指標を購入前にテストする
マーケットで収入を得る
販売のためにプロダクトをプレゼンテーションする方法
MetaTrader 5のためのエキスパートアドバイザーとインディケータ - 94

Ichimoku Trend Finder is a multi symbol multi timeframe trend dashboard that helps traders to monitor and identify potential market trends from one chart. This panel scans the Ichimoku Kinko Hyo indicator in 28 configurable instruments and 9 timeframes for classic Ichimoku trend signals with a deep scan feature to scan all market watch symbols (up to 1000 instruments!).
Download Demo here (Scans only M1 and M6) Settings description here MT4 version here
After the purchase, don't fo
このトレーディングエキスパートの主な目的は、トレーリングストップの機能を実行することです。ポジションをオープンまたはクローズするのではなく、セットとムーブだけが利益を取り、損失レベルを停止します。テイクプロフィットとストップロスを計算するために、価格変動の統計とD.ベルヌーイの道徳的期待が使用されます。このため、専門家によって設定された新しいレベルは、リスク/報酬の比率に関して(可能な限り)最良のオプションを提供します。トレーディングロボットのパラメータを見てみましょう。
Tracked Symbols -EAによって追跡される通貨ペア。興味のある文字をすべてコンマで区切って入力してください。例:EURUSD、GBPUSD、USDCHF。このフィールドを空のままにすると、アドバイザーはそれがインストールされているシンボルに対してのみ機能します。起動すると、ロボットは監視対象のシンボルを端末の[エキスパート]タブに表示します。 Estimated Timeframe -EAが価格変動統計を収集する時間枠を設定します。利益の少ない多数のエントリを使用する取引戦略(スキャルピングなど)

The idea behind this indicator is very simple , First it contains 2 mechanisms to place your trades:
1- Enter the Pips you want to duplicate to price levels. 2- Automatically let the indicator specify the largest Buy / Sell Volume Candle and place duplicated levels based on the candle itself.
How it works: 1- Enter the Pips you want to duplicate to price levels: 1- once the indicator is loaded you will need first to Specify the number of pips in the indicator Configuration window ,you can

“Practically everyone can forgive us for honesty: and, say, an insufficiently professional game, and even insufficiently professional poetry. There are many examples of this. But when honesty disappears, nothing is forgiven.”
Golden Rings - Forex financial robot offers options for finding profitable trades even in unstable markets when the current trend direction is unclear. It will follow the best trend to maximize profits and reduce the chances of possible losses.
To work in MetaTrader 4
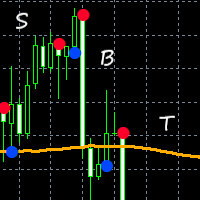
This indicator combines input from two trend filters and the ADX. You can change the trend line on chart to your preference. Great for scalping and channels. Features alert function and parameter TrendLinePeriod.
How to use: Simply attach to any chart. Sell on red bullets, with trend line above price. Enter on bullets closest to this line. Buy on blue bullets, with trend line below price. Enter on bullets closest to this line. Best results when checking the higher time frames before entering t

ユーティリティは、マウスホイールをスクロールすることによって、任意のイ インジケーターを購入またはレンタルした場合は、このユーティリティを使用してインターフェイスを変更できます。 少なくとも一つの整数パラメータを持つ任意の指標がこれに適しています。
あなたが最初にそれがどのように動作するかを試してみたい場合は、標準的な端末配信からインジケータを制御するために無料の Standart スクローラーインジ
操作の原則 ユーティリティは、マウスホイールをスクロールして変更することにより、選択したパラメータのいずれかを制御します。 スクロールモードの有効化は、ボタンの上にカーソルを置くか、ボタンをクリックすることで有効になります。 ボタンは自動的にチャート上に設定されます。 長いローディングの表示器のために、ボタンを押してスクロールモードを使用して下さい。 このモードでは、インジケータは、ボタンがオフになった後にのみロードされます。
インストール チャート上にインジケーターをロードし、制御するパラメータの値を覚えておいてください。 整数である必要があります。 ユニバーサルスク

This EA combines signals from Keltner's channels and other indicators, executes buy and sell against the trend of the selected time frame, great assertiveness with selection of specific parameters for each asset. Ideally, you should test the parameters in the backtest to validate the strategy. Enjoy the best that technology has to offer you. If you are interested in my individual presets please contact us here in the chat or send an email, vendas.mercadocapital@gmail.com.

Hello traders. The Ultimate Machine is a versatile robot, primarily designed to trade the XAUUSD symbol on the H1 time frame using default settings. However, if you wish to trade on a different currency pair, such as EURUSD, you'll need to undergo the optimization and testing process. Therefore, I recommend testing the robot extensively on a DEMO account before proceeding further. If you're exclusively using this robot, there's no need for additional adjustments. However, if you're simultaneousl

The TickCounter indicator counts up and down ticks on each new bar.
The calculation starts from the moment the indicator is placed on the chart.
Histogram bars represent: Yellow bars - total number of ticks; Blue bars - ticks UP; Red bars - ticks DOWN. If the blue bar is not visible, then there are more down ticks and the red bar is displayed on top of the blue one (the red layer is above the blue one). MT4 version: https://www.mql5.com/en/market/product/82548
Each reinitialization of th

MACD strategies EA is a EA that can support multiple MACD strategies. Purchasing this EA can save you the time taken to automate your existing MACD strategy through coding a custom EA and it also helps you discover profitable MACD strategies as its fully compatible with the strategy tester and all settings are editable. The EA supports both scalping, short term and long term strategies. The various supported settings are explained below: NOTE: The default settings in the EA are s

This EA was developed for the Brazilian market in win active in all series of the year. A method of confluence of several indicators of moving averages, IFR and ATR is used. It uses the medium price technique to recover losses in a situation of reversal of movement, and can be enabled and parameterized. The goal is to gain 50 points at each entry, with only 1 contract the risk is minimized and the profit is gradual. Recognizes and avoids input at lateralization levels. It recognizes and advance

ROC価格ヒストグラムアラートは、現在の価格と特定の期間前の価格との間の価格の変化率を測定する、勢いに基づく技術指標です。 ROCはゼロに対するヒストグラムでプロットされ、価格の変化が上向きの場合はインジケーターが正の領域に上向きに移動し、価格の変化が下向きの場合は負の領域に移動します。
ROC期間を計算する際の主なステップは、「計算された期間」の入力設定です。短期のトレーダーは、9や12などの小さな値を選択できます。長期投資家は、200などのより高い値を選択できます。「計算された期間」は、現在の価格が比較されている期間の数です。値が小さいほど、ROCは価格の変化により迅速に反応しますが、それはまた、より多くの誤ったシグナルを意味する可能性があります。値が大きいほど、ROCの反応が遅くなりますが、信号が発生したときの方が意味があります。
このタイプの技術指標には、プラス面とマイナス面の両方があります
ポジティブ ROC価格オシレーターは、ゼロレベルの中点に対して設定されたテクニカル分析で使用される無制限のモメンタムインジケーターです。 ゼロを超えるROCの上昇は通常、上昇

Market Conditions indicators can provide support to the trader so that he can identify market trends over a given period. The purpose of this model is to allow traders to have a global vision on the exchange markets. And the formula that we develop allow to scan the major currencies in the exchange market. The model uses a purely statistical formula which is based on the historical data of the major currencies "eur, usd, gbp, jpy, aud, nzd, cad, chd". Of which 28 currency pairs are traded. It

SLTPSetter - StopLoss Take Profit Setter HOW DOES IT WORK? Risk and account management is a very critical aspect of trading. Before entering a position, you must be fully aware how much you will be willing to loss both in percentage and value. This is where SLTPSetter gets you covered.
All you need to do is attach the indicator on the chart and PRESS BUY OR SELL automatically, all parameters needed for placing the trades will be provided at the top left corner of the screen. Feel free to adjus

At first, I got my teeth into Phoenix Ultra Expert Advisor.
This Expert Advisor will support automatic close order if the direction is correct and perform recovery if the direction is wrong. If you enter an order: 1. The price goes in the right direction and hits the Min Profit Point , trailing stop 20% of the current profit. 2. The price goes in the opposite direction, the Expert Advisor will place the order with the volume is Recovery Volume Percent at the input, the distance t

The Market Entropy indicator was created to measure the order of price changes over time. consists of two lines and a histogram where the lines are responsible for measuring the price movement and the histogram measures the strength of the analyzed movement. It can be used to find a trend (Image 2) or price reversal (Image 3).
Blue Line: Buy Entropy Red Line: Sell Entropy Historgram: Market Entropy
Interpretation: Buy Line above the Sell Line indicates that in the analyzed period buyers wer

Informações Importantes sobre o ArrowHacker (Não repinta! Não gera sinais atrasados!)
Se você está procurando um indicador que cumpre aquilo que promete, você acabou de encontrar! O ArrowHacker irá superar todas as suas expectativas com certeza! E o melhor de tudo, é só colocar na sua conta, ligar e já começar a lucrar!
O ArrowHacker é um sistema profissional de trade criado para as plataformas MT4 & MT5 e otimizado para trabalhar com qualquer ativo na plataforma MetaTrader 5, sejam moeda

Remove comments from MQL5 and MQL4 code with a few mouse clicks using this utility. The utility processes all files in the root directory and in all folders of your project at once. Use the "Remove Comments" to protect your source code before compilation, when you publish the next version of your product in the MQL Market, or when you give an executable file to your customer. You can work with the actual source code of your project in the \MQL5\EXPERTS\ or \MQL5\INDICATORS folders. At th

HiLo B3 Trader é o robô de negociação automatizada para a bolsa brasileira B3, para ativos miniíndice WIN, minidólar WDO e também ativos como milho (CCM). O robô opera calculando o indicador HiLo e emitindo ordens de acordo com a tendência. Além da configuração do período do HiLo, pode-se configurar filtros de tendência, bem como ajustar o takeprofit e stoploss para fixos ou dinâmicos com o indicador ATR. Ativos recomendados: WIN, WDO, CCM. Timeframes: M10. Atenção: alterar o parâmetro BR1 para

Всем привет. Представляю Вашему вниманию Индикатор TRUE ATR. Так же есть данный индикатор для mt4 https://www.mql5.com/ru/market/product/82414 Данный индикатор работает на всех рынках. TRUE ATR высчитывает среднестатистическое движение инструмента за 1 день и показывает сколько в инструменте осталось энергии внутри дня. В отличие от классического индикатора АТР которые без разбора учитывает все бары(свечи), TRUE ATR при расчете среднестатистического движения инструмента использует ближайших 5

WolfeWaveBuilder インジケーターで取引に参加しましょう! これは、最も成功した収益性の高い投資決定を得るために特別に作成された独自のツールです。 ライブ口座に最適で、徹底的にテストされ、事実上保証された取引戦略から利益を得られます。 チャンスをお見逃しなく! WolfeWaveBuilder インジケーターでお金の取引を始めましょう!
MT5 バージョン https://www.mql5.com/ru/market/product/8920
インジケーターの機能
Wolfe Waves 戦略の合図を出します。 トレンドを表示します。 1980 年から使用されている実績のある効果的な戦略です。 シンプルなエントリーシグナル。 再描画せず、遅れません。 音、メール、電話でのお知らせがあります。
命令
矢印が表示されるか、端末にメッセージが表示されるか、メール、電話に通知されるまで待ちます。 あなたは取引を開きます。 価格がライン 1 ~ 4 を超えたときに終了することをお勧めします。 戦略

Informações Importantes sobre o CryptoHacker (Não repinta! Não gera sinais atrasados!)
Se você está procurando um indicador que cumpre aquilo que promete, você acabou de encontrar! O CryptoHacker irá superar todas as suas expectativas com certeza! E o melhor de tudo, é só colocar na sua conta, ligar e já começar a lucrar!
O CryptoHacker é um sistema profissional de trade criado para as plataformas MT4 & MT5 e otimizado para trabalhar com CryptoMoedas.
Nosso sistema utiliza uma poderosa
The Forex grid trading strategy is a technique that seeks to make a profit on the natural movement of the market. The robot is designed to trade on GBPUSD, but can also trade on other pairs. EA has the advantage of simplicity and a unique position enhancer. What is important. Positions are opened at the close of the candle.
Input parameters: Start Trend in pips. Comment; Max Spread (Digits 5) Slippage Magic Number Stop Loss Take Profit (first position) Average Take Profit PipsStep for gr

PULLBACK HUNTER What is every trader's cherished dream? To see without delay the places where the reversal will happen. This, of course, is from the category of magic, though... nothing is impossible. But for now I've prepared for you an indicator that marks in real time the end of corrections to the current movement or in short - catches pullbacks.What is the main point? Many people practice rebounds when the price moves in the direction of the open position. And they do them on the formation o

Before installing the HeatMap indicator make sure you are using a broker that gives you access to the Depth of market (DOM) !!
This indicator creates a heatmap on your chart allowing you to see the buy or sell limit orders easily and in real time. You have the possibility to change the setting and the colors of the HeatMap in order to adapt to all markets and all charts. Here is an example of a setting you can use with the NASDAQ100 on the AMPGlobal broker : https://www.youtube.com/watch?v=x0

Taking into account the difference in trading sessions, the indicator shows the trend direction and the resistance level. All events are marked on the chart and alerts are sent. Using SessionAlert, you can trade calmly, steadily. You just need to specify the start and end time of the sessions. The indicator displays the resistance level, the arrow indicates the trend change event and additionally marks the price touching the resistance level. The principle of operation of the indicator is very s

Camaleão Bands B3 Trader é o robô de negociação automatizado para a bolsa Brasileira B3, tanto para trade em miniínidice WIN, quanto para trade em minidólar WDO. O robô usa as Bandas de Bollinger para análise de ordens de entradas, permitindo trades a favor ou contra a tendência, dependendo da volatilidade das bandas, afinal, quando as bandas estão estreitas, é mais provável que o mercado fique lateral, realizando mais trades contra a tendência. Porém, quando o mercado explode, as bandas se alar

Second To NoneFX Spike Catcher EA V1.1 Use This spike Catcher everyday or let it run on VPS, make profit and withdraw everyday. Very Cheap and accurate Spike Catcher... AFFORDABLE!!!
2nd To NoneFX Spike Catcher EA V1.1 -----> NEW FEATURE Multiply on loss to cover previous loss. This Robot is Also Developed To milk the BOOM and CRASH indices . It works On all Boom and Crash pairs (boom 300, 500, 1000 & Crash 300, 500, 1000) I would Highly recommend that you use this Robot to Catch spikes
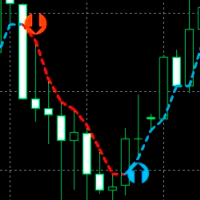
すべての時間枠とすべての通貨ペアの価格反転ポイントを正確に決定するための指標。市場の技術分析と数学的診断モデルの助けを借りて、この指標は価格の逆転点と現在の傾向の方向を非常に効率的に決定します。インジケーターは、この情報を矢印と線の形でチャートに表示します。矢印はトレンド反転ポイントを示し、線は現在のトレンド方向を示します。
この指標は、既存の取引戦略に統合することができ、スキャルピングまたは長期投資のための新しい取引戦略を構築するためにも使用できます。このインジケーターで頭皮を剥ぎ、日中に注文を開始する場合は、M5-M15の時間枠を使用し、インジケーターがチャートに矢印を描くときに取引を開始することをお勧めします。長期投資の場合は、H1、H4、D1の時間枠で取引することをお勧めします。この場合、インジケーターが引く線の方向にトレードする方が良いです。
インジケーターの利点: 値を再描画しません。 すべての時間枠で取引されます。 すべての通貨ペアで取引されます。 スキャルピングまたは長期取引に使用できます。 セットアップはとても簡単です。 インジケーター設定: Indicat

British stuff The Expert Advisor tool has been developed for GBPJPY 1H based on SMA 200 and pending orders. It has been backtested on more than 18-year long tick data with 99% quality of modeling. The enclosed screenshots demonstrate the complexity. A broker with a small spread and slippage is recommended for better performance. There is no need to set up any parameters, except Magic number and Friday exit time, lot size . All other settings are already optimized and fine-tuned. Strategy worki

GBP Scalper 03 is a simple EA that can work automatically to carry out trading activities. Like the previous version (GBP Scalper 01 & GBP Scalper 02 (MT4 platform)), this EA is kept simple and only requires Lot, TP, and SL settings to use.
And because of the absence of the Buy_only and Sell_only options on the MT5 platform, an option is added to manage the activation of Buy Trade or Sell Trade
As the name implies, this EA is only suitable for trading with the GBPUSD pair, and is desi
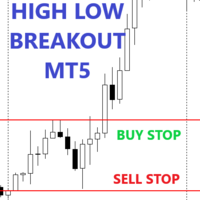
This expert advisor will make a pending order at a certain time, pending orders are made in the form of buying at the highest price and selling at the lowest price (in a predetermined time frame) you can make a pending order breakout at the highest and lowest prices according to your wishes, thus it can be used for the following strategies: - Asian Session BreakOut - European Session BreakOut - US Session Breakout - News Trading - Etc.
Main parameter description Notes : order type 4 is not par

Supimpa B3 Trader é o robô de negociação automatizada para a bolsa brasileira B3, para os ativos miniíndice WIN e minidólar WDO. A estratégia de negociação é baseada na média VWAP - Volume Weighted Average Price - que utiliza uma média ponderada dos preços em relação ao volume de negociação em cada vela. O robô é de configuração simples, com entrada do valor do período da média de análise e do takeprofit e stoploss fixos. Além disso, pode-se configurar também o número de contratos, configuração

VWAP Volume And Price is the indicator for Volume Weighted Average Price, designed according to regular calculation. The average price is calculated using typical price - (high + low + close) / 3 - and weighted by volume for each candle. So, the indicator can be used to trend trades, balanced with volume. Try other products and expert advisors too. Any doubt, PM.
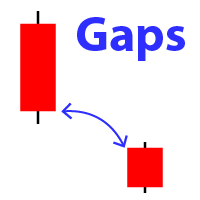
Displays the appearance of a gap on the chart (when the closing price of the previous bar differs from the opening price of the new bar). My #1 Utility: includes 65+ functions | Contact me if you have any questions In the initial settings you can configure: The gap size : gap that exceed this value will be displayed. Size type: pips / poitns / %; Arrow color : separate for up and down gaps. Terminal / Email / Push notifications When you hover the mouse over the gap arrows on the char

Informações Importantes sobre o Bra50 Index Bot (BACKTEST VISUAL desativado para proteger parte da Estratégia.)
Se você está procurando um robô que cumpre aquilo que promete, você acabou de encontrar! O Brazil Index Bot irá superar todas as suas expectativas com certeza! E o melhor de tudo, é só colocar na sua conta, ligar e já começar a lucrar! Deseja conhecer mais sobre o Bra50 Index Bot e seus resultados? Baixe agora os relatórios detalhados em: https://bit.ly/INFOSBRAZILINDEXBOT (Utilize e

Informações Importantes sobre o Brazil Index Bot (BACKTEST VISUAL desativado para proteger parte da Estratégia.)
Se você está procurando um robô que cumpre aquilo que promete, você acabou de encontrar! O Brazil Index Bot irá superar todas as suas expectativas com certeza! E o melhor de tudo, é só colocar na sua conta, ligar e já começar a lucrar! Deseja conhecer mais sobre o Brazil Index Bot e seus resultados? Baixe agora os relatórios detalhados em: https://bit.ly/INFOSBRAZILINDEXBOT (Utilize

Investopedia FIVEEAはこの記事に基づいています:
https://www.investopedia.com/articles/forex/08/five-minute-momo.asp
取引条件
-X期間のEMAとMACDの下で取引されている通貨ペアがマイナスの領域にあることを確認します。 -価格がX期間のEMAを超えるのを待ってから、MACDがネガティブからポジティブにクロスする過程にあるか、5バー以内でポジティブな領域にクロスしたことを確認します。 -X期間EMAの上に長いXピップを移動します。 -エントリー時のポジションのXとリスク額を売ります。後半のストップを損益分岐点に移動します。 -トレーリングストップを使用
-リスク警告 -ADX PROを購入する前に、関連するリスクに注意してください。 -過去のパフォーマンスは将来の収益性を保証するものではありません(EAも損失を出す可能性があります)。 -示されているバックテスト(スクリーンショットなど)は、最適なパラメーターを見つけるために高度に最適化されていますが、結果をライブ取
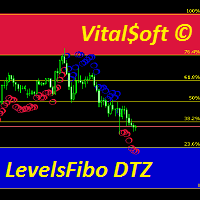
The combined Levels Ib DTZ indicator helps to determine the trend direction when trading. Displaying signals on the chart about a possible upcoming trend change. The indicator is a combination of Fibonacci levels with overbought and oversold zones and a trend indicator based on ZigZag and ATR indicators. The Levels Ib DTZ indicator helps traders predict future price movements and adjust their strategy accordingly. It works on all timeframes.

This Expert Advisor works on the signals of the Parabolic indicator, while analyzing the readings of other indicators, especially Stochastic. Sets pending orders, as a rule, they are triggered when a local trend reversal occurs. If the trading conditions become unsuitable, it can delete pending orders. It has many settings, the stop loss can also move along the parabolic with other parameters.
Recommended timeframes: M5, M15, M30, H1. Before trading, optimize the EA parameters for your accoun
ハイパージオメトリックシリーズは、このフィルターの重み係数を計算するために使用されます。このアプローチにより、時系列のかなり興味深い平滑化を得ることができます。 超幾何フィルターの重みは、指数関数的および線形加重移動平均ほど速く減衰しませんが、平滑化された移動平均よりも速く減衰します。このため、このフィルターの動作は、移動平均の動作と多くの点で似ています。ただし、いくつかの利点があります。その遅れは移動平均のそれよりはるかに小さいです。しかし同時に、指数移動平均よりもはるかに多くの情報を保持します。このため、超幾何フィルターは、財務時系列の傾向と周期的コンポーネントをより適切に強調できます。したがって、この指標は、さまざまなタイプの移動平均を使用する取引戦略で使用できます。 インジケーターの動作は、単一のパラメーターに依存します。 iPeriod -このパラメータの有効な値は2-149です。 このパラメーターの値が小さいほど、インジケーターは最新の価格変動に強く反応します。このパラメータの値を大きくすると、長期的な傾向を強調することができます。さまざまなiPeriod値を使用したイン

Basato sull'indicatore RSI aiuta a capire quando il trend sta cambiando in base ai periodi impostati. E' possibile impostare intervalli di tempo personalizzati e colori delle frecce. Segui l'andamento e valuta anche in base alla volatilità dell'asset. Funziona con ogni coppia di valuta ed è da considerare come un'aiuto ad una valutazione. Puoi associarlo con altri indicatori.

価格観察への常識的なアプローチ 価格が上昇しているときに購入し、価格が低下しているときに販売する 価格が上昇しているときに購入する、または価格が下がっているときに販売するという上記のステートメントは広すぎる可能性があるため、いくつかのガイドラインとルールが必要になる場合があります。ここで3ダックが役立ちます。
価格平均Mt5インジケーターは、最後の上昇トレンドの方向での購入機会と最後の下降トレンドの方向での販売機会を識別するのに役立ちます。タイトルの「アヒル」は、「すべてのアヒルを並べる」という表現から来ており、すべてを正しい順序で並べることを意味します。アヒルは3つあり、最初のアヒルは最後の上昇トレンドまたは下降トレンドを識別するのに役立ち、2番目のアヒルはトレンドの方向を確認するのに役立ち、3番目のアヒルはトレンドの方向での売買の機会を識別するのに役立ちます。この指標には、4時間チャート(最初のアヒル)、1時間チャート(2番目のアヒル)、5分チャート(3番目のアヒル)の3つの異なる時間枠を使用することが含まれます。
最初に行う必要があるのは、最大の時間枠(4時間の最初のア

Donchian Channel DC is the indicator of Donchian Channels, that plots maximum and minimum values of a specific period, besides mean value line. It´s possible to configure simple period for analysis and the indicator will plot all three values. You can trade with this indicator as trend or reversal, according to each strategy. Do not let to test others indicators as soon as others expert advisors.

Plot History Mt5は、エキスパートアドバイザーが実行する取引端末とアカウントの取引履歴を分析するトレーダーにとって不可欠なスクリプトです。分析方法は、スクリプトが実行されるシンボル図と魔法の番号、1人または複数の専門家が使用するすべての魔法の特定または完全な分析に基づいています。スクリプトは取引データを分析し、これらをチャートにプロットし、エキスパートログに詳細な取引情報を印刷し、分析されたデータをcsvにエクスポートできます。 スクリプトの利点 アカウントで使用されている1つまたはすべての魔法を分析する機能 すべての取引データをcsvファイルにエクスポートします すべての取引、エントリー、エグジットをチャートにプロットします。これは、プロットするかどうかのように設定できます。 エキスパートログに詳細な取引情報を印刷する アカウント取引分析を実行する方法 分析するシンボルを選択することから始め、次に、分析を特定の魔法の番号付けで実行するか、アカウントで使用されるすべての魔法の完全な分析で実行するかを選択します。ノート;これはスクリプトであり、専門家のアドバイザーではあり

The " Stochastic Advanced " indicator displays the signals of the 'Stochastic" indicator directly on the chart without the presence of the indicator itself at the bottom of the screen. The indicator signals can be displayed not only on the current timeframe, but also on a timeframe one level higher. In addition, we have implemented a filter system based on the Moving Average indicator.
Manual (Be sure to read before purchasing) | Version for MT4 Advantages
1. Displaying the signals of the "Sto
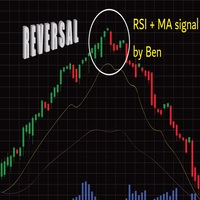
Important : have a good money management with this tpe of EA (little lot size....and avoid margin call)
The EA takes a trade when 2 conditions are met: The achievement of an RSI level, and the break of a moving average of your choice.
When the trade is initiated: the SL is positioned (in pips) the TP1 can be: the kijun, or another moving average, you can configure a value approaching the TP1 (which avoids the price shift of brokers) the partial close is done the SL after TP1 can be configur
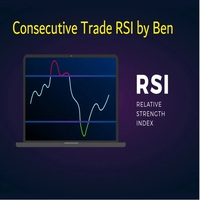
This EA takes trades based on a configured RSI level. At each candle close, it will resume a position if the one closes above the previous one.... The SL and TP are positioned and it is the sum of all the trades initiated that will close the positions: Either in % of capital, or in pips. IMPORTANT :
it is the magic number that allows the EA to properly close positions. so be sure to put different magic numbers on each graph. Important : have a good money management with this type of EA (lit
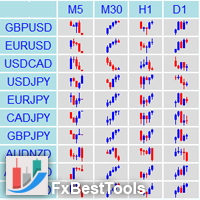
Definition : Market View is a dashboard (scanner) to view price graphs of all symbols and all timeframes at a glance. The utility is designed user friendly and added a wide range of customization options.
Main features of Market View : Visual settings window on the chart Customizable list of symbols and timeframes Different shapes : Real Candles, Schematic Candles, Arrows Customizable number of candles Changeable size of dashboard (scanner)
Highlight timeframes with gaps on candles Open appr
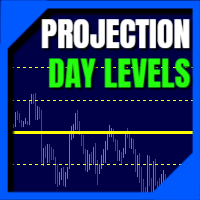
Daily Projection Levels , as the name implies, is an indicator that project the price changes in percentage above and below the opening of the day (or closing of the previous day.
These are "psychological" support and resistance areas where price tries to retrace or break out.
With this you have a powerful tool to predict what these zones will be! You can define which projection levels you want (up to 5 above and below), in addition to have alert messages and visual customization. If you want
Expert Advisor Stop and Reverse Cut Switch Hedge based on Parabolic SAR indicator. There are two setting in EA: 1. Cut Switch 2. Hedging
Recommended settings: TimeFrame = H4 Risk = 0.1 Minimum Balance = 1.000 MaxToBep = 4
Main Parameter Description: - Hedging Mode False = Cut Switch True = Hedging - Max Martingale Level = Lot / Volume will reset after "n" Losses - Risk = Based % of Balance -MaxOP to BEP = Target BEP will be active if there is a certain number op open position - Percent BEP
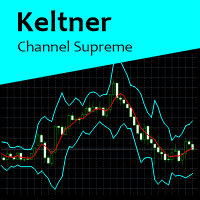
Keltner Channel Supreme is a indicator based on Keltner Channels, with some configuration besides period and Keltner multiplier factor. In this indicator, it is possible to change to an exponential moving average and if prices will be calculated according to close price or typical price. This indicator works on all graphics. If you have some doubt, please PM.

Robo =Crisis= is a completely new unique approach to trading in the "swamp" of trading. Trading in automatic and semi-automatic mode. The robot works according to the current market situation, no stories, redraws, grids and other things. One of the main advantages of the robot is the love of strong volatility. He's not afraid of the news. Absolutely any volatility in the market is our friend. Features of trading: - The adviser includes ( Robo =Crisis= and the Flat indicator, which will be added

Only gold and bitcoin can be profitable. Trade time is 30 minutes and trend time is 1 hour.
You should check the efficiency of this robot at the end of three months.
Strong trends make very good profits.
There are many inputs for your personalization, but the best settings are defined by default.
This indicator will have many updates and special settings will be added to it.
You can contact us via Instagram, Telegram, WhatsApp, email or here. We are ready to answer you.

TIO Trend - Трендовый советник, работающий на индикаторе iMACD ( с авторской доработкой ) , по сигналу от четырех таймфреймов . Тренды случаются не часто, поэтому на каждой паре будет не много сделок. Но корзиной пар можно вполне не плохо торговать. Советник не использует Сетку и Мартингейл. Есть выбор времени торговли и ограничение в какую сторону торговать. Можно торговать с ТП и СЛ, или с трейлингом, или отключить любой, для этого выбранный параметр установите в '0.0'. Советник не наст

In this indicator, Heiken Ashi candles are calculated with the most optimal method. You can also customize the results by adjusting the amount of period and method input. But the most important advantage of this indicator is the adjustment of the time frame value. You can use this to calculate the Heiken Ashi chandels to See in time frames with lottery in the lower time chart. In this case, you get the best signal to buy or sell using two or more Heiken Ashi indicators with different timeframes

CHART OBJECTS: Blue box : Bullish Order Blocks (OB) Red box : Bearish OB Orange box : Mitigated OB. Price bounce from this area the made a new high/low Light gray box : Price bounced from this area but did not made a new high/low Dark gray box : Broken OB. Filled boxes : TimeFrame 1 Order Blocks
Unfilled boxes : TimeFrame 2 Order Blocks
INDICATOR SETTINGS: Order Block Required Length: Required number of subsequent candles in the same direction to identify Order Block. Default value: 5 Im

/// XShea ///
レベルクロスオーバーに適用されるインジケーター(MFI)のロジックに基づきます。 スキャルピングのみ
実際のアカウントでの数か月のテストとアプリケーションの後、私は利用可能にすることにしました
対応するルールが守られている場合に使用するこの貴重なツール
あなたはあなたの外国為替口座で非常に良い利益を得ることができるでしょう。
このインジケーターは、サウンドアラートとプッシュ通知を送信するようにプログラムされています。
アプリケーションモード:
M5より長い期間でのみ機能します ストップロス(SL)レベルについては、最後の以前のサポートまたはレジスタンスを参照してください Take Profit(TP)レベルの場合このアプリケーションモードの2番目のポイントを基準にして1/4を設定します
詳細についてはお問い合わせください:
WhatsApp:+5930962863284

EAが短期間で数百から数百万に変わることはありません。これは嘘です。 ゴールドは言うまでもなく、EAのトレード1分チャートは多くありません。 このEAはユニークで、ローソク足と商品チャネルインデックスを使用して1分の時間枠でXAU/USDを取引します。 それに応じて入力を調整し、最適化します。 VPSを使用して取引するか、デイトレードの目的で使用します。 デイトレードに推奨されますが、そうすることを選択した場合は、異なる設定と時間枠を試してください。
使用が必要な場合は最適化してください。 EAは最良の結果を得るために継続的に最適化する必要があります
テスト用のコメントにセットファイルがあります。
EAが短期間で数百から数百万に変わることはありません。これは嘘です。 ゴールドは言うまでもなく、EAのトレード1分チャートは多くありません。 このEAはユニークで、ローソク足と商品チャネルインデックスを使用して1分の時間枠でXAU/USDを取引します。 それに応じて入力を調整し、最適化します。 VPSを使用して取引するか、デイトレードの目的で使用します。 デイトレードに

New Trend Alerts finds new trends at the changing bar very quickly. If the trend has enough power and a quality up/down angle, then the indicator sends multiple alarms to alert you: via email, mobile notification, alert window and alert sound. All of these different alarms are optional, and you can choose which ones you would like to use. The indicator calculates the derivative of the price chart to reveal the slope of price curve and its sign changes. Red bars indicate a positive sign or uptre

Multiple Timeframe Trend Alert
I. Overview
Real-time analysis of trends on nine time frames (M1, M5, M15, M30, H1, H4, D1, W1, MN1) based on the calculation of highs and lows using swing highs and lows and Dow Theory. Indicator sends notifications (alerts) when the trends of the specified time frames match.
II. Advantage
Since this indicator notifies you when a trend coincides, you can seize trading opportunities without having to stay on the charts.
In addition, by introducing this i

OPTIMIZE BEFORE BACKTEST AND USE Trade crude oil with this EA. No EA turns hundreds into millions in a year or 2, This is a lie if presented this way. Black Gold trades Brent Crude on 1 min charts. It uses RSI, moving averages and directional indicators. Try it out, load it onto the tester if you have the history and ability to trade Brent crude.
Adjust and optimize to get the most out of the expert advisor

The most sensitive indicator you've ever seen! And now with Alerts
POscillator Alert is a sensitive indicator that finds each trend direction change in every timeframe and then notifies you with the necessary alarms. It's a new version of the POscillator Indicator, with the addition of its alarm sending capability. The Indicator can send multiple alerts: email, mobile phone notification, alert window and alert sound. All of these different alarms are optional and you can choose the ones you

Every indicator has its advantages and disadvantages. Trending ones show good signals during a trend, but lag during a flat. Flat ones thrive in the flat, but die off as soon as a trend comes. All this would not be a problem, if it was easy to predict when a flat changes to a trend and when a trend changes to a flat, but in practice it is an extremely serious task. What if you develop such an algorithm, which could eliminate an indicator's flaws and enhance its strengths? What if such an algorit
Average Daily Range with factor target and more functions (ADR)
Hello traders,
The upgraded ADR dashboard now is also for MT5 much more better and more convenient for day trader, try it to experience the good things!
How to use Average Daily Range (ADR) Indicator?
ADR is just a simple indicator tool to help trader identify the daily average range of an instrument. So for example we have the pairs EURUSD and that pairs usually makes a peak and bottom during the trading day an
MT4 Version A versatile tool
You do not need any other tools with this tool.
You can enable or disable all indicators.
Their values are adjustable.
In the first line you will see a summary of your account status.
p: The amount of your profit or loss
BP: The amount of your daily profit based on the balance
EP: Equity daily earnings
WP: Your weekly profit
MP: Your monthly profit
The next line shows each of the time frames you selected.
Chikou: The Chikou process
KT: The trend of t

Matrix is the foundation of complex trading algorithms as it helps you perform complex calculations effortlessly and without the need for too much computation power, It's no doubt that matrix has made possible many of the calculations in modern computers as we all know that bits of information are stored in array forms in our computer memory RAM, Using some of the functions in this library I was able to create machine learning robots that could take on a large number of inputs To use this libra

Apenas Fecha Posições Exceução de fechamento de posições de modo rápido, para todos os ciclos de mercado Necessita do Indicador ( https://www.mql5.com/pt/market/product/79691 ) Para mais detalhes de configurações e input de variáveis entre em nossa comunidade no guilded ( https://www.guilded.gg/i/E9m8bYLE ) Inclui Rompimentos, Canais Estreitos, Canais Amplos e Lateralidades, ou seja para todos os ciclos
FREE
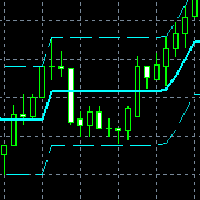
It is a new indicator that frames the price movement and tracks it. It consists of oscillation channel and its center line CL . For its calculation it is only necessary to introduce the amplitude of the channel. Because of this, it is a non-lagging indicator as it is not calculated based on a number of previous candlesticks. It removes any level of noise , showing the underlying price movement cleanly via the center line . It allows you to easily identify the beginnings a
In previous products, we have published an indicator of this strategy, but now we offer you an Expert Advisor to make it easier for traders The procedure is whenever two Moving Average indicators cross each other (their settings are accessible in the "Inputs" section), the EA will open a position buy/sell automatically based on the direction of crossing, and by the volume, SL and TP that you specify in the "Inputs" section. You also can define the direction of the positions, Buy, Sell, or Both.
MetaTraderマーケットが取引戦略とテクニカル指標を販売するための最適な場所である理由をご存じですか?宣伝もソフトウェア保護も必要なく、支払いのトラブルもないことです。これらはすべて、MetaTraderマーケットで提供されます。
取引の機会を逃しています。
- 無料取引アプリ
- 8千を超えるシグナルをコピー
- 金融ニュースで金融マーケットを探索
新規登録
ログイン