Kostenpflichtige technische Indikatoren für den MetaTrader 5 - 5

The market price usually falls between the borders of the channel .
If the price is out of range , it is a trading signal or trading opportunity .
Basically , Fit Channel can be used to help determine overbought and oversold conditions in the market. When the market price is close to the upper limit, the market is considered overbought (sell zone). Conversely, when the market price is close to the bottom range, the market is considered oversold (buy zone).
However, the research can
King Binary Profit System
1 minute candle
3-4 minute expire
Alright. This indicator works on MT5 and is very easy to use. When you receive a signal from it, you wait for that candle with the signal to close and you enter your trade at the beginning of the next new candle. A red arrow means sell and a green arrow means buy. All arrows comes with a long dotted like for easy identification of trade signal. Are you okay with that?

The indicator is designed to detect range market or consolidation areas on the chart. It does this by using the market volatility and price momentum. The indicator signals the start and stop of the range with icons on the chart and various type of alerts options provided in the input settings. Usage: The indicator can be used to check the state of the market i.e. trending or ranging to make appropriate decision and use strategies designed for specific market state. Please see the attached video

Buy and sell signals based on the Wave Setup strategy for entering a trade on the pullback after a reversal.
How does the indicator work? The indicator activates the buy and sell signal when their respective conditions are met. For an uptrend, we need a reversal up on the EMA9 followed by prices above the ascending SMA21 making a pullback and a touch on it. For a downtrend, we need a reversal down on the EMA9 followed by prices below the descending SMA21 making a pullback and a touch on it.

KT Stochastic Alerts is a personal implementation of the Stochastic oscillator that provide signals and alerts based on six custom events: Bullish Crossover: When Stochastic main line cross above the signal line. Bearish Crossover: When Stochastic main line cross below the signal line. When Stochastic enter in an overbought zone. When Stochastic exit from an overbought zone. When Stochastic enter in an oversold zone. When Stochastic exit from an oversold zone.
Features
A perfect choice for

This is MT5 version, MT4 on this link: Alert Line Pro MT4 Alert line pro allows to make alert when price cross these objects: Horizontal lines Trendline Price Zone (Rectangle) Alert when close current bar (have new bar) When the price crosses the alert lines, the software will sound an alarm and send a notification to the MetaTrader 5 mobile application. You need to settings your MetaQuotes ID of MT5 apps to MetaTrader5 software to get notification to the mobile phone. Sound files must be pl

This all-in-one indicator displays real-time market structure (internal & swing BOS / CHoCH), order blocks, premium & discount zones, equal highs & lows, and much more...allowing traders to automatically mark up their charts with widely used price action methodologies. Following the release of our Fair Value Gap script, we received numerous requests from our community to release more features in the same category. "Smart Money Concepts" (SMC) is a fairly new yet widely used term amongst price a

For MT4 version please click here . This is the exact conversion from TradingView: "Range Filter 5min" By "guikroth". - This indicator implements Alerts as well as the visualizations. - Input tab allows to choose Heiken Ashi or Normal candles to apply the filter to. It means it is a (2 in 1) indicator. - This indicator lets you read the buffers for all data on the window. For details on buffers please message me. - This is a non-repaint and light processing load indicator. - You can message in p
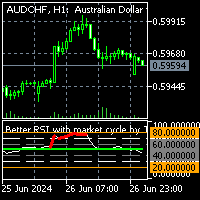
To get access to MT4 version please click here . This is the exact conversion from TradingView: " Better RSI with bullish / bearish market cycle indicator" by TradeCalmly.
This is a light-load processing and non-repaint indicator. All input options are available. Buffers are available for processing in EAs. You can message in private chat for further changes you need.

To get access to MT4 version please click here . This is the exact conversion from TradingView: "ZLSMA - Zero Lag LSMA" by "veryfid". This is a light-load processing indicator. This is a non-repaint indicator. Buffers are available for processing in EAs. All input fields are available. You can message in private chat for further changes you need. Thanks for downloading
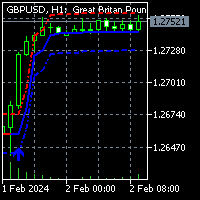
To get access to MT4 version please click here . This is the exact conversion from TradingView: "HalfTrend" by "Everget". This is a light-load processing indicator. This is a non-repaint indicator. Buffers are available for processing in EAs. All input fields are available. You can message in private chat for further changes you need. Thanks for downloading

To get access to MT4 version please click here . This is the exact conversion from TradingView: "SwingArm ATR Trend Indicator" by " vsnfnd ". Also known as : "Blackflag FTS" by "Jose Azcarate" This is a light-load processing and non-repaint indicator. All input options are available except multi time frame. Buffers are available for processing in EAs. Extra option to show buy and sell signal alerts. You can message in private chat for further changes you need.

25% off. Original price: $40 Stochastic Scanner is a multi symbol multi timeframe Stochastic dashboard that monitors the indicator for price entering and exiting overbought and oversold in up to 28 symbols and 9 timeframes.
Download Demo here (Scans only M1, M5 and M10) Settings description here MT4 version here
Stochastic Scanner features: Signals price entering and exiting the overbought and oversold zones. Monitors up to 28 customizable instruments and 9 timeframes at the same time.

The Bheurekso Pattern Indicator for MT5 helps traders automatically identify candlestick pattern that formed on the chart base on some japanese candle pattern and other indicator to improve accurate. This indicator scans all candles, recognizes and then displays any candle patterns formed on the chart. The candle displayed can be Bullish or Bearish Engulfing, Bullish or Bearish Harami, and so on. There are some free version now but almost that is repaint and lack off alert function. With this ve
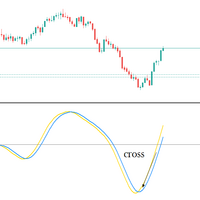
Big promotion on the Robos, Get yours now Robos Indicator The ROBOS indicator is a multi timeframe oscillator that targets the overbought and oversold regions of a price chart, a signal is indicated by the two lines crossing, compatible with all tradable instruments
Latest Release
The latest release is the version 4.0
#What's new in version 4.0 ?
Features
Extreme oversold and overbought levels
ROBOS version 4.0 comes with cool new feature , the ability to target on

MT5 RSI Experiment: This indicator leverages the Relative Strength Index (RSI) and floating levels to pinpoint potential buy and sell signals.
The code uses enums for prices and RSI calculation methods. These enums define indicator parameters.
Input variables include RSI period, price type for RSI calculation, smoothing method, and look-back period with levels for floating levels.
Index buffers store RSI fill, RSI up line, RSI middle line, RSI down line, and trend line data.
For each ba

This pass-band oscillator seeks to pass-band out both high and low frequencies from market data to eliminate wiggles from the resultant signal thus significantly reducing lag. This pass-band indicator achieves this by using 2 differenced EMA's of varying periods. (40 and 60). Trigger points for the pass-band oscillator are added with a RMS cyclic envelope over the Signal line. Output of the pass-band waveform is calculated by summing its square over the last 50 bars and taking the square root of
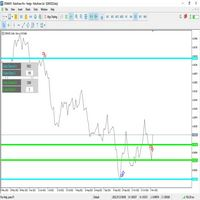
Der Indikator Price Channel besteht aus zwei unabhängigen Preiskanälen und Preiszonenniveaus - (A / B). Der Indikator überwacht ständig das Verhalten und die Bewegung der Preise, sowie den Zusammenbruch des Kanals Ebenen - (A / B), die Neuordnung Ebenen und die Festsetzung neuer Zonen von Extremen und Minima. Für die Analyse der vorherigen und aktuellen Höchst- und Tiefstwerte ist die Anzahl der Balken in jedem Kanal (A / B) nicht entscheidend. Der Indikator zeigt nützliche Informationen für je
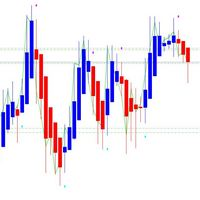
Der Indikator Heiken Ashi Signal ist für das MT5-Handelsterminal konzipiert. Er basiert auf dem Standard Heiken Ashi Indikator, der im Mt5 Terminal verfügbar ist. Der Indikator kann sowohl manuell als auch im Autotrading mit den Expert Advisors des Autors verwendet werden. Um den Heiken Ashi Signal-Indikator in Trading EAs zu verwenden, gibt es Signalpuffer für den Markteintritt und die Eröffnung von Kauf- und Verkaufspositionen. Lesen Sie unten mehr darüber.
Merkmale und Eigenschaften des In

Das Hinzufügen von ATR-Kanälen (Average True Range) zum Force Index wurde von Kerry Lovvorn vorgeschlagen. Durch das Hinzufügen dieser Kanäle wird Force Index zu einem hervorragenden Werkzeug zur Identifizierung von Zwischenhochs und -tiefs. Force Index mit ATR-Kanälen erfasst nicht alle Kurven, aber diejenigen, die er identifiziert, verdienen besondere Aufmerksamkeit.
Hinweis: Das Wort „wahr“ in Average True Range bezieht sich auf den Umgang mit Preisunterschieden. Da es keine Lücken im Forc

King of Dragon-Kanal, King of Dragon-Indikator, King of Dragon-System, King of Dragon MT5, King of Dragon-Klassiker-Indikator, King of Dragon-Wischsystem, König der Drachen in einem
Das Channel-Handelssystem King of Dragon, ein klassisches Channel-Trading-System, wird von vielen Benutzern dringend nach der MT5-Version verlangt. Dieses Programm wurde in mehreren Versionen auf Leistung optimiert und ist bereits ein relativ reibungsloses System. 49$ → 59$ Roter Bereich, langer Trend, nur lang, n

Dies ist ein klarer Indikator für die Beurteilung von Hochs und Tiefs und funktioniert gut für den oszillierenden Markt.
Aktionspreis 49 $ → 59 $
Merkmale gut im Einschätzen von Ober- und Unterteilen Kein Neuzeichnen, kein Driften Schnelle Berechnung, keine Verzögerung Reichhaltiger Erinnerungsmodus Mehrere Parameter und Farben können angepasst werden
Parameter "======== Haupt ========" HighLowPeriod1 = 9 HighLowPeriod2 = 60 HighLowPeriod3 = 34 HighLowEMAPeriod = 4 MASignalPeriode = 5 "==

Dieser Multi-Timeframe- und Multi-Symbol-Indikator scannt nach Pin-Bars, Morgen-/Abendsternen, Engulfings, Tweezers, Three Line Strikes, Inside Bars und Wimpel und Dreiecken. Der Indikator kann auch im Single-Chart-Modus verwendet werden. Bitte lesen Sie mehr über diese Option in den Produktinformationen bloggen . In Kombination mit Ihren eigenen Regeln und Techniken ermöglicht Ihnen dieser Indikator, Ihr eigenes leistungsstarkes System zu erstellen (oder zu verbessern). Merkmale
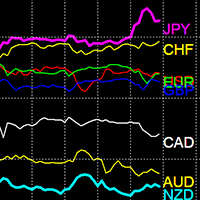
Währungsstärkeindikator
Der Währungsstärkeindikator ist ein leistungsstarkes Tool zur Erkennung von Trends. Er vergleicht die Stärke und Schwäche verschiedener Währungen und erleichtert das Auffinden trendiger Währungspaare.
Verkaufspreis: 49 $
Funktionen
Unterscheidet effektiv zwischen starken und schwachen Währungen Erkennt automatisch trendige Währungen Mehrere Zeitrahmen Lädt 28 Währungspaare Leistungsoptimiert
Indikatorverwendung Starke Währungen: Währungen über 80 gelten als sta

Range Bars for MetaTrader 5 is a unique tool for conducting technical analysis directly on the charts, as the indicator is an overlay on the main chart and range bars are calculated using real tick data. The trader can place and modify orders directly on the range bar chart (even with the use of one-click trading). Apart from range candles, the indicator also includes the most commonly used technical studies which are 3 moving averages (Simple, Exponential, Smooth, Linear-weighted, Volume-weight

Marley-Indikator: Präzises Trading in MT5 Verbessern Sie Ihr Trading mit dem Marley-Indikator, der für außergewöhnliche Signalgenauigkeit in MT4 und MT5 konzipiert wurde. Dieses vielseitige Werkzeug ist für die Krypto- und Forex-Märkte optimiert und bietet Präzision und Flexibilität in Ihrer Handelsstrategie. Nahtlose Integration mit MT4: Für Nutzer der MT4-Plattform ist der Marley-Indikator vollständig kompatibel und hier zugänglich. Für Krypto- und Forex-Märkte optimiert: Krypto-Exzellen

The indicator shows Profit Zones on the chart, displaying the beginning and end of the local trend Profit Zone PRO is perfect for all Meta Trader symbols: currencies, metals, cryptocurrencies, stocks and indices
Advantages of the Profit Zone PRO indicator:
Input signals without redrawing The algorithms of the indicator allow you to find the ideal moments to enter a transaction (purchase or sale of an asset), which increase the success of transactions for 100% of traders. The indicator has t

Our Spike Detector is specifically engineered to cater to the unique needs of traders in the Boom and Crash indices markets. This tool is optimized for M1 (1-minute) and M5 (5-minute) timeframes, ensuring you receive timely and actionable insights.
Key Features:
1. **Non-Repainting**: Our detector guarantees accuracy with non-repainting signals, ensuring your data remains consistent and reliable. 2. **Push Notifications**: Stay updated with real-time push notifications, so you never miss a

MetaCOT 2 is a set of indicators and specialized utilities for the analysis of the U.S. Commodity Futures Trading Commission reports. Thanks to the reports issued by the Commission, it is possible to analyze the size and direction of the positions of the major market participants, which brings the long-term price prediction accuracy to a new higher-quality level, inaccessible to most traders. These indicators, related to the fundamental analysis, can also be used as an effective long-term filter

Dies ist ein linearer Indikator für eine Währungsmacht mit der Fähigkeit, durch Glättungswerte zu filtern. Es zeigt die aktuelle Stärke ausgewählter Währungen (die maximale Anzahl ist 8) sowie historische Werte. Die Berechnung hängt vom ausgewählten Chart-Zeitrahmen ab, in dem der Indikator gestartet wird. Der Indikator zeigt Daten als Linien für alle Währungen oder als Histogramm für das aktuelle Währungspaar an. Der Schnittpunkt der Währungsstärkeindizes für das aktuelle Währungspaar wird zusä

KT Custom High Low shows the most recent highs/lows by fetching the data points from multi-timeframes and then projecting them on a single chart. If two or more highs/lows are found at the same price, they are merged into a single level to declutter the charts.
Features
It is built with a sorting algorithm that declutters the charts by merging the duplicate values into a single value. Get Highs/Lows from multiple timeframes on a single chart without any fuss. Provide alerts when the current

Attention: New update - 4 major practicality improvements!
1) Alarm 2) Midas text value 3) Click panel 4) Can be connected to an EA to operate in semi-automatic mode
Attention - This indicator does not work perfectly in backtest due to MT5 peculiarities (Reading hotkeys or panel clicks) . My suggestion is that you test Automatic Vwap Midas which has automatic operation to analyze the calculation and then buy Start if you think the indicator will match your operating.
This indicator i

Der WAPV ADH Supply and Demand Forex Indicator ist Teil einer Reihe von Indikatoren namens (Wyckoff Academy Wave Market) Der WAPV ADH Forex Supply and Demand Indicator for MT5 soll die Gewinnerseite zwischen Käufern und Verkäufern identifizieren. Seine Lesung ist sehr einfach, wenn die grüne Linie über der roten Linie liegt, herrscht Nachfrage, wenn die rote Linie über der grünen Linie liegt, herrscht Versorgung. Je positiver die grünen und roten Linien, desto höher die Eingangslautstärke, je nä

Super Trend Indicator for MetaTrader 5 - Elevate Your Trading Precision Experience the future of trading with the "Super Trend Indicator" designed for MetaTrader 5. This versatile tool is your key to precise market analysis, providing insights into potential trend directions that enhance your trading decisions. Basic Details : Indicator Type : Super Trend Indicator for MetaTrader 5 Key Metrics : Real-time analysis of market trends using a proprietary algorithm. Customization : Fully customizable

Full implementation of Directional Movement System for trading, originally developed by Welles Wilder, with modifications to improve profitability, to reduce the number of unfavorable signals, and with Stop Loss lines.
No re-paint
Features
Buy/sell signals displayed on the chart Stop levels visually indicated on the chart Profit-taking points presented in the indicator window Exit points for unfavorable positions presented in the indicator window Signal confirmation through high/low swing c

Laguerre SuperTrend Clouds adds an Adaptive Laguerre averaging algorithm and alerts to the widely popular SuperTrend indicator. As the name suggests, Laguerre SuperTrend Clouds (LSC) is a trending indicator which works best in trendy (not choppy) markets. The SuperTrend is an extremely popular indicator for intraday and daily trading, and can be used on any timeframe. Incorporating Laguerre's equation to this can facilitate more robust trend detection and smoother filters. The LSC uses the

If you use the MFI (Money Flow Index) indicator, the waiting time till the next signal can be long enough. Now you can avoid sitting in front of the monitor by using MFI Alerts. This is an addition or a replacement to the standard MFI oscillator . Once there appears an MFI signal on the required level, the indicator will notify you with a sound or push, so you will never miss a signal. This is especially significant if you follow the indicator in different timeframes and currency pairs, which ca

Sweep-Muster Dieses hochmoderne Tool wurde entwickelt, um sowohl rückläufige Trendrotationen als auch bullische Trendrotationen mit beispielloser Genauigkeit zu identifizieren.
So können Sie fundierte Handelsentscheidungen treffen und dem Markt immer einen Schritt voraus sein. MT4-Version: WH Sweep Pattern MT4 Merkmale des Sweep-Musters:
Es erkennt automatisch bärische und zinsbullische Trendrotationen und zeichnet sie auf Ihrem Diagramm auf, wobei verschiedene Farben und Stile verwen

Price DNA ist ein Trendindikator, der auf der Basis von Compound Ratio Weighted Moving Averages arbeitet, um Verzögerungen zu reduzieren und Trends frühzeitig zu erkennen. Der Indikator wird nicht neu gezeichnet und kann auf jedes Finanzinstrument und jeden Zeitrahmen angewendet werden.
Wie funktioniert die Preis-DNA? Der Indikator zeigt mehrere Wellen auf dem Diagramm an, die die Richtung des aktuellen Handels anzeigen. Fünf grüne oder fünf rote Wellen weisen auf einen starken Aufwärts- bzw.

*Non-Repainting Indicator Bruce Webb Explains How To Use Bruce's Price Predictor In Detail And Free Forex Strategy https://youtu.be/hfoB1tZZpTo Bruce's Price Predictor is an indicator that shows precise price reversals. A great arsenal to add to any chart. Bruce's Price Predictor points price reversals with high degree of accuracy and it is great for scalping on the 1min time frame, Or swing trading on the 1hr time frame. Buy and sell arrows are shown on the chart as for entry signals. They do
Möchten Sie auf dem Forex-Markt erfolgreich sein? Unser innovativer AI Swing Trading -Indikator ist Ihr geheimer Schlüssel für erfolgreichen und profitablen Handel. Wir präsentieren Ihnen dieses einzigartige Tool:
Unser Indikator ist mit einem integrierten neuronalen Netzwerk ausgestattet, mit dem Sie riesige Datenmengen analysieren, Änderungen erkennen und Preisbewegungen vorhersagen können. Diese Technologie ermöglicht es Ihnen, fundierte Handelsentscheidungen auf der Grundlage einer eingeh

Ein sehr einfacher, aber effektiver Indikator.
Es basiert auf der KijunSen-Linie des Ichimoku-Indikators, auf der der gleitende Durchschnitt MA aufgebaut ist. Wenn sich diese beiden Linien kreuzen, treten Kauf- oder Verkaufssignale auf. Ich verwende für meinen Handel häufig die KijunSen-Indikatorlinie: Wenn der Preis OBERHALB dieser Linie liegt, konzentriere ich mich ausschließlich auf den KAUF, während er sich UNTERHALB auf den VERKAUF konzentriert.
Darüber hinaus werden nach der Mittelu

***** This is an indicator for MT5 providing accurate arrow signals without repainting. ***** Trade With Sam Simple Strategy Guide : https://www.mql5.com/en/blogs/post/740855
MT4 version of the indicator
Try Out and see the Difference
The Sam's Trend Blaster indicator tracks the market trend with an unmatched reliability, by ignoring sudden fluctuations and market noise. It has been designed to trend-trade intraday charts and small timeframes. Its winning ratio is around 85%. This is a

For any trader, the result of market analysis is the correct determination of entry and exit points from the market. The ClearArrows indicator does not display any unnecessary information that may distract or mislead the trader, but only the most important thing. The indicator is very easy to use, when a down arrow appears, you need to open a SELL deal, when an up arrow appears you need to open a BUY deal.
The ClearArrows indicator, despite its outward simplicity, has a large analytical algor

ICT Kill zone and Macros Indicator mark and display the following zone times on the chart: Kill zones Kill zone Forex Asian
London Open New York Open London Close Central Bank Dealing range
Kill zone Indices Asian London Open New York AM New York Lunch New York PM Power Hour
Macros London 1 London 2 New York Am 1 New York AM 2 New York Lunch New York PM 1 New York PM 2
Silver bullet London Open New York AM New York PM
Sessions Asian London New York
Chart The display of Kill zone ,

Der Hauptzweck des Indikators besteht darin, die Zeitpunkte von Ein- und Ausstiegen aus Transaktionen zu bestimmen. Daher zeichnet ExactArrow nichts anderes als Pfeile, die die Orte für den Ein- und Ausstieg in den Markt anzeigen.
Trotz der scheinbaren Einfachheit des Indikators verfügt er in seinem Inneren über komplexe Analysealgorithmen, mit deren Hilfe das System die Zeitpunkte der Ein- und Ausstiege bestimmt.
Der Indikator gibt genaue und zeitnahe Signale zum Ein- und Ausstieg aus eine

Das Impulssystem wurde erstmals im Buch "Come into my Trading Room" beschrieben. Es verwendet die Richtung sowohl des MACD-Histogramms als auch eines exponentiellen gleitenden Durchschnitts (EMA) des Preises, um einen Impuls zu definieren. Die Regel ist, niemals gegen den Impuls zu handeln.
Sein Farbcode gibt Ihnen mehrere Signale: Wenn sowohl der EMA als auch das MACD-Histogramm steigen, färbt das Impulssystem die Balkenfarbe grün (kein Shorten erlaubt). Wenn sowohl der EMA als auch das MACD

Der Trendindikator „ Super Trend Flexible Alert “ hat ein Minimum an Einstellungen. Dieser Indikator ist so konzipiert, dass er so einfach wie möglich zu verwenden ist. Der Indikator zeigt den Trend mit einer farbigen Hauptlinie an („SuperTrend“-Linie, die Sie im Fenster „Datenfenster“ sehen können). Außerdem zeigt der Indikator an Stellen, an denen sich der Trend ändert, farbige Pfeile ( "STBuy"- und " STSell"-Symbole, die Sie im Fenster "Datenfenster" sehen können ). An Orten, an

Der Indikator ermöglicht es Ihnen, die aktuelle Kursrichtung und Marktvolatilität zu bestimmen. Diese Version des Traders Dynamic Index hat das Neuzeichnen der historischen Daten eliminiert, die Berechnungsgeschwindigkeit des Algorithmus optimiert, mehr externe Parameter für eine genauere Anpassung und seine Funktionalitäten erweitert: die Auswahl des anfänglichen Oszillators und die Glättungsmethoden der Durchschnitte hinzugefügt . Parameter: Mode Osc - A uswahl des Schätzoszillators Period Osc
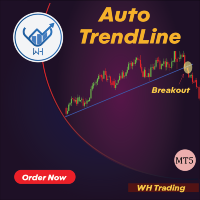
Wir stellen Ihnen Auto Trendline vor, den innovativen MT5-Indikator, der das
Zeichnen von Trendlinien in Ihren Diagrammen automatisiert. Verabschieden Sie sich von der mühsamen und zeitaufwändigen Aufgabe, Trendlinien manuell zu zeichnen,
und lassen Sie Auto Trendline die Arbeit für Sie erledigen!
*Kontaktieren Sie mich nach dem Kauf, um Ihnen Anweisungen und eine Schritt-für-Schritt-Anleitung zu senden. Mit seinem fortschrittlichen Algorithmus erkennt und zeichnet Auto Trendline automa

Einführung in den Indikator Der Indikator basiert auf Formeln für gleitende Durchschnitte, die stabiler sind und weniger Verzögerungen aufweisen als RSI oder CCI. Der Indikator verfügt über drei Indikatorwerte, die Periode des gleitenden Durchschnitts und die Farben der Linie können manuell geändert werden. Was kann Ihnen dieser Indikator bringen? Präzise Einstiegssignale: Der Indikator zeichnet Auf- und Ab-Pfeilsignale. Mehrperioden-Trendanalyse: Wenn Sie diesen Indikator in ein großes Zei

Der Indikator berechnet fraktale Linien, die technisch gesehen psychologische Unterstützungs-/Widerstandslinien sind. Es handelt sich dabei um die Höchst- und Tiefststände des Preises über einen bestimmten Zeitraum. Der Indikator funktioniert auf allen Charts und Zeitrahmen. Einstellungen: Fractal Candels - die Anzahl der Candlesticks, auf deren Basis ein Fraktal gebildet wird. Berechnet das Maximum/Minimum, bei dem der psychologische Preis berechnet werden kann Rigth Candels - die Anzahl der Ke
Nutzen Sie das volle Potenzial Ihres Handelsindikators mit XDashboard MT5, dem ultimativen Dashboard-Indikator für MetaTrader 5. XDashboard MT5 wurde für Händler entwickelt, die Präzision und Effizienz verlangen. Es bietet eine beispiellose Ansicht aller Indikatoren über mehrere Symbole und Zeitrahmen hinweg. alles über eine einzige, anpassbare Schnittstelle. ** Dieser Preis gilt zeitlich begrenzt ** Merkmale: Integration benutzerdefinierter Indikatoren
Umfassende Mehrsymbolüberwachung M

Der Indikator zeichnet automatisch die Fibonacci-Niveaus basierend auf dem ZigZag-Indikator, Handelssitzungen, Fraktalen oder Kerzen (einschließlich nicht standardmäßiger Zeitrahmen: Jahr, 6 Monate, 4 Monate, 3 Monate, 2 Monate) (Auto-Fibo-Retracement). Sie können einen beliebigen höheren Zeitrahmen für die Fibonachi-Berechnung wählen. Die Level werden jedes Mal neu gezeichnet, wenn der aktuelle Balken schließt. Es ist möglich, Warnungen beim Überschreiten der angegebenen Ebenen zu aktivieren.

Multicurrency and multitimeframe modification of the ZigZag indicator. Displays the current direction of the market, the height of the last movement, the number of bars in this movement and the breaking of the previous point of the ZigZag (horizontal line). This is MTF Scanner.
You can specify any desired currencies and timeframes in the parameters. Also, the panel can send notifications when the ZigZag changes direction or when there was a breakthrough of the previous point. By clicking on a

Multicurrency and multi-timeframe indicator Inside Bar (IB). In the parameters, you can specify any desired currencies and timeframes. The panel displays the last found Inside Bar (and Mother Bar) pattern, the current price position and the breakout of the levels of the Mother and Inside Bars. You can set the size and color for bars and text in the cells. The indicator can also send notifications when levels are broken. By clicking on a cell with a period, the specified symbol and period will b

Multicurrency and multitimeframe indicator of the Standard Deviation Channel. Displays the current direction of the market. On the panel, you can see breakouts and touches (by price) of the levels of the linear regression channel. In the parameters, you can specify any desired currencies and timeframes. Also, the indicator can send notifications when levels are touched. By clicking on a cell, this symbol and period will be opened. This is MTF Scanner. The key to hide the dashboard from the char

Der Spread Pulse -Indikator ist ein effektives Tool, das Händlern Informationen über den aktuellen Spread auf dem Chart liefert. Der Spread ist die Differenz zwischen dem Kaufpreis und dem Verkaufspreis eines Instruments.
Der Indikator wird in Form von Text dargestellt, der im Diagramm angezeigt wird. Dadurch kann der Händler den aktuellen Spread leicht verfolgen.
Einer der Hauptvorteile des Spread Pulse-Indikators ist seine Farbvisualisierung. Abhängig von der Spread-Größe ändert sich di

This is Gekko's customizable version of the famous Heiken Ashi indicator. It extends the use of the famous Heiken Ashi and calculates strong entry and exit signals. Inputs Number of Bars to Plot Indicator: number of historical bars to plot the indicator, keep it low for better performance; Produce Arrow Signals: determine if the indicator will plot arrow signal for long/short; Produces Signal Only When a Bar Closes: wait for a bar to close to produce a signal (more accurate, by delayed entry

Boom Scalper Gold It is an indicator, programmed to scalp in a timeframe of 1/5 and 15 Minutes, perfect for hunting spikes and trend sails, where in the parameters of (70) it sends you a sale/sell alert and in the level parameter (8) it sends you a buy signal It is used for indices (BOOM) of synthetic indices (Deriv) It's easy and simple to use, it does all the work by sending you the alerts! the indicator during this period will remain on SALE! Without further ado, enjoy! Good profit. World Inv
Crash Scalper Gold It is an indicator, where it marks points of purchase and points of sale As the name says, it is used to scalp in the pairs of (Crash) 1000/500/300 where it sends you signals of sale/Sell and purchase/Buy at level points (90) he sends you the sell signal, (Spike) at the level point (27) it sends you the buy signal, (Trend Candles) It is very simple and easy to use. to make the best tickets possible! For this period it will remain on sale! Without further ado, enjoy! Good profi
Alright. This indicator works on MT5 and is very easy to use. When you receive a signal from it, you wait for that candle with the signal to close and you enter your trade at the beginning of the next new candle. A red arrow means sell and a green arrow means buy. for easy identification of trade signal. Are you okay with that?
The indicator cost $500. We release new updates of the indicator every month and the updates are for free once you bought the indicator first time. This indicator was

Hello Seasonal Traders! The seasonality trading strategy works because the smart money is doing the same thing every single year more often than not. The month of the year or the day of the week and the time of the day can call the shots in any market. The seasonal cycle is another useful tool in your trading arsenal. I'm not saying to trade solely off of seasonality and forget anything else. I'm only giving you another trading tool that you can incorporate into your own trading strategy to ga

The Session Volume Profile indicator displays the distribution of trade volume across price levels for a specific trading session. It visualizes areas of high and low trading activity, helping traders identify support and resistance zones. The profile's peak, known as the Point of Control (POC), represents the price with the highest traded volume.
The inputs of the indicator:
volumeBars(Row Size) : Determines the number of price bins or rows for the volume profile. A larger number results in

*Non-Repainting Indicator Arrow Indicator with Push Notification based on the Synthethic Savages strategy for synthethic indices on binary broker.
Signals will only fire when the Synthethic Savages Strategy Criteria is met BUT MUST be filtered.
Best Signals on Fresh Alerts after our Savage EMA's Cross. Synthethic Savage Alerts is an indicator that shows entry signals with the trend. A great tool to add to any chart. Best Signals occur on Fresh Alerts after our Savage EMA's Cross + Signal

Introducing the BOOM CRASH MASTER Indicator: Unleash the Power of Precision Trading! Step into the world of unparalleled trading with the BOOM CRASH Master Indicator, exclusively designed for the Boom and Crash indices offered by Deriv broker. This cutting-edge tool is your gateway to mastering the art of spike detection and anti-spike entries, ensuring you stay ahead of the market’s every move. Key Features: Precision Spike Detection: Harness the power of advanced algorithms to catch spikes wi
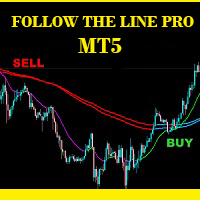
Follow The Line PRO FOLLOW THE LINE (PRO VERSION) This powerful indicator is the full and complete version of my free indicator called "Follow The Line". IT IS BASED ON the popular maxim that: "THE TREND IS YOUR FRIEND" It gives alarms and alerts of all kinds. IT DOES NOT REPAINT and can be used for all currency pairs and timeframes.
AVOID FALSE SIGNALS:
BUY ONLY when price closes above the green line and the green line is above the blue channel.
SELL ONLY when price closes below the pink

this is an indicator to clarify seeing Low and High in the market and is very useful for facilitating those who are studying technical price action
this is a type of indicator that gives color to the candlestick where the indicator is divided into 3 colors red = bearish green = Bullish
Gray = base
this indicator can be used on the forex market or the mt5 binary market. https://t.me/SBA_FOREX_SIGNAL

Description :
VWAP (Volume-Weighted Average Price) is the ratio of the value traded to total volume traded over a particular time horizon. It is a measure of the average price at which pair is traded over the trading horizon. Read More.
All Symbols and All Timeframes are supported.
Indicator Inputs :
VWAP Mode : Mode of VWAP Calculation. Options can be selected : Single,Session,Daily,Weekly,Monthly
Volumes : Real Volumes,Tick Volumes
Price Type : Used price for cal

It predicts the most likely short-term price movement based on advanced mathematical calculations.
Features Estimation of immediate price movement; Calculation of the real market trend; Calculation of the most important support and resistance levels; Algorithms optimized for making complex mathematical calculations with a minimal drain of system resources; Self-adjusting for better performance, so it’s able to work properly at any symbol (no matter how exotic it is) and any timeframe; Compatib
Erfahren Sie, wie man einen Handelsroboter im MetaTrader AppStore, dem Shop für Applikationen für die MetaTrader Handelsplattform, kaufen kann.
Das Zahlungssystem der MQL5.community ermöglicht Zahlungen mit PayPal, Kreditkarten und den gängigen Zahlungssystemen. Wir empfehlen Ihnen eindringlich, Handelsroboter vor dem Kauf zu testen, um eine bessere Vorstellung von dem Produkt zu bekommen.
Sie verpassen Handelsmöglichkeiten:
- Freie Handelsapplikationen
- Über 8.000 Signale zum Kopieren
- Wirtschaftsnachrichten für die Lage an den Finanzmärkte
Registrierung
Einloggen
Wenn Sie kein Benutzerkonto haben, registrieren Sie sich
Erlauben Sie die Verwendung von Cookies, um sich auf der Website MQL5.com anzumelden.
Bitte aktivieren Sie die notwendige Einstellung in Ihrem Browser, da Sie sich sonst nicht einloggen können.