Konstenfreie technische Indikatoren für den MetaTrader 5 - 4

ZigZag Indicator for MT5
The ZigZag Indicator is a valuable tool available in MetaTrader 5, designed to highlight the highs and lows on a price chart. By marking pivotal turning points in price—commonly referred to as Pivot Highs and Lows (HH-HL-LH-LL)—it simplifies the process of identifying price trends. In any price movement, consecutive peaks and troughs are formed. Understanding these patterns correctly is essential for recognizing the direction of the overall market trend or short-term fl
FREE

RSI ABCD-Musterfinder: Technische Strategie 1. Funktionsweise des Indikators Kombiniert den klassischen RSI mit automatischer Erkennung von ABCD-Harmonie-Mustern . Hauptkomponenten Standard-RSI (einstellbare Periode) Hoch- und Tiefpunkte-Markierungen (Pfeile) ABCD-Muster (grüne/rote Linien) Überkauft (70) und Überverkauft (30) Filter 2. MT5-Einstellungen period = 14 ; // RSI-Periode size = 4 ; // Maximale Muster-Größe OverBought = 70 ; // Überkauft-Level OverSold = 30 ; // Überverkauft-Level Fil
FREE

Amiguinho's Bar Counter is a price action indicator to display the bar count (candles) with some interesting options.
About the "Period of analysis" parameter: if the current timeframe is in minutes, then the analysis period will be considered in days; if the current timeframe is in days, then the analysis period will be considered in months; or if the period of analysis will be considered in years.
FREE

Check my version of the moving average convergence divergence (MACD) indicator based on Heikin Ashi calculations. Here you find multi-colored histogram which corresponds to bull (green) / bear(red) trend. Dark and light colors describes weakness/strenght of price trend in time. Also you can switch calculations between normal and Heikin Ashi price type.
Note: Buffers numbers for iCustom: 0-MACD, 2-Signal line
FREE

Boom and crash Gold Miner v2 trend histogram which works in conjunction with the indicator above that has arrows as shown in the video. PLEASE Note: That the top indicator and the bottom indicator are two separate indicators. the top indicator is https://www.mql5.com/en/market/product/98066 the bottom one is free. which is the histogram at the bottom. the trend histogram trading tool that helps to easy detect the trend blue color indicates an uptrend. Orange color is a down trend.
FREE

This is a derivative of John Carter's "TTM Squeeze" volatility indicator, as discussed in his book "Mastering the Trade" (chapter 11).
Gray dot on the midline show that the market just entered a squeeze (Bollinger Bands are with in Keltner Channel). This signifies low volatility, market preparing itself for an explosive move (up or down). Blue dot signify "Squeeze release".
Mr.Carter suggests waiting till the first blue after a gray dot, and taking a position in the direction of the moment
FREE
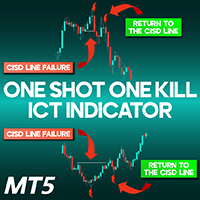
One Shot One Kill Indicator for MetaTrader 5 The One Shot One Kill ICT trading tool is specifically developed for MetaTrader 5 , designed to analyze price movements by assessing the highest and lowest points of previous candles. It identifies liquidity zones while integrating fundamental data, such as CPI and NFP reports , to detect potential reversal areas or confirm ongoing trends. One Shot One Kill Indicator Specifications Category ICT – Smart Money – Liquidity Platform MetaTrader 5 Skill L
FREE
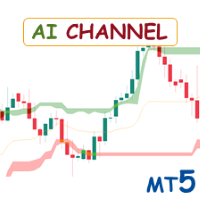
Special offer : ALL TOOLS , just $35 each! New tools will be $30 for the first week or the first 3 purchases ! Trading Tools Channel on MQL5 : Join my MQL5 channel to update the latest news from me Der AI Channels -Indikator nutzt rollende K-means-Klassifizierung —eine leistungsstarke Technik des maschinellen Lernens in der Clusteranalyse—um Echtzeit-Einblicke in die zugrunde liegenden Preistrends zu liefern. Dieser Indikator erstellt adaptive Kanäle basierend auf gruppierten Preis
FREE

Crystal Volume Indicator – Intelligentes Volumen-Analyse-Tool für MT5 Crystal Volume ist ein fortschrittlicher und dennoch benutzerfreundlicher Volumen-Indikator, der Tradern hilft, die verborgene Stärke hinter Preisbewegungen visuell zu interpretieren. Durch die Kombination von Preisaktionen mit Volumendynamik hebt dieses Tool wichtige Volumenereignisse wie Buying Climax , Selling Climax und Schwache Kerzen hervor. Hauptfunktionen: Echte Volumenanalyse – Unterstützt Tick- und Echtzeitvo
FREE
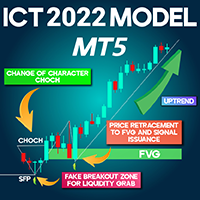
ICT 2022 Model Indicator for MetaTrader 5 The ICT 2022 Indicator is developed based on essential trading principles such as liquidity grabs (Sweep), Change of Character (CHoCH), fake breakouts (SFP), and Fair Value Gaps (FVG) .
By integrating these concepts, the indicator visually represents them on the price chart, making it an invaluable resource for traders and analysts following the ICT trading methodology . «Indicator Installation & User Guide» MT5 Indicator Installation | ICT two thousan
FREE

Trend Line Finder will project forward a support and resistance lines using 2 previous highs for resistance and 2 previous lows for support. It will then signal to the trader by alert making the trader more aware that a possible good move is about to happen. This is not a stand-alone trading system but is very useful in finding key areas of support resistance levels where price will usually either rebound from or breakthrough. Its down to the trader to decide what to do with use of other s
FREE

本指标 基于 Zigzag 基础上... 增加了: 1.增加了箭头指示,使图表更鲜明 2.增加了价格显示,使大家更清楚的看清价格. 3.增加了报警等设置,可以支持邮件发送 原指标特性: 1.基本的波段指标构型. 2.最近的2个ZIGZAG点不具有稳定性,随着行情而改变,(就是网友所说的未来函数) 3.原指标适合分析历史拐点,波段特性,对于价格波动有一定的指导性.
Zigzag的使用方法一 丈量一段行情的起点和终点 (1)用ZigZag标注的折点作为起点和终点之后,行情的走势方向就被确立了(空头趋势); (2)根据道氏理论的逻辑,行情会按照波峰浪谷的锯齿形运行,行情确立之后会走回撤行情,回撤的过程中ZigZag会再次形成折点,就是回撤点; (3)在回撤点选择机会进场,等待行情再次启动,止损可以放到回撤的高点。 一套交易系统基本的框架就建立起来了。 Zigzag的使用方法二 作为画趋势线的连接点 趋势线是很常见的技术指标,在技术分析中被广泛地使用。 但一直以来趋势线在实战中都存在一个BUG,那就是难以保证划线的一致性。 在图表上有很多的高低点,到底该连接哪一个呢?不同的书上画趋势线的方法
FREE

Der VR Donchian -Indikator ist eine verbesserte Version des Donchian-Kanals. Die Verbesserungen betrafen fast alle Funktionen des Kanals, der Hauptbetriebsalgorithmus und die Kanalkonstruktion blieben jedoch erhalten. Je nach aktuellem Trend wurde dem Ball-Indikator eine Änderung der Farbe der Niveaus hinzugefügt – dies zeigt dem Händler deutlich eine Trendänderung oder eine Seitwärtsbewegung an. Es wurde die Möglichkeit hinzugefügt, den Händler über den Ausbruch einer von zwei Kanalebenen per S
FREE

Note from Developer:
This is the lite version of the Double TMA with Bands Indicator.
I will be uploading a paid version that comes with alerts and on screen signal arrows built in.
I will also be selling an EA based on this trading system once all backtesting and optimization have been completed.
Unlock your trading potential with the Double TMA Indicator with Reversal Detection!
Designed for swing and reversal trading, this versatile tool integrates two Triangular Moving Averages (TMA) f
FREE
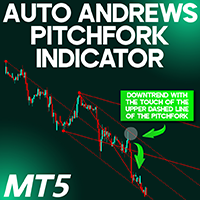
Auto Andrews Pitchfork indicator MT5
The Auto Andrews Pitchfork indicator MT5 is a specialized technical tool on the MetaTrader 5 platform that automatically plots three equidistant, parallel trendlines by using three selected pivot points (significant highs and lows). These lines serve as evolving zones of support and resistance, providing actionable trade signals when price interacts with them. This tool simultaneously generates two pitchfork patterns—one outlined in dotted lines and the othe
FREE
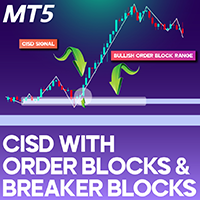
CISD with Order Blocks and Breaker Blocks ICT MT5 The CISD Indicator with Order Blocks and Breaker Blocks (CISD-CSD + OB & BB) is a specialized ICT-based tool designed for MetaTrader 5 . This indicator highlights bullish order blocks in blue and bearish order blocks in red, helping traders identify key price levels where major financial institutions execute their trades. Additionally, when the price reaches these order block zones, the indicator detects CISD-level breakouts and displays correspo
FREE

This is a conventional volume indicator, which displays the ticks or real volume (if available from your broker). But it has others features like: 5 color schemes: single, when crossing with moving average, when crossing a specific level, when having different volume between bars and when candle change color. Being hable to have a customizable moving average. Being hable to have a value indicator line. Many thanks to Diego Silvestrin for the ideas to version 1.1 and Konstantin Demidov for
FREE
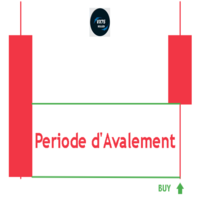
Engulfing Period V75Killed Indikator: Revolutionieren Sie Ihre Trading-Strategie!
(Dieser Indikator ist PRIVAT und ausschließlich für Trader gedacht, die seinen spezifischen Zweck und Wert kennen.) Der Engulfing Period V75Killed Indikator ist ein Game-Changer für Trader, die mühelos wichtige Engulfing-Perioden über mehrere Zeitrahmen hinweg erkennen möchten. Durch das Markieren von Engulfing-Zonen direkt auf Ihrem Chart spart dieser Indikator Zeit und verbessert Ihre Fähigkeit, Handelsmöglichke
FREE

Peak Trough Analysis is the great tool to detect peaks and troughs in your chart. Peak Trough Analysis tool can use three different peaks and troughs detection algorithm. The three algorithm include the orignal Fractals Indicator by Bill Williams, the Modified Fractals indicator and ZigZag indicator. You can use this peak and trough analysis tool to detect the price pattern made up from Equilibrium Fractal-Wave process. For further usage, there are good guide line on how to use this peak trough
FREE

Structure Blocks: a structured way to analyze market structure
This indicator is for you if you are a price action or smart money concept trader. It identifies market trends' ultimate highs and lows and intermediaries' swing lows and highs. It adjusts based on candles' body where most of the volume is, disregarding wicks. Need help or have questions? I am Lio , don't hesitate to reach out! I am always available to respond, help, and improve. How it works:
Each block consists of a move with
FREE
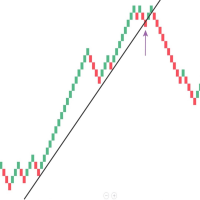
Mean Renko Bars are used for alternate price charting. Unlike the usual time framed chart – where every candle represents a fixed time interval – the goal of Renko chart is to display price movement in increments, called bricks. Best with the momentum strategies. Can make some Algo with this candel ---- ---- ---- ---- ---- ---- ---- ---- ---- ---- Support: primecapitalvn@ gmail. com
FREE

This indicator draws trading zones based on fractals from higher periods, which simplifies trading by levels.
This indicator draws two types of trading zones on one chart.
For example, if the current period is H1, then trading zones will be searched for by fractals from H4 and D1.
In the standard settings, fractal zones from H4 will be drawn in yellow, and from D1 - in green.
When zones are superimposed, colors are mixed at the intersection of zones. I don’t know how to fix this at the mome
FREE

This indicator is very useful for day traders or short term traders. (MT5 version) No need to calculate the number of pips manually, just look at the chart and you will see the Virtual Take Profit / Virtual Stop Loss target line and evaluate whether the entry point is feasible to reach the intended target or not.
Enter the intended Take Profit / Stop Loss pips for your trade. The indicator will display Virtual Take Profit / Virtual Stop Loss lines for you to easily see if the target is
FREE
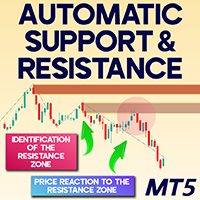
Automatic Support & Resistance Indicator for MT5
The Automatic Support & Resistance Indicator for MT5 is a sophisticated tool tailored for MetaTrader 5 users, engineered to systematically highlight significant support and resistance price zones. It marks support levels using green shades (dark green for newly formed zones, light green once retested) and resistance areas in brown tones (starting with dark brown and lightening after confirmation), offering traders visual clarity in identifying cri
FREE

Metatrader 5 version of the famous Andre Machado's Tabajara indicator. If you don't know Andre Machado's Technical Analysis work you don't need this indicator... For those who need it and for those several friend traders who asked this porting from other platforms, here it is...
FEATURES
8-period Moving Average 20-period Moving Average 50-period Moving Average 200-period Moving Average Colored candles according to the inflexion of the 20-period MA
SETTINGS You can change the Period of all MA's
FREE

You get a moving average indicator with different methods (exponential, linear, smoothed and linear weighted) calculated on smooth Heikin Ashi candles included in 'Examples' folder of Meta Trader 5. This program is dedicated for everyone trader in the market who is collecting necessary indicators designed for work with reduced market noise to better identify trends and buy opportunity.
FREE
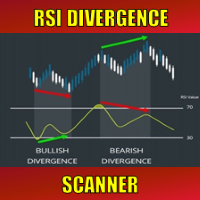
Special offer : ALL TOOLS , just $35 each! New tools will be $30 for the first week or the first 3 purchases ! Trading Tools Channel on MQL5 : Join my MQL5 channel to update the latest news from me In den dynamischen Finanzmärkten ist die Identifizierung von Trendwende-Signalen für effektives Trading unerlässlich. Der RSI Divergence Scanner ist darauf ausgelegt, Ihnen dabei zu helfen, RSI-Divergenzsignale über verschiedene Währungspaare und Zeitrahmen hinweg genau und effizient zu
FREE

The famous brazilian trader and analyst Didi Aguiar created years ago a study with the crossing of 3 Simple Moving Averages called "Agulhada do Didi", then later was also named Didi Index, as a separate indicator. The period of those SMAs are 3, 8 and 20. As simple as that, this approach and vision bring an easy analysis of market momentum and trend reversal to those traders looking for objective (and visual) information on their charts. Of course, as always, no indicator alone could be used wit
FREE

This is an indicator for Quasimodo or Over and Under pattern. It automatically finds the swing points and can even place virtual trades with stop loss and take profit. Press the "Optimize" button to automatically find the most effective settings. The pattern consists of four legs A,B,C,D as shown in the pictures. Open and close prices of the virtual trades are Bid price but the statistics in Display Panel take current spread into account. Its parameters are explained below. Buffer - Pips dista
FREE
If you love this indicator, please leave a positive rating and comment, it will be a source of motivation to help me create more products <3 Key Takeaways VWAP is a trading benchmark that typically is most useful to short-term traders. VWAP is used in different ways by traders . Traders may use it as a trend confirmation tool and build trading rules around it. Also, If prices below VWAP and move above it, c an be used by traders as a sell signal. If prices above VWAP and move below it, ca
FREE

his is a custom indicator based on double-average crossing and arrow marking.
Make multiple lists when blue arrows appear up.
Make a blank list when the red arrow appears down.
When the pink line crosses the green line upwards, the pink line is above, the green line is below, the golden fork appears, and the blue arrow appears.
When the pink line crosses down through the green line, the pink line is below, the green line is above, a dead fork appears, and a red arrow appears.
This is a goo
FREE

Goldziele sind der beste Trendindikator. Der einzigartige Algorithmus des Indikators analysiert die Bewegung des Vermögenspreises unter Berücksichtigung von Faktoren der technischen und mathematischen Analyse, ermittelt die profitabelsten Einstiegspunkte, gibt ein Signal in Form eines Pfeils und des Preisniveaus (KAUF-Einstieg / VERKAUF-Einstieg) aus eine Bestellung eröffnen. Der Indikator zeigt außerdem sofort das Preisniveau für Stop Loss und fünf Preisniveaus für Take Profit an.
ACHTUNG:
FREE

Are you tired of drawing Support & Resistance levels for your Quotes? Are you learning how to spot Support & Resistances? No matter what is your case, Auto Support & Resistances will draw those levels for you! AND, it can draw them from other timeframes, right into you current chart, no matter what timeframe you are using... You can also Agglutinate regions/zones that are too much closer to each other and turning them into one single Support & Resistance Level. All configurable.
SETTINGS
Timefr
FREE
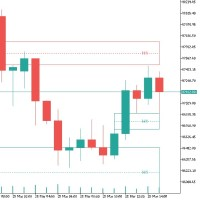
Ungleichgewichte im Trading: Grundlagen und Strategien Ein Ungleichgewicht im Trading ist ein Phänomen, bei dem ein Ungleichgewicht zwischen Angebot und Nachfrage am Markt besteht. Dies kann sich als Überschuss an Kaufaufträgen (bullisches Ungleichgewicht) oder Verkaufsaufträgen (bärisches Ungleichgewicht) äußern, was zu einer ineffizienten Preisgestaltung führt und Möglichkeiten für Trader schafft. Technische Aspekte "Kerzenmuster" : Ein Ungleichgewicht wird oft durch ein Drei-Kerzen-Muster dar
FREE
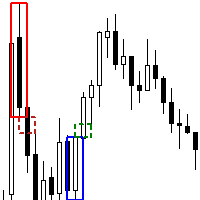
The Order Block FVG Box indicator for MetaTrader 5 is a powerful tool designed for discerning traders looking to identify and capitalize on high-probability trading opportunities. This indicator excels at pinpointing valid Order Blocks that are immediately followed by Fair Value Gaps (FVG), enhancing your trading strategy with precise visual cues. Key Features: Order Block Identification : Detects valid Order Blocks, which are significant areas where institutional buying or selling has occurred,
FREE

Custom Spread Indicator *Please write a review, thanks!
Also MT4 version is available
Spread Indicator show the current spread in pips with color codes. Handle 3 levels, Low, Medium, High. You can set levels and colors for each level (eg. Low: Green, Medium: Orange, High: Red), and can choose display position on the chart.
There is two spread calculation mode: -> Server spread value -> Ask - Bid value
Can set opacity, for better customization. When spread jump bigger, then display do not
FREE
Ekom Spike Detector
Navigate the volatile world of Boom and Crash indices with the Ekom Boom and Crash Spike Detector Indicator. This powerful tool detects explosive price movements, providing traders with accurate buy and sell signals 24/7.
Key Features:
- Accurate Spike Detection : Identify high-probability spike patterns in real-time - Clear Visual Signals : Displays clear buy and sell arrows on the chart for easy decision-making - Customizable : Easily switch from either Boom or Crash ba
FREE

The Heikin Ashi indicator is our version of the Heikin Ashi chart. Unlike competitor products, this indicator offers extensive options for calculating Heikin Ashi candles. In addition, it can be displayed as a classic or smoothed version.
The indicator can calculate Heikin Ashi with moving average by four methods: SMA - Simple Moving Average SMMA - Smoothed Moving Average EMA - Exponential Moving Average LWMA - Linear Weighted Moving Average
Main features The indicator shows Heikin As
FREE
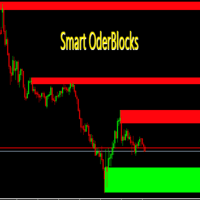
Smart OrderBlocks Indicator for MetaTrader 5 A Differentiated Vision and a Bit of Price Action! Smart OrderBlocks is an advanced indicator that reveals market structure from a unique perspective through intelligent supply and demand zone detection. Key Features OrderBlocks Detection Internal OrderBlocks : Capture micro-level market dynamics Swing OrderBlocks : Identify macro market momentum trends Advanced Volatility Intelligence Volatility detection using: Adaptive Average True Range (AT
FREE

Discover the power of harmony in the markets with this advanced harmonic pattern indicator. Designed for demanding technical traders, this indicator automatically detects 11 of the most popular harmonic patterns, including the Gartley, Bat, Crab, Butterfly, Shark, Cypher, and many more.
Thanks to its dynamic dashboard, you can easily manage the visibility of patterns on the chart, activating or deactivating the ones you want in real time without overloading your platform. This flexibility allo
FREE

SUPERTREND; Es ist ein Trendfolgeindikator, der auf dem von Olivier Seban erstellten SuperTrend ATR basiert. Es kann verwendet werden, um Änderungen in der Trendrichtung zu erkennen und Stopps zu lokalisieren. Wenn der Preis unter die Indikatorkurve fällt, wird er rot und zeigt einen Abwärtstrend an. Wenn sich der Preis dagegen über die Kurve bewegt, wird der Indikator grün und zeigt einen Aufwärtstrend an. Wie andere Indikatoren funktioniert es gut auf SuperTrend, wenn es in Verbindung mit ande
FREE

Heiken Ashi MT5 Indikator Verbessern Sie Ihre Marktanalyse mit dem Heiken Ashi MT5 Indikator. Dieses leistungsstarke Tool verwandelt Standard-Preisdaten in glattere, trendorientierte Kerzen, wodurch die Identifizierung von Markttrends und potenziellen Umkehrpunkten erleichtert wird. Hauptmerkmale: Klare Trendidentifikation: Unterscheiden Sie visuell zwischen Aufwärts- und Abwärtstrends durch unterschiedliche Kerzenfarben. Rauschreduktion: Filtern Sie Preisschwankungen heraus und erhalten Sie ei
FREE
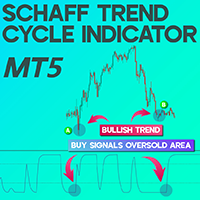
Schaff Trend Cycle Indicator for MetaTrader5
The Schaff Trend Cycle Indicator for MetaTrader5 is a momentum-based oscillator that helps detect potential reversal zones on the price chart. It is built using a hybrid model of the MACD (Moving Average Convergence Divergence) and the Stochastic Oscillator. This indicator marks readings below the 25 level as potential buying zones (oversold), while values above 75 suggest overbought conditions. The visual movement is depicted by a curved purple line
FREE

Fractals Dynamic Fractals Dynamic – ist ein modifizierter freier Fraktalindikator von Bill Williams, bei dem Sie die Anzahl der Balken links und rechts manuell festlegen und so einzigartige Muster im Diagramm erstellen können. Jetzt haben alle Handelsstrategien, die auf dem Fractals Dynamic-Indikator basieren oder auf denen der Indikator basiert, ein zusätzliches Signal.
Darüber hinaus können Fraktale als Unterstützungs- und Widerstandsniveaus fungieren. Und einige Handelsstrategien zeigen
FREE
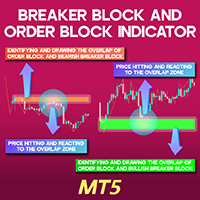
Breaker Block and Order Block Indicator for MT5
The Breaker Block and Order Block Indicator (BB+OB) is specifically developed for traders using ICT strategies to recognize key market zones. This tool employs a unique algorithm to detect intersections of Order Blocks and Breaker Blocks , highlighting them on the chart in green for bullish zones and brown for bearish zones on the MetaTrader 5 (MT5) platform. By utilizing this indicator, traders can improve their market entries and exits, refining
FREE

Der Indikator verwendet mehrere Zeitrahmen, um die besten Kaufeinträge im Boom 1000 zu ermitteln. Er ist darauf zugeschnitten, den Handel nur bei Boom-Spitzen zu unterstützen. der Indikator hat zwei Pfeile; rote und blaue. Die Bildung des roten Pfeils zeigt an, dass Sie auf einen blauen Pfeil vorbereitet sein sollten, der ein Kauf-Einstiegssignal darstellt. Der Indikator bietet keine Ausstiegspunkte. Sammeln Sie immer 3 Pips, d. h. wenn Sie einen Trade bei 10230,200 eingegangen sind, können Sie
FREE

MelonMask Indikator - Hilft beim Erkennen von Trendwenden MelonMask ist ein leistungsstarkes Tool zur technischen Analyse, das speziell für professionelle Trader entwickelt wurde und Ihnen hilft, Trendwenden im Voraus zu erkennen. Mit seinem fortschrittlichen, auf Zigzag basierenden Algorithmus identifiziert es wichtige Wendepunkte im Markt und liefert visuelle Signale. Eigenschaften des Indikators: Grüne und rote Pfeilsignale an den Trendwende-Punkten Vorhersage der potenziellen Richtung der n
FREE

The indicator shows Profit Zones on the chart, displaying the beginning and end of the local trend Profit Zone PRO is perfect for all Meta Trader symbols: currencies, metals, cryptocurrencies, stocks and indices
Advantages of the Profit Zone PRO indicator:
Input signals without redrawing The algorithms of the indicator allow you to find the ideal moments to enter a transaction (purchase or sale of an asset), which increase the success of transactions for 100% of traders. The indicator has two
FREE
Level Box Tool is a powerful and user-friendly custom indicator designed for traders who utilize technical analysis tools like rectangles and trend lines to identify key support, resistance, and price zones. This tool simplifies and speeds up the process of marking chart levels, offering both visual clarity and precision with its fully customizable panel, and now includes price-cross alerts — so you’ll never miss a key level again. MT4 Version - https://www.mql5.com/en/market/product/136009/ Jo
FREE

Silver Bullet ICT Indicator in MetaTrader 5 The Silver Bullet ICT Indicator is an advanced tool for MetaTrader 5 , designed to analyze market liquidity and key price levels during New York trading hours based on ICT (Inner Circle Trader) principles . This indicator identifies potential trade zones by monitoring high and low price movements and detecting liquidity absorption . When the price reaches a support or resistance level and then retreats to its prior range after capturing liquidity, the
FREE

Die Levels des zentralen Pivot-Bereichs werden um einen zentralen Pivot-Punkt herum gebildet.
Diese Levels in Bezug auf den zentralen Pivot können verwendet werden, um zahlreiche Marktverhalten und mögliche Ergebnisse zu bestimmen.
Die Entfernung vom zentralen Pivot und der Preis, den neue Levels in Bezug auf die Levels des Vortages bilden, können verwendet werden, um die Trendrichtung und -stärke der folgenden Tage zu bestimmen.
Zentrale Pivot-Bereiche können als Unterstützung und Widerstand
FREE

Chart Symbol Changer für MT5 ist ein Indikator/Dienstprogramm, das Ihnen die Möglichkeit bietet, das aktuelle Chartsymbol, das mit einem Klick auf eine Symbolschaltfläche auf seinem Panel verbunden ist, zu ändern. Chart Symbol Changer für MT5 bietet Ihnen die Möglichkeit, die 32 Symboltasten nach Ihren persönlichen Vorlieben zu konfigurieren, indem Sie die Paare hinzufügen, die Sie im Auge behalten und am häufigsten handeln möchten. Auf diese Weise verpassen Sie keine Gelegenheit, denn mi
FREE

The indicator displays the orders book, as well as increases its depth, remembering the location of orders that have gone beyond the current "window" view.
Indicator capability Display the levels of open positions. Simulation of placing/cancelling/editing pending orders directly in the displayed orders book.
Indicator features The orders book display works only on those trading symbols for which it is broadcast by the broker. To reset the information about the rows that were recorded in the Sm
FREE

We value your feedback and believe that your experience with the Hull Moving Average (HMA) is essential to us and other traders. Help us continue to improve and refine our product by sharing your thoughts and insights through a review!
The Hull Moving Average (HMA) Indicator – Your Key to Smoother Trends and Profitable Trades! Are you tired of lagging and choppy moving averages that hinder your ability to spot profitable trading opportunities? Look no further! The Hull Moving Average (HMA) is t
FREE

Do you love VWAP? So you will love the VWAP Cloud . What is it? Is your very well known VWAP indicator plus 3-levels of Standard Deviation plotted on your chart and totally configurable by you. This way you can have real Price Support and Resistance levels. To read more about this just search the web for "VWAP Bands" "VWAP and Standard Deviation".
SETTINGS VWAP Timeframe: Hourly, Daily, Weekly or Monthly. VWAP calculation Type. The classical calculation is Typical: (H+L+C)/3 Averaging Period to
FREE

The Pivot Point indicator automatically calculates and displays the pivot point line and support and resistance levels. Pivot can be calculated according to the Classic, Floor, Fibonacci, Woodie, Camarilla or DeMark formula. It is also possible to select the period for calculating the indicator. A trader can choose from daily, weekly, monthly, or user-defined periods.
Types of pivots Classic Floor Fibonacci Woodie Camarilla DeMark
Main features The indicator shows the current and historic
FREE

Improved Fair Value Gap Void MT5
The Improved Fair Value Gap (iFVG + Void) indicator for MetaTrader 5 is an advanced iteration of the traditional Fair Value Gap "FVG" indicator. Fair Value Gaps emerge following sharp price movements, marking crucial zones where supply and demand are unbalanced. Price action often gravitates back to these levels. This indicator visually marks bullish Fair Value Gaps (FVG) with green boxes and bearish Fair Value Gaps with red boxes. Additionally, it shades the us
FREE

Indicator determines the direction of price movement, calculates the possibility of entering the market using an internal formula and displays a breakout entry signal. Indicator signals appear both at the beginning of trend movements and in the opposite direction, which allows you to open and close orders as efficiently as possible in any of the market conditions. Version for МТ4: https://www.mql5.com/en/market/product/58349
Benefits: a unique signal calculation formula; high signal accuracy; d
FREE

The MACD 2 Line Indicator is a powerful, upgraded version of the classic Moving Average Convergence Divergence (MACD) indicator.
This tool is the embodiment of versatility and functionality, capable of delivering comprehensive market insights to both beginner and advanced traders. The MACD 2 Line Indicator for MQL4 offers a dynamic perspective of market momentum and direction, through clear, visually compelling charts and real-time analysis.
Metatrader4 Version | How-to Install Product | How-t
FREE

Understanding the levels of the previous day or week is very important information for your trading.
This indicateur allow to draw Previous day High/Low Previous week High/Low
Congifuration High & Low for: Previous day, week Line Style, color Label position, size, color Any questions or comments, send me a direct message here https://www.mql5.com/en/users/mvonline
FREE

Line Profit Indikator der visuellen Gewinnlinie in der Einzahlungswährung. Funktioniert nur, wenn auf dem Markt offene Positionen für das Symbol vorhanden sind, auf dem der Indikator installiert ist. Sie können die Linie mit der Maus verschieben oder die automatische Verfolgung des Gebotspreises aktivieren. Beschreibung der Anzeigeeinstellungen: colotLine - Linienfarbe WidthLine - Linienbreite colotText - Textfarbe FontSize - die Höhe des Textes Anker - eine Ankermethode für Text FollowBid - F
FREE

Weil Stil wichtig ist
Ich weiß, wie lästig es ist, jedes Mal auf Eigenschaften zu klicken, um die Farbe der Kerze zu ändern, den Hintergrund hell oder dunkel zu machen und das Gitter einzufügen oder zu entfernen. Hier ist die Lösung mit nur einem Klick: Drei anpassbare Schaltflächen zur Auswahl des Kerzenstils, den Händler wünschen. Eine Schaltfläche zum Umschalten zwischen Tag- und Nachtmodus. Eine Schaltfläche zum Ein- und Ausblenden des Gitters in den Charts. *****In den Einstellungen könn
FREE
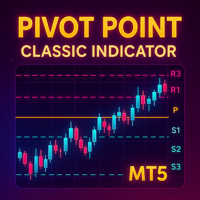
Detailed Description: The Pivot Point Classic Indicator is designed for traders who rely on classic pivot points and midpoints levels for their trading strategies. By automatically calculating and plotting these levels, the indicator provides a clear, visual representation of critical price areas where the market may reverse or break out. Key Features: Automatic Pivot Point Calculations : Automatically calculates pivot points, three support (S1, S2, S3) and resistance (R1, R2, R3) levels bas
FREE
Indicator Description Range Filter Pro is a sophisticated trading tool for XAUUSD (Gold) that combines adaptive price filtering with volume analysis and real-time market monitoring. Designed for both novice and professional traders, this indicator helps identify trend direction, potential reversals, and significant market movements through its multi-layered approach.
Key Components 1.Dynamic Range Filter 2.Volatility-Adjusted Bands 3.Volume-Enhanced Candles 4.Professional Trading Dashboard 5.M
FREE
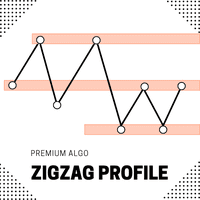
Introducing the ZigZag Profile — a powerful tool designed to identify high-probability pivot zones where price action frequently reverses. This indicator analyzes historical price data to pinpoint key areas where price has pivoted multiple times, providing traders with actionable insights into potential support and resistance levels. The ZigZal Profile indicator continuously scans for zones where price has reversed direction the most, highlighting these critical areas on your chart. By focusing
FREE

This is RSI with alarm and push notification -is a indicator based on the popular Relative Strength Index (RSI) indicator with Moving Average and you can use it in Forex, Crypto, Traditional, Indices, Commodities. You can change colors to see how it fits you. Back test it, and find what works best for you. This product is an oscillator with dynamic overbought and oversold levels, while in the standard RSI, these levels are static and do not change.
This allows RSI with alarm and push notifica
FREE

Koala Price Action Scanner - Die Kraft der Preisaktion entfesseln Einführung: Entdecken Sie den neuen Koala Price Action Scanner - ein vielseitiges, mehrwähriges und mehrzeitliches Tool, das entwickelt wurde, um wesentliche Preisaktionsmuster zu erkennen und sie in einer intuitiven Scanner-Tabelle darzustellen. Abstract: Dieser Indikator geht über das Übliche hinaus und bietet Benutzern die Möglichkeit, wichtige Preisaktionsmuster über verschiedene Währungen und Zeiträume hinweg zu identifiziere
FREE

BeST_Oscillators Collection is a Composite MT5 Indicato r including the Chaikin , Chande and TRIX Oscillators from which by default Chaikin and TRIX Oscillators but not Chande Momentum Oscillator are contained in MT5 platform. It also provides for each Oscillator the option of displaying or not a Mov. Average as a Signal Line and the resulting Signals as Arrows in a Normal (all arrows) or in a Reverse Mode (without showing up any resulting successive and of same type arrows).
Analytically fo
FREE
Elevate Your Trading with Advanced Anchored Volume Weighted Average Price Technology Unlock the true power of price action with our premium Anchored VWAP Indicator for MetaTrader 5 - the essential tool for precision entries, strategic exits, and high-probability trend continuation setups. Write me a DM for a 7 day free trial. Anchored VWAP Plus gives traders unprecedented control by allowing custom anchor points for Volume Weighted Average Price calculations on any chart. With support for 4 sim
FREE

The Hull Moving Average is not very well know in novice and maybe in intermediate trading circles, but it is a very nice solution created by the trader Alan Hull - please visit www.AlanHull.com for full details of his creation. The purpose of this moving average is to solve both problems that all famouse and common moving averages have: Lag and Choppiness . The implementation we did has, apart of the Period configuration and Price type to use in the calculations, a "velocity" factor, which could
FREE
Erfahren Sie, wie man einen Handelsroboter im MetaTrader AppStore, dem Shop für Applikationen für die MetaTrader Handelsplattform, kaufen kann.
Das Zahlungssystem der MQL5.community ermöglicht Zahlungen mit PayPal, Kreditkarten und den gängigen Zahlungssystemen. Wir empfehlen Ihnen eindringlich, Handelsroboter vor dem Kauf zu testen, um eine bessere Vorstellung von dem Produkt zu bekommen.
Sie verpassen Handelsmöglichkeiten:
- Freie Handelsapplikationen
- Über 8.000 Signale zum Kopieren
- Wirtschaftsnachrichten für die Lage an den Finanzmärkte
Registrierung
Einloggen
Wenn Sie kein Benutzerkonto haben, registrieren Sie sich
Erlauben Sie die Verwendung von Cookies, um sich auf der Website MQL5.com anzumelden.
Bitte aktivieren Sie die notwendige Einstellung in Ihrem Browser, da Sie sich sonst nicht einloggen können.