
Price Action Analysis Toolkit Development (Part 24): Price Action Quantification Analysis Tool

Contents
Introduction
Most price action traders depend on distinct candlestick formations, such as pin bars, dojis, engulfing bars, and marubozu candles. These candles are used to identify shifts in market sentiment and spot potential reversals or continuation moves. Manually hunting through dozens of charts for these signals can be time‑consuming and prone to oversight.
We’ve developed the Price Action Quantification Analysis EA for MetaTrader 5 to address this challenge. This Expert Advisor:
- Automatically scans a configurable number of recent bars for four widely respected price‑action patterns.
- Marks each detected pattern on the chart with arrows and labels, offering clear visual cues.
- Issues alert and records the subsequent bar’s pip movement to help you gauge signal strength.
- Provides built‑in backtest statistics by treating each pattern as a “trade” and calculating an overall win rate.
In the following sections, we’ll dive into the EA’s structure, walk through its customizable settings, and show how its performance metrics can sharpen your price‑action trading approach. Let’s start by exploring the specific candlestick patterns this EA watches for, examining each candle’s anatomy and the calculations used to pinpoint them.
Candlestick Patterns
- Pin Bars
A pin bar is a single candlestick with a tiny body and a long tail, or shadow. When you see one, it means the price tried to move far in one direction but was pushed back.
In a bearish pin bar, the long upper shadow shows buyers failed to keep prices up and sellers took over.
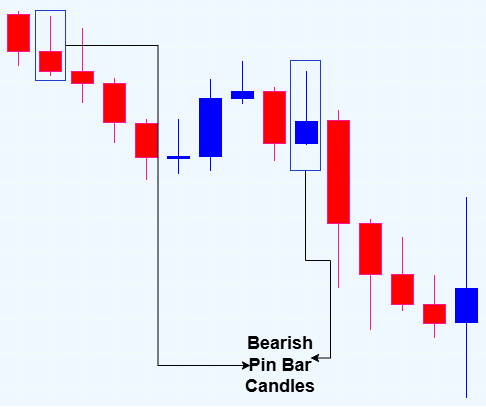
Fig 1. Bearish Pin bar
A bullish pin bar has a long lower shadow, which tells you buyers stepped in and turned the tide higher.
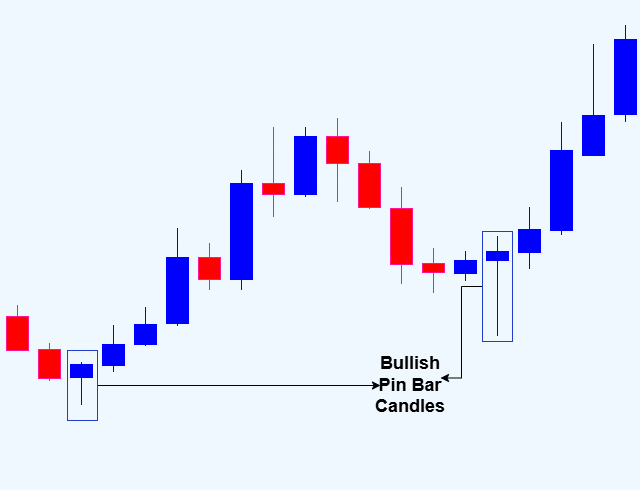
Fig 2. Bullish Pin bar
The color of the candle can also add weight to the signal. In a bearish pin bar, a red (or black) body is more convincing because it closes below the open, showing seller dominance. For a bullish pin bar, a green (or white) body reinforces the signal by closing above the open, reflecting buying pressure. However, the pin bar's shape and tail length are more important than the color alone. To trust the signal, look for a tail at least two or three times the body’s size, notice any volume spikes during the rejection, and check that the pin bar appears near known support or resistance levels. These extra steps help you pick true reversals instead of ordinary wicks.
Logic Steps
- Calculate candleBody, topShadow, bottomShadow.
- Require candleBody > minBodyPoints * _Point.
Bearish Pin Bar:
topShadow > or = wickToBodyRatio * candleBody
bottomShadow < smallWickCap * candleBody
Bullish Pin Bar:
bottomShadow > or = wickToBodyRatio * candleBody
topShadow < smallWickCap * candleBody
// 1. Calculate parts
double candleBody   = MathAbs(closePrice - openPrice);
double topShadow    = highPrice - MathMax(openPrice, closePrice);
double bottomShadow = MathMin(openPrice, closePrice) - lowPrice;

// 2. Minimum body check
if(candleBody > minBodyPoints * _Point)
{
   // Bearish pin bar
   if(topShadow >= wickToBodyRatio * candleBody
      && bottomShadow < smallWickCap * candleBody)
      Print("Bearish Pin Bar detected");

   // Bullish pin bar
   else if(bottomShadow >= wickToBodyRatio * candleBody
           && topShadow < smallWickCap * candleBody)
      Print("Bullish Pin Bar detected");
}
- Doji
A Doji appears when a candlestick’s open and close are virtually identical. It signals market indecision and draws its bias from the preceding trend. Variations in upper and lower shadow length create formations resembling a plus sign, a cross or an inverted cross.
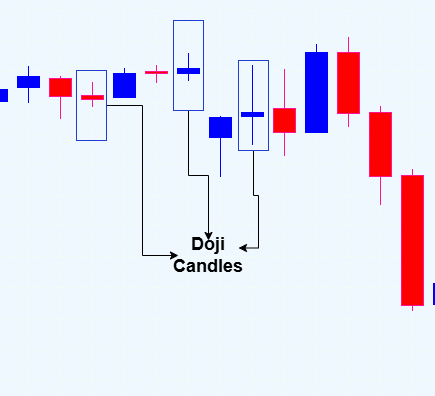
Fig 3. Doji
Logic Steps
- Calculate candleBody, fullRange, topShadow, bottomShadow.
- Require candleBody ≤ maxDojiRatio * fullRange.
- Require topShadow > candleBody and bottomShadow > candleBody.
// 1. Calculate body and range
double candleBody   = MathAbs(closePrice - openPrice);
double fullRange    = highPrice - lowPrice;
double topShadow    = highPrice - MathMax(openPrice, closePrice);
double bottomShadow = MathMin(openPrice, closePrice) - lowPrice;

// 2. Tiny body test
if(candleBody <= fullRange * maxDojiRatio)
{
   // 3. Both shadows must extend beyond the body
   if(topShadow > candleBody && bottomShadow > candleBody)
      Print("Doji detected");
}
- Engulfing Candlestick Patterns
There are two types of engulfing candles: Bullish Engulfing and Bearish Engulfing.
Bullish Engulfing
This two-candlestick reversal pattern appears when a downtrend or consolidation ends. A smaller bearish candle is immediately followed by a larger bullish candle that completely covers the prior body. The second candle’s size shows buyers overwhelming sellers, and often marks the start of a strong up-move.
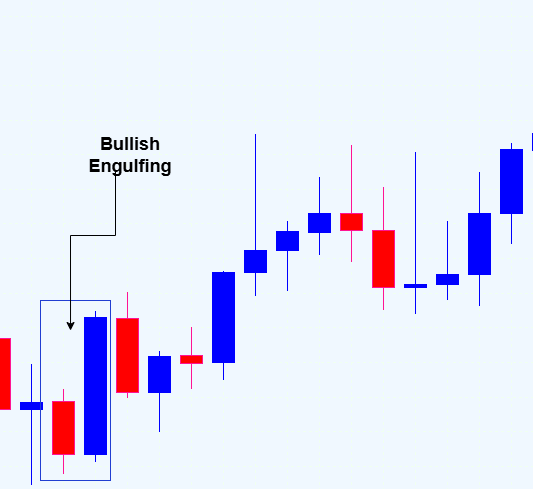
Fig 4. Bullish Engulfing
Bearish Engulfing
This is the inverse setup. A smaller bullish candle is followed by a larger bearish candle that fully engulfs the previous body. The pattern indicates sellers have seized control and can signal the beginning of a strong downward move.

Fig 5. Bearish Engulfing
Logic Steps
Calculate prevBody = |prevClose – prevOpen|, currBody = |close – open|.
Require currBody > prevBody.
Bullish Engulfing:
- prevClose < prevOpen
- openPrice ≤ prevClose
- closePrice ≥ prevOpen
Bearish Engulfing:
- prevClose > prevOpen
- openPrice ≥ prevClose
- closePrice ≤ prevOpen
// 1. Compute body sizes
double prevBody = MathAbs(prevClose - prevOpen);
double currBody = MathAbs(closePrice - openPrice);

// 2. Must be larger than previous
if(currBody > prevBody)
{
   // Bullish engulfing
   if(prevClose < prevOpen
      && openPrice <= prevClose
      && closePrice >= prevOpen)
      Print("Bullish Engulfing detected");

   // Bearish engulfing
   else if(prevClose > prevOpen
           && openPrice >= prevClose
           && closePrice <= prevOpen)
      Print("Bearish Engulfing detected");
}
- Marubozu Candle
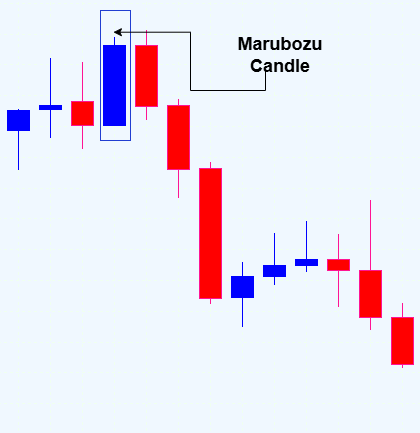
Fig 6. Marubozu
A Marubozu candle stands out with its long body and little to no wicks. Its open and close prices span nearly the entire range, signaling decisive market action. There are three Marubozu variants, each with bullish and bearish versions:
Full Marubozu
Bullish:Open at the low, close at the high. Buyers drive price from start to finish.
Bearish: Open at the high, close at the low. Sellers dominate throughout the session.
Open Marubozu
Bullish: Open at the low, close slightly below the high (a small upper wick). Buyers seize control immediately.
Bearish: Open at the high, close slightly above the low (a small lower wick). Sellers dictate the session from the outset.
Close Marubozu
Bullish:Close at the high, open slightly above the low (a small lower wick). Buying pressure builds into the close.
Bearish:Close at the low, open slightly below the high (a small upper wick). Selling pressure accelerates into the close.
Logic Steps
- Calculate candleBody, fullRange, topShadow, bottomShadow.
- Require candleBody ≥ marubozuRatio * fullRange.
- Require topShadow ≤ (1 – marubozuRatio) * fullRange and bottomShadow ≤ (1 – marubozuRatio) * fullRange.
- If closePrice > openPrice it’s bullish; otherwise it’s bearish.
// 1. Calculate parts
double candleBody   = MathAbs(closePrice - openPrice);
double fullRange    = highPrice - lowPrice;
double topShadow    = highPrice - MathMax(openPrice, closePrice);
double bottomShadow = MathMin(openPrice, closePrice) - lowPrice;

// 2. Body covers most of the range
if(candleBody >= marubozuRatio * fullRange)
{
   // 3. Shadows must be small
   double maxWick = (1 - marubozuRatio) * fullRange;
   if(topShadow <= maxWick && bottomShadow <= maxWick)
   {
      // 4. Bullish or bearish
      if(closePrice > openPrice)
         Print("Bullish Marubozu detected");
      else
         Print("Bearish Marubozu detected");
   }
}
MQL5 EA Breakdown
Above is the diagram illustrating how the EA performed once applied to the MetaTrader 5 chart. Below, we’ve tabulated the results—each value represents a percentage change. When we set out to create this Expert Advisor, our primary goal was to automate the detection of key candlestick patterns that traders often rely on for making trading decisions, such as Pin Bars, Doji, Engulfing, and Marubozu. We wanted the EA to analyze recent price action objectively, identify these patterns accurately, and provide clear visual cues on the chart, along with statistical feedback on the pattern's effectiveness.
To achieve this, we started by defining input parameters that allow flexibility in the analysis. These include the number of bars to look back (InpLookbackBars), the minimum body size in points (InpMinBodySizePts) to filter out insignificant candles, and the wick-to-body ratio (InpWickBodyRatio) for Pin Bar detection. We also included an ATR period parameter to gauge market volatility, which can influence pattern recognition rules.
// Input parameters for customization
input int    InpLookbackBars   = 200;   // Bars to scan
input int    InpMinBodySizePts = 10;    // Min body size (points)
input double InpWickBodyRatio  = 2.0;   // Min wick-to-body ratio
input int    InpATRPeriod      = 14;    // ATR period
In the initialization phase (OnInit), we set up arrays to store calculated data for each bar, such as body size, upper and lower wicks, total range, and ATR values. We made sure these arrays are series-based so we could process recent bars efficiently. Additionally, we prepared a small buffer to keep track of recent signals, which helps in analyzing pattern success rates later.
int OnInit()
  {
   ArraySetAsSeries(Body,true);
   ArraySetAsSeries(UpperWick,true);
   ArraySetAsSeries(LowerWick,true);
   ArraySetAsSeries(TotalRange,true);
   ArraySetAsSeries(ATR,true);
   ArrayResize(Body, InpLookbackBars+2);
   ArrayResize(UpperWick, InpLookbackBars+2);
   ArrayResize(LowerWick, InpLookbackBars+2);
   ArrayResize(TotalRange, InpLookbackBars+2);
   ArrayResize(ATR, InpLookbackBars+2);

   for(int i=0;i<5;i++)
      g_history[i]="";

   return(INIT_SUCCEEDED);
  }
The core logic resides in the OnTick function, which runs on every new market tick. To prevent unnecessary calculations, we added a check to process only once per new bar by comparing timestamps. When a new bar is detected, we invoke AnalyzeAndDraw, which performs the main analysis.
void OnTick()
  {
   static datetime lastTime=0;
   datetime current = iTime(_Symbol, _Period, 0);
   if(current == lastTime)
      return; // Only process once per new bar
   lastTime = current;
   AnalyzeAndDraw();
  }
Within AnalyzeAndDraw, we first clear any previous drawings to keep the chart uncluttered. Then, we loop through the recent bars to calculate key candlestick metrics: the body size (absolute difference between open and close), the upper wick (high minus the maximum of open and close), the lower wick (minimum of open and close minus low), and the total range (high minus low). We also copy ATR values to incorporate volatility considerations into pattern detection.
void AnalyzeAndDraw()
  {
   int bars = MathMin(InpLookbackBars, (int)SeriesInfoInteger(_Symbol,_Period,SERIES_BARS_COUNT));

   ObjectsDeleteAll(0,0,OBJ_ARROW);
   ObjectsDeleteAll(0,0,OBJ_LABEL);

   for(int i=0; i<bars; i++)
     {
      double op = iOpen(_Symbol,_Period,i);
      double cl = iClose(_Symbol,_Period,i);
      double hi = iHigh(_Symbol,_Period,i);
      double lo = iLow(_Symbol,_Period,i);

      // Calculate candlestick components
      Body[i]       = MathAbs(cl-op);
      UpperWick[i]  = hi - MathMax(op,cl);
      LowerWick[i]  = MathMin(op,cl) - lo;
      TotalRange[i] = hi - lo;
     }

   // Copy ATR buffer
   if(CopyBuffer(iATR(_Symbol,_Period,InpATRPeriod),0,0,bars,ATR)<=0)
      return; // Exit if ATR data not available
Next, we apply our pattern recognition rules. For example, to identify a Pin Bar, we check if the candle has a small body and a long wick, with the wick-to-body ratio exceeding our threshold.
- Bearish Pin Bar: long upper wick > or = ratio × body, small lower wick
- Bullish Pin Bar: long lower wick > or = ratio × body, small upper wick
We first filter out tiny bodies (Body > minPts). Then we enforce one wick to be at least InpWickBodyRatio times the body, and the opposite wick to stay under 50% of the body.
// assume Body[i], UpperWick[i], LowerWick[i] already computed
if(InpShowPinBar && Body[i] > InpMinBodySizePts*_Point)
{
   // Bearish: towering upper wick, stubby lower wick
   if( UpperWick[i] > Body[i]*InpWickBodyRatio
       && LowerWick[i] < Body[i]*0.5 )
      type = "Bearish Pin Bar";

   // Bullish: towering lower wick, stubby upper wick
   else if( LowerWick[i] > Body[i]*InpWickBodyRatio
            && UpperWick[i] < Body[i]*0.5 )
      type = "Bullish Pin Bar";
}
For Doji, we look for candles with minimal bodies relative to a point-based threshold, and with wicks indicating potential indecision.
- Body < or = DojiBodyRatio × totalRange
- Both wicks > body (to confirm there are shadows)
We cap the body at, say, 10% of the full range (InpDojiBodyRatio). Requiring each wick to exceed the body filters out “spinning tops” that have barely any shadows.
// TotalRange[i] = high – low
if(InpShowDoji
   && Body[i] <= TotalRange[i] * InpDojiBodyRatio    // body tiny vs full range
   && UpperWick[i] > Body[i]                         // upper shadow present
   && LowerWick[i] > Body[i])                        // lower shadow present
   type = "Doji";
Engulfing patterns involve comparing the current candle with the previous one, checking if the previous candle's open and close are on opposite sides and if the current candle fully engulfs the previous.
- Bullish Engulfing: prior bar was bearish, current open ≤ prior close, current close ≥ prior open, and currBody > prevBody
- Bearish Engulfing: prior bar was bullish, current open ≥ prior close, current close ≤ prior open, and currBody > prevBody
double po = iOpen(_Symbol,_Period,i+1),
       pc = iClose(_Symbol,_Period,i+1);
double prevBody = MathAbs(pc - po),
       currBody = Body[i];

if(InpShowEngulfing && currBody > prevBody)
{
   // Bullish: current body engulfs prior’s
   if(pc < po && op <= pc && cl >= po)
      type = "Bullish Engulfing";
   // Bearish: current body engulfs prior’s
   else if(pc > po && op >= pc && cl <= po)
      type = "Bearish Engulfing";
}
For Marubozu candles, we check if the body covers most of the total range, indicating strong momentum.
- Body > or = MarubozuBodyRatio × totalRange (e.g. > or = 90%)
- Both wicks < or = (1 – MarubozuBodyRatio) × totalRange
if(InpShowMarubozu
   && Body[i] >= TotalRange[i] * InpMarubozuBodyRatio
   && UpperWick[i] <= TotalRange[i] * (1 - InpMarubozuBodyRatio)
   && LowerWick[i] <= TotalRange[i] * (1 - InpMarubozuBodyRatio))
{
   type = (cl > op) ? "Bullish Marubozu" : "Bearish Marubozu";
}
Whenever a pattern is found, we increment counters for total signals and wins. We define "wins" based on whether the subsequent candle moves in the expected direction, providing some measure of pattern reliability.
if(type!="")
{
    lastIdx = i;
    lastCl = cl;
    lastIsBuy = (StringFind(type,"Bullish")>=0);
    latestSignal = type;

    g_totalSignals++;
    double nextC = iClose(_Symbol,_Period,i-1);
    if(lastIsBuy && nextC>cl)
        g_totalWins++;
    if(!lastIsBuy && nextC<cl)
        g_totalWins++;

    DrawPattern(i, type, lastIsBuy);
    break;
}
To make these signals visually accessible, we draw arrows pointing up or down on the chart, along with labels indicating the pattern type, using the DrawPattern function. We also generate alerts to notify us immediately when a pattern appears.
void DrawPattern(int idx, const string type, bool isBuy)
  {
   datetime t = iTime(_Symbol,_Period,idx);
   double y = iHigh(_Symbol,_Period,idx) + 15*_Point;
   string an = StringFormat("PAQ_%s_%d",type,idx);
   ObjectCreate(0,an,OBJ_ARROW,0,t,y);
   ObjectSetInteger(0,an,OBJPROP_ARROWCODE,isBuy?233:234);
   ObjectSetInteger(0,an,OBJPROP_COLOR,isBuy?clrLime:clrRed);
   string lbl = an+"_lbl";
   ObjectCreate(0,lbl,OBJ_LABEL,0,t,y-25*_Point);
   ObjectSetString(0,lbl,OBJPROP_TEXT,type);
   ObjectSetInteger(0,lbl,OBJPROP_COLOR,isBuy?clrLime:clrRed);
  }
Throughout development, we aimed to make the EA flexible and informative. So, we included a pattern history buffer to keep recent signals, and at the end of the backtest or when we remove the EA, we print out performance statistics like total signals, wins, and win rate. This helps us evaluate how effective our pattern detection logic is over time.
void OnDeinit(const int reason)
  {
   double rate = g_totalSignals>0 ? 100.0*g_totalWins/g_totalSignals : 0.0;
   PrintFormat("[PAQ] Backtest completed: Signals=%I64d Wins=%I64d WinRate=%.1f%%",
               g_totalSignals, g_totalWins, rate);
  }
In conclusion, this EA was developed by integrating candlestick pattern detection logic with visual indicators and performance tracking features. Our goal was to create an automated system that simplifies the often-time-consuming task of identifying patterns, while simultaneously offering clear visual signals and performance statistics to support more informed trading decisions.
Outcomes
Let's look at how our EA performed both in real-time and back testing. Firstly, we see the pattern in the diagram below, that was detected by the EA in the live market, which is the bearish engulfing. We can clearly see that it's the real one as the bear candle totally engulfs the previous bull candle.
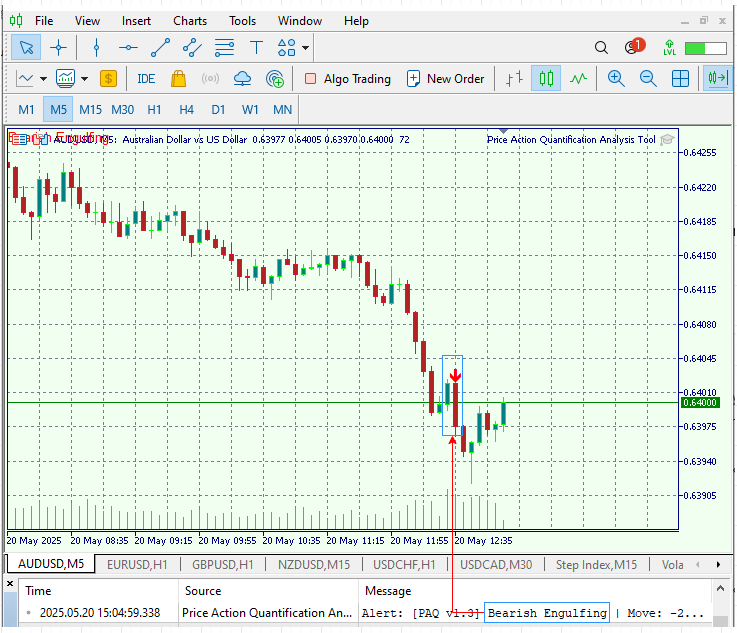
Fig 7. Bearish Engulfing
Next, we have a bearish pin bar that was successfully detected. It’s a valid pin bar, which demonstrates the tool’s accuracy in identifying candlestick patterns.
Fig 8. Bearish Pin bar
Finally, we have our backtesting results. The EA is correctly identifying patterns and logging the name of each detected pattern into the journal.
Fig 9. Backtesting
Conclusion
From the results outlined in the previous section, it’s clear that our EA reliably detects the four key candlestick patterns. This milestone will help both novice and experienced traders identify formations that can be difficult to pick out with the naked eye. In my backtests and live-market trials, the EA correctly flagged each pattern. While no system is perfect, some signals may not follow through, the EA isn’t intended to filter out every false signal. Instead, it offers an additional, precise layer of price-action analysis. Traders can then apply their own confirmation techniques before committing to a long or short position.
Overall, the EA excels at its core task: pattern recognition. I give it a strong endorsement for accurately spotting the four formations it targets. You are welcome to adjust the input parameters to suit your strategy. I welcome your feedback on any areas you think could be further enhanced.
| Date | Tool Name | Description | Version | Updates | Notes |
|---|---|---|---|---|---|
| 01/10/24 | Chart Projector | Script to overlay the previous day's price action with a ghost effect. | 1.0 | Initial Release | Tool number 1 |
| 18/11/24 | Analytical Comment | It provides previous day's information in a tabular format, as well as anticipates the future direction of the market. | 1.0 | Initial Release | Tool number 2 |
| 27/11/24 | Analytics Master | Regular Update of market metrics after every two hours | 1.01 | Second Release | Tool number 3 |
| 02/12/24 | Analytics Forecaster | Regular Update of market metrics after every two hours with telegram integration | 1.1 | Third Edition | Tool number 4 |
| 09/12/24 | Volatility Navigator | The EA analyzes market conditions using the Bollinger Bands, RSI and ATR indicators | 1.0 | Initial Release | Tool Number 5 |
| 19/12/24 | Mean Reversion Signal Reaper | Analyzes market using mean reversion strategy and provides signal | 1.0 | Initial Release | Tool number 6 |
| 9/01/25 | Signal Pulse | Multiple timeframe analyzer | 1.0 | Initial Release | Tool number 7 |
| 17/01/25 | Metrics Board | Panel with button for analysis | 1.0 | Initial Release | Tool number 8 |
| 21/01/25 | External Flow | Analytics through external libraries | 1.0 | Initial Release | Tool number 9 |
| 27/01/25 | VWAP | Volume Weighted Average Price | 1.3 | Initial Release | Tool number 10 |
| 02/02/25 | Heikin Ashi | Trend Smoothening and reversal signal identification | 1.0 | Initial Release | Tool number 11 |
| 04/02/25 | FibVWAP | Signal generation through python analysis | 1.0 | Initial Release | Tool number 12 |
| 14/02/25 | RSI DIVERGENCE | Price action versus RSI divergences | 1.0 | Initial Release | Tool number 13 |
| 17/02/25 | Parabolic Stop and Reverse (PSAR) | Automating PSAR strategy | 1.0 | Initial Release | Tool number 14 |
| 20/02/25 | Quarters Drawer Script | Drawing quarters levels on chart | 1.0 | Initial Release | Tool number 15 |
| 27/02/25 | Intrusion Detector | Detect and alert when price reaches quarters levels | 1.0 | Initial Release | Tool number 16 |
| 27/02/25 | TrendLoom Tool | Multi timeframe analytics panel | 1.0 | Initial Release | Tool number 17 |
| 11/03/25 | Quarters Board | Panel with buttons to activate or disable quarters levels | 1.0 | Initial Release | Tool number 18 |
| 26/03/25 | ZigZag Analyzer | Drawing trendlines using ZigZag Indicator | 1.0 | Initial Release | Tool number 19 |
| 10/04/25 | Correlation Pathfinder | Plotting currency correlations using Python libraries. | 1.0 | Initial Release | Tool number 20 |
| 23/04/25 | Market Structure Flip Detector Tool | Market structure flip detection | 1.0 | Initial Release | Tool number 21 |
| 08/05/25 | Correlation Dashboard | Relationship between different pairs | 1.0 | Initial Release | Tool number 22 |
| 13/05/25 | Currency Strength Meter | measuring the strength of each currency across pairs | 1.0 | Initial Release | Tool number 23 |
| 21/05/25 | PAQ Analysis Tool | Candlestick formation detector | 1.0 | Initial Release | Tool number 24 |
- Free trading apps
- Over 8,000 signals for copying
- Economic news for exploring financial markets
You agree to website policy and terms of use