
From Novice to Expert: Auto-Geometric Analysis System
Contents:
Introduction
Today’s discussion aims to address the challenge of analyzing candlestick patterns using geometric approaches. In our recent article, From Novice to Expert: Programming Candlesticks, we focused on identifying simple candlestick patterns, which are typically composed of just a few candles. However, when working with larger sequences of candlesticks, pattern recognition becomes more complex, as consistency tends to diminish over long series.
One clear insight, though, is that we can still identify major highs and lows within the data. Connecting these points can help us gauge trends more effectively.
When we first learned about forex trading, many educational resources introduced the idea of triangle formations and other geometric patterns in market price action. And indeed, geometry is present in the markets—it can offer a simplified and visual summary of what the market is doing.
Most traders are accustomed to identifying these shapes manually by drawing trend lines or placing geometric objects on charts. Today, we aim to take this a step further by leveraging MQL5 to automate this process, removing the need for manual intervention and enabling faster and more consistent analysis.
Background
The advantage of object-oriented programming (OOP) lies in its powerful ability to model and solve real-world computational problems efficiently. MQL5, a language derived from C++, inherits this strength and stands as a valuable asset dedicated to the development of trading algorithms. Considering the problem at hand, we are already equipped with a significant advantage due to the structural and modular benefits that OOP offers.
In this section, we will briefly define the key terms related to our subject before exploring traditional methods used to identify geometric shapes in trading. While many shapes exist in technical analysis, we will focus on two common examples: rectangles and triangles.
What's Geometry?
Geometry is a branch of mathematics that deals with the properties and relationships of space. This includes the study of distances, shapes, sizes, angles, and the relative positions of figures. Geometry provides a robust framework for interpreting the physical world by enabling us to model and analyze spatial relationships.
Why is Geometry important in the context of Trading?
Geometry provides a visual and structural framework for understanding and interpreting market behavior. Traders often rely on patterns and shapes that emerge from price action, and these patterns are inherently geometric. It aids in pattern recognition, and here is a list of common patterns known to the majority of traders:
- Triangle (ascending, descending, symmetrical)
- Rectangles (consolidation zones)
- Channels (parallel trend lines)
- Head and Shoulders, Double Tops/Bottoms — all depend on geometric symmetry
These patterns help traders:
- Identify potential breakouts or reversals
- Gauge trend strength
- Set entry/exit points
In this table, I have gathered key considerations for applying geometric analysis to market price data.
| Aspect | Role of Geometry |
|---|---|
| Visual Clarity | Helps simplify complex market data into recognizable forms |
| Decision Support | Shapes guide entries, exits, and trade setups |
| Objectivity | Reduces guesswork by using precise spatial logic |
| Automation | Enables algorithmic detection of patterns and key levels |
| Market Psychology | Shapes often reflect collective trader behavior (e.g., triangles show compression) |
Let’s take a look at how triangle and rectangle geometries are traditionally applied in trading. I’ll provide a general overview of what different triangle patterns typically suggest about price action, but I won’t go deep into specific trading strategies. This is because I’ve observed that many of the commonly accepted rules often face invalidation in real market conditions. While these patterns do work to an extent, it’s wise to pay close attention to price behavior leading up to the formation of the geometric structures.
For example, although an ascending triangle is generally expected to result in a bullish breakout, I’ve seen numerous cases where the opposite occurs. These shapes often represent decision points in the market, not guarantees. Therefore, while the pattern may suggest a certain directional move, it’s critical to align your interpretation with the actual price context preceding the pattern. Relying solely on textbook expectations without market context can lead to misleading conclusions.
Triangle
A triangle is a fundamental geometric shape defined by three sides and three corners (vertices). In forex trading, triangle patterns indicate potential trend continuations or reversals. The main types of triangle patterns are:
1. Symmetrical Triangle:
Indicates a period of consolidation with decreasing volatility; it often precedes a breakout in either direction.
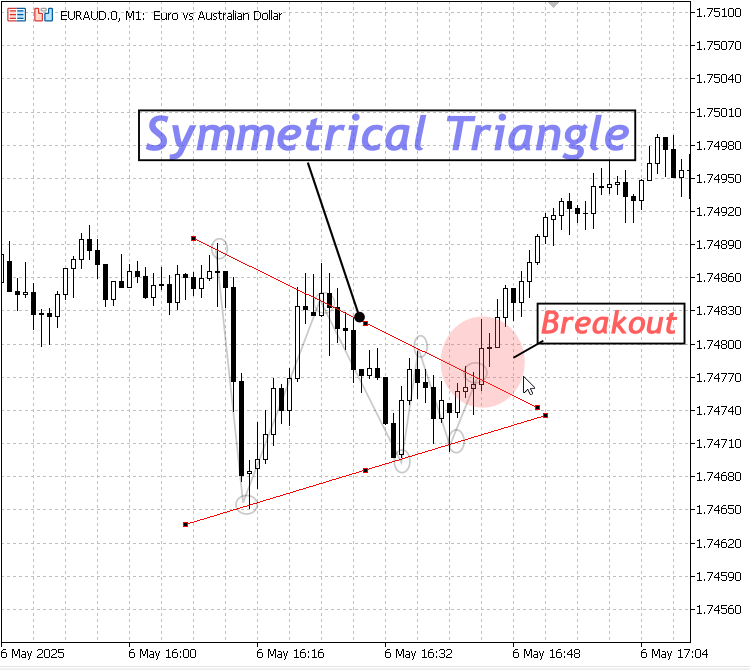
Symmetrical Triangle
2. Ascending Triangle:
Characterized by a flat or slightly sloped resistance level and rising support; typically a bullish pattern signaling potential upward breakout.
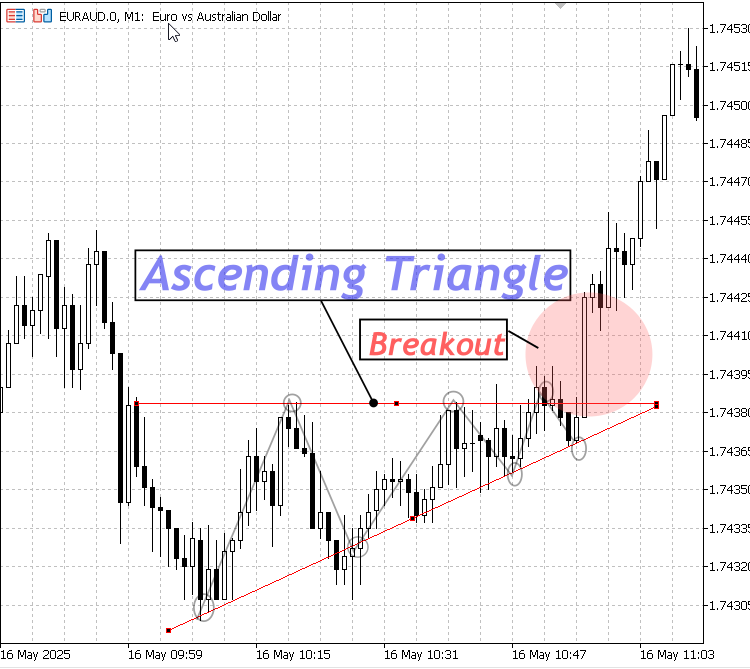
Ascending Triangle
3. Descending Triangle:
Features a flat or slightly sloped support line and declining resistance; usually bearish, hinting at a downward breakout.
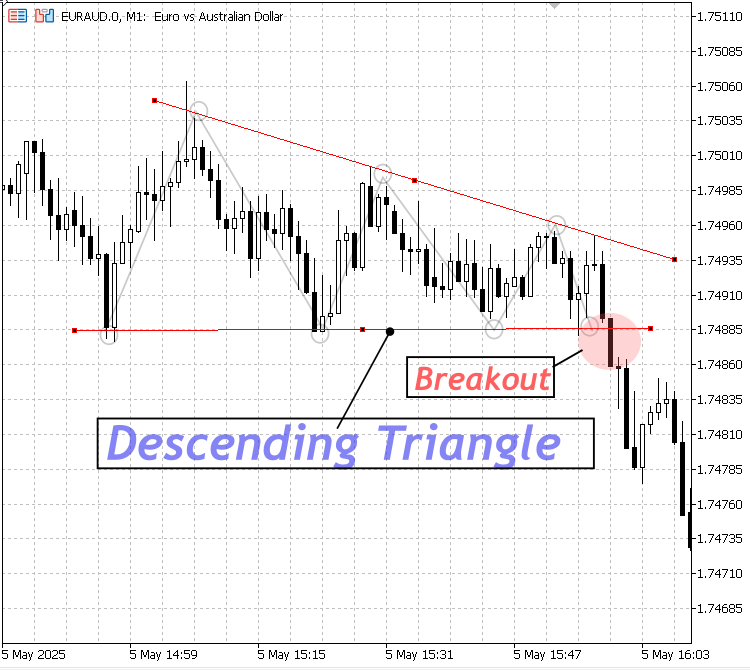
Descending Triangle
Rectangle
A rectangle is a four-sided geometric shape with opposite sides equal and parallel. It has right angles (each 90 degrees) at every corner. In forex and technical analysis, a rectangle (also called a trading range or consolidation zone) is a chart pattern where the price moves sideways within horizontal support and resistance levels. It indicates a period of indecision before the market potentially continues in the previous trend or reverses. It is available among the market analysis tools on Meta Trader 5 terminal.
Here are the key features:
- The price oscillates between a clear upper resistance line and a lower support line.
- The pattern looks like a rectangle or box on the chart.
- Breakouts above resistance or below support often signal the start of a new trend.
This concept can also be illustrated using the built-in parallel line tool, aligned horizontally to represent support and resistance levels. Since it consists of two parallel lines, it effectively highlights the price range during consolidation. However, the rectangle remains the preferred choice for marking consolidation zones because it visually "boxes" the specific period in which price moved sideways. It's important to remember that consolidation is a temporary phase—eventually, the market will break out of that range and continue its trend or reverse direction.
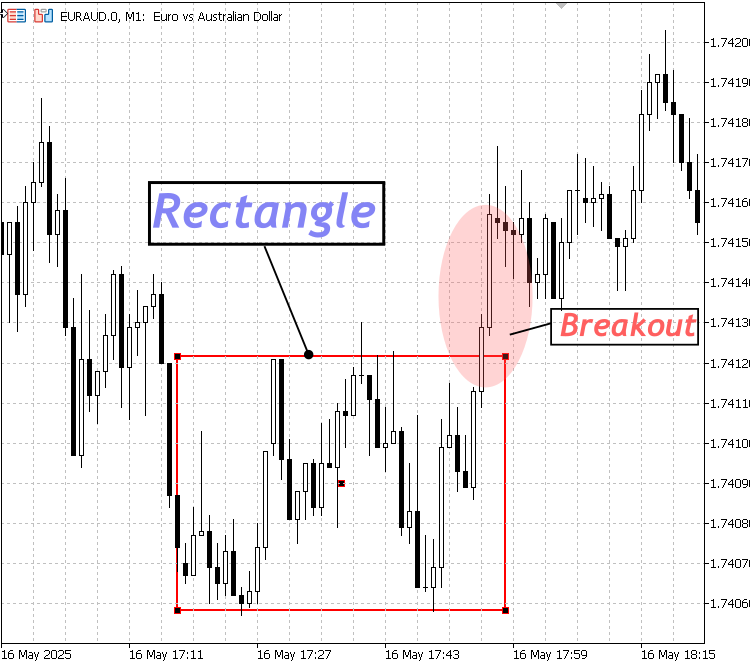
Rectangle Structure
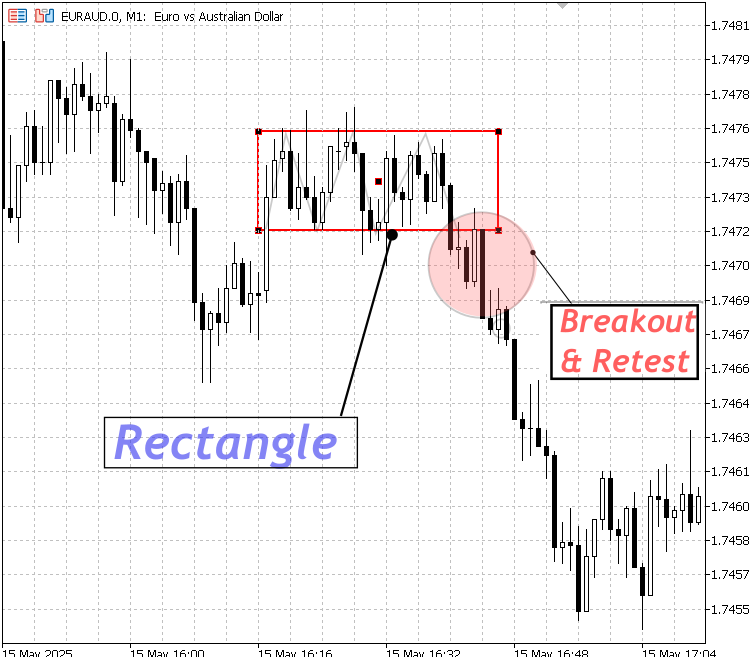
Break below a Rectangle Structure
Overview
Now that we’ve laid the theoretical foundation of our discussion, here is an overview of the practical implementation. We will use modular programming techniques to build components for a geometric structure detection system. Specifically, we will develop separate classes for detecting triangle and rectangle formations in market structure. These are just the initial examples—the approach is extensible, allowing us to add support for other shapes as needed. This is one of the key advantages of using MQL5's object-oriented and modular programming features, which empower us to tackle complex real-world problems with clean, maintainable code.
The header files we create in this section can be easily integrated into the main Expert Advisor or indicator. Moreover, they can be reused across multiple projects, promoting consistency and development efficiency.
In my approach, each geometric shape requires a set of reference points in the price data. Typically, we need two high points and two low points. These points are connected with lines to form shapes. For example, two points make a line, and a triangle can be formed by two lines converging at a point in the future. A rectangle, on the other hand, can be identified when there are two touches on both the resistance and support levels. Once these conditions are met, the geometric shape can be drawn by connecting the appropriate reference points.
To aid your understanding, I’ve included some illustrations below that demonstrate how these shapes can be constructed on the chart using computer logic. We typically need at least four key points to outline each shape. In the images, we begin by identifying points a, b, c, and d—these serve as the foundational anchors for our shape structure. From these points, the shape can be projected in advance. The dotted red lines represent theoretical expectations, indicating how the market might respond to the anticipated borders of the shape. The way price interacts with these lines can reveal important clues about future price action—such as potential breakouts or bounces.
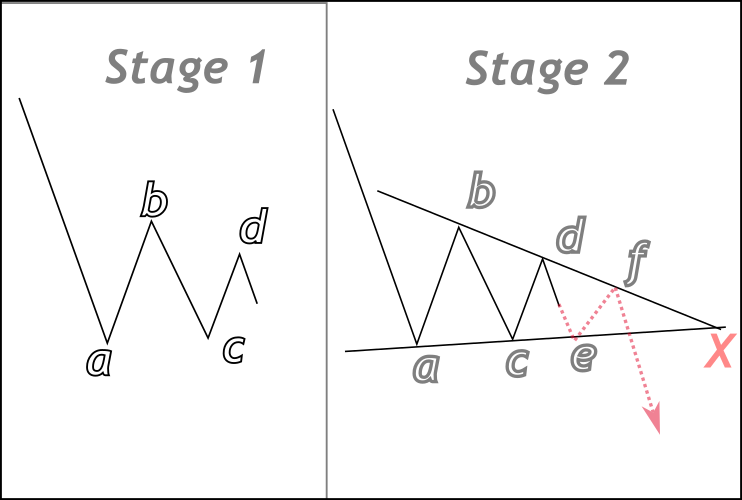
Theoretical detection of a Triangle
In the triangle illustration above, swing points ato dare identified as reference points from which a triangle can be constructed, with the converging lines meeting at point X. Points e and f represent theoretical future touches—they are speculative and may not play out exactly as shown. Their purpose is to help us conceptualize the pattern so we can translate the idea into code. The same concept applies to the rectangle illustration below, where the structure is detected using similar logic; however, the key difference is that its sides are parallel.
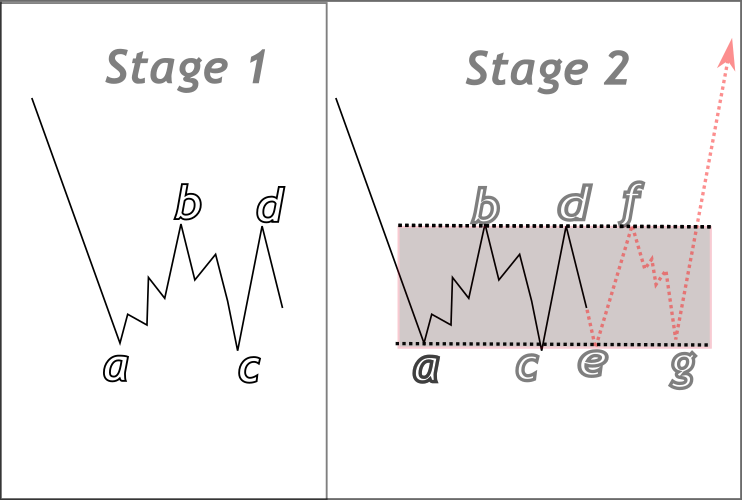
Rectangle structure detection
Implementation
At this stage, the actual development begins. We'll start by creating a header file named GeometricPatternDetector.mqh, which will contain all the necessary classes required for detecting geometric patterns. Once the header is ready, we will proceed to develop an Expert Advisor (EA) that demonstrates how to utilize the classes effectively. Now, let's go through the following steps to understand how everything comes together.
Including necessary headers
At the very top of GeometricPatternDetector.mqh we pull in three essential MQL5 libraries to give our detector all the tools it needs. First, we include arrays\ArrayObj.mqh so we can use CArrayObj—a dynamic, object-oriented array class—to store our swing pivots and pattern results without wrestling with raw pointers or manual memory management.
Next, Indicators\Indicators.mqh brings in MetaTrader’s built-in indicator functions such as iATR, CopyHigh, CopyLow, and CopyTime, allowing us to fetch historical price data and calculate the Average True Range seamlessly. Finally, Math\Stat\Math.mqh provides mathematical constants like M_PI and utility functions such as MathArctan, which we use to compute slopes, angles, and flatness tolerances in our pattern-detection algorithms. Together, these includes create the foundation for robust, readable, and maintainable code.
#include <Arrays\ArrayObj.mqh>       // For CArrayObj: dynamic arrays of objects
#include <Indicators\Indicators.mqh> // For iATR, CopyHigh, CopyLow, CopyTime
#include <Math\Stat\Math.mqh>        // For M_PI, MathArctan, and other math utilities
Container Classes
The GeometricPatternDetector.mqh header begins by defining two simple container classes: SwingPoint and PatternResult. Both inherit from MQL5’s base CObject. The SwingPoint class holds the timestamp, price, and a Boolean flag indicating whether the pivot is a high or a low. This design lets us collect and manage individual market pivots in a single object array.
The PatternResult class encapsulates all the information needed to describe a detected pattern—namely the symbol, timeframe, pattern type, three defining “vertices,” and the point at which a label should be placed. By packaging these data elements into objects, the detector code remains clean and consistent, relying on CArrayObj for storage rather than manual parallel arrays of primitives.
// SwingPoint: holds one market pivot
class SwingPoint : public CObject {
public:
   datetime time;
   double   price;
   bool     isHigh;
   SwingPoint(datetime t=0,double p=0.0,bool h=false)
     : time(t), price(p), isHigh(h) {}
};

// PatternResult: holds the details of one detected pattern
class PatternResult : public CObject {
public:
   string            symbol;
   ENUM_TIMEFRAMES   timeframe;
   ENUM_PATTERN_TYPE type;
   datetime          detectionTime;
   datetime          labelTime;
   double            labelPrice;
   datetime          vertex1Time;
   double            vertex1Price;
   datetime          vertex2Time;
   double            vertex2Price;
   datetime          vertex3Time;
   double            vertex3Price;
   PatternResult(const string _s,const ENUM_TIMEFRAMES _tf,const ENUM_PATTERN_TYPE _t,
                 datetime lt,double lp,
                 datetime v1t,double v1p,
                 datetime v2t,double v2p,
                 datetime v3t,double v3p)
     : symbol(_s), timeframe(_tf), type(_t), detectionTime(TimeCurrent()),
       labelTime(lt), labelPrice(lp),
       vertex1Time(v1t), vertex1Price(v1p),
       vertex2Time(v2t), vertex2Price(v2p),
       vertex3Time(v3t), vertex3Price(v3p) {}
};
Detector Class Structure
At the core of the header is the CGeometricPatternDetector class. Its private section declares member variables for storing the pivot objects, configuration parameters (such as swing lookback, ATR multiplier, and minimum touch points), and the state needed to prevent duplicate drawings (names and hashes of the last triangle and rectangle, along with their detection times).
Four helper methods—IsNewBar, UpdateSwingPoints, CalculateATR, and GetSwingHash—are declared privately. These utilities handle the mechanics of identifying new bars, extracting swing pivots from recent high/low data, computing a market sensitivity measure via ATR, and generating a unique string key for each set of four pivots. Together, they support the two main public detection routines, DetectTriangle and DetectRectangle, as well as an Update method that ties everything together, plus GetLastPattern and ClearPatterns methods for retrieving results and cleaning up resources.
class CGeometricPatternDetector {
private:
   CArrayObj   m_swings;
   int         m_swingLookback;
   double      m_atrMultiplier;
   int         m_minTouchPoints;

   string      m_lastTriangle;
   string      m_lastSwingHash;
   datetime    m_lastTriangleTime;

   string      m_lastRectangle;
   string      m_lastRectangleHash;
   datetime    m_lastRectangleTime;

   bool    IsNewBar(const string sym,const ENUM_TIMEFRAMES tf);
   void    UpdateSwingPoints(const string sym,const ENUM_TIMEFRAMES tf);
   double  CalculateATR(const string sym,const ENUM_TIMEFRAMES tf,const int period=14);
   string  GetSwingHash(SwingPoint *p1,SwingPoint *p2,SwingPoint *p3,SwingPoint *p4);

public:
   CGeometricPatternDetector(int swingLookback=3,double atrMultiplier=1.5,int minTouchPoints=2);
   ~CGeometricPatternDetector();

   void Update(const string sym,const ENUM_TIMEFRAMES tf);
   void DetectTriangle(const string sym,const ENUM_TIMEFRAMES tf);
   void DetectRectangle(const string sym,const ENUM_TIMEFRAMES tf);
   ENUM_PATTERN_TYPE GetLastPattern();
   void ClearPatterns();

   CArrayObj m_currentPatterns;
};
Swing-Point Extraction
The swing-point extraction method, UpdateSwingPoints, is invoked on each new bar. It copies a window of highs, lows, and timestamps from the chart, then designates the central bar in that window as a swing high if its price exceeds both neighbors, or a swing low if its price is below both neighbors. Each confirmed pivot is wrapped in a SwingPoint object and appended to the m_swings array.
When the array grows beyond a fixed capacity, the oldest entries are discarded. This moving list of pivots forms the foundation for both triangle and rectangle detection, ensuring that only the most recent and significant market turns are considered.
void CGeometricPatternDetector::UpdateSwingPoints(const string sym,const ENUM_TIMEFRAMES tf)
{
   int bars = m_swingLookback*2 + 1;
   double highs[], lows[];
   datetime times[];
   ArraySetAsSeries(highs,true);
   ArraySetAsSeries(lows,true);
   ArraySetAsSeries(times,true);

   if(CopyHigh(sym,tf,0,bars,highs)<bars ||
      CopyLow(sym,tf,0,bars,lows)<bars   ||
      CopyTime(sym,tf,0,bars,times)<bars)
   {
      Print("Error: Failed to copy price/time data");
      return;
   }

   int mid = m_swingLookback;
   datetime t = times[mid];
   double h = highs[mid], l = lows[mid];

   bool isH = true;
   for(int i=1; i<=m_swingLookback; i++)
      if(h<=highs[mid-i] || h<=highs[mid+i]) { isH=false; break; }
   if(isH) {
      m_swings.Add(new SwingPoint(t,h,true));
      Print("Swing High detected at ",TimeToString(t)," Price: ",h);
   }

   bool isL = true;
   for(int i=1; i<=m_swingLookback; i++)
      if(l>=lows[mid-i] || l>=lows[mid+i]) { isL=false; break; }
   if(isL) {
      m_swings.Add(new SwingPoint(t,l,false));
      Print("Swing Low detected at ",TimeToString(t)," Price: ",l);
   }

   while(m_swings.Total()>50) {
      delete (SwingPoint*)m_swings.At(0);
      m_swings.Delete(0);
   }
}
CalculateATR wraps MQL5’s built‐in ATR indicator to provide a market‐sensitive magnitude unit, while GetSwingHash concatenates four pivot times and prices into a string key. The ATR value scales tolerances for both “flatness” in triangles and alignment in rectangles. The hash string ensures each unique pivot set is only drawn once per lockout period.
double CGeometricPatternDetector::CalculateATR(const string sym,const ENUM_TIMEFRAMES tf,const int period)
{
   int h = iATR(sym,tf,period);
   if(h==INVALID_HANDLE) { Print("ATR handle error"); return 0; }
   double buf[]; ArraySetAsSeries(buf,true);
   if(CopyBuffer(h,0,0,1,buf)!=1) { Print("ATR copy error"); return 0; }
   return buf[0];
}

string CGeometricPatternDetector::GetSwingHash(SwingPoint *p1,SwingPoint *p2,SwingPoint *p3,SwingPoint *p4)
{
   return TimeToString(p1.time)+"*"+DoubleToString(p1.price,8)+"*"
        + TimeToString(p2.time)+"*"+DoubleToString(p2.price,8)+"*"
        + TimeToString(p3.time)+"*"+DoubleToString(p3.price,8)+"*"
        + TimeToString(p4.time)+"_"+DoubleToString(p4.price,8);
}
Triangle Detection Logic
The triangle detection routine strictly looks for four consecutive swings in the order low to high and low to high. After enforcing a minimum bar span for each leg, it calculates the slopes of the lower and upper sides by dividing price differences by time differences. An ATR-based tolerance determines whether the top or bottom of the triangle is sufficiently level to qualify as descending or ascending; if neither side is flat enough, the pattern is classified as symmetrical.
The two side-lines are then analytically intersected to find the triangle’s apex in future time. A single OBJ_TRIANGLE object is drawn using the two pivot points and the computed apex, and a PatternResult object is created and stored. To prevent flicker, the detector compares a hash of the four pivots to the last drawn pattern and locks out redraws of the same shape for a fixed number of bars.
void CGeometricPatternDetector::DetectTriangle(const string sym,const ENUM_TIMEFRAMES tf)
{
   int tot = m_swings.Total();
   if(tot < 4) return;
   ulong barSec = PeriodSeconds(tf);
   ulong minSpan = (ulong)m_swingLookback * barSec;

   for(int i=0; i<=tot-4; i++)
   {
      SwingPoint *p1 = (SwingPoint*)m_swings.At(i);
      SwingPoint *p2 = (SwingPoint*)m_swings.At(i+1);
      SwingPoint *p3 = (SwingPoint*)m_swings.At(i+2);
      SwingPoint *p4 = (SwingPoint*)m_swings.At(i+3);

      if(!( !p1.isHigh && p2.isHigh && !p3.isHigh && p4.isHigh )) continue;
      if((ulong)(p2.time-p1.time)<minSpan ||
         (ulong)(p3.time-p2.time)<minSpan ||
         (ulong)(p4.time-p3.time)<minSpan) continue;

      double m_low  = (p3.price - p1.price) / double(p3.time - p1.time);
      double m_high = (p4.price - p2.price) / double(p4.time - p2.time);
      double tolFlat = CalculateATR(sym,tf,14) * m_atrMultiplier;

      bool lowerFlat = MathAbs(p3.price-p1.price) < tolFlat;
      bool upperFlat = MathAbs(p4.price-p2.price) < tolFlat;

      ENUM_PATTERN_TYPE type;
      if(lowerFlat && m_high < 0)             type = PATTERN_TRIANGLE_DESCENDING;
      else if(upperFlat && m_low > 0)         type = PATTERN_TRIANGLE_ASCENDING;
      else                                    type = PATTERN_TRIANGLE_SYMMETRICAL;

      double denom = m_low - m_high;
      if(MathAbs(denom)<1e-12) continue;
      double num = (p2.price - p1.price) + (m_low*p1.time - m_high*p2.time);
      double tx  = num/denom;
      double px  = p1.price + m_low*(tx-p1.time);

      datetime latest = MathMax(p1.time,p2.time);
      if(tx<=latest || tx>TimeCurrent()+barSec*50) continue;

      if(StringLen(m_lastTriangle)>0)
         ObjectDelete(0,m_lastTriangle);

      string base = "GPD_"+sym+"_"+EnumToString(tf)+"_"+TimeToString(TimeCurrent(),TIME_SECONDS);
      long cid    = ChartID();
      m_lastTriangle = base+"_T";

      ObjectCreate(cid,m_lastTriangle,OBJ_TRIANGLE,0,
                   p1.time,p1.price,
                   p2.time,p2.price,
                   tx,      px);
      ObjectSetInteger(cid,m_lastTriangle,OBJPROP_COLOR,clrOrange);
      ObjectSetInteger(cid,m_lastTriangle,OBJPROP_WIDTH,2);
      ObjectSetInteger(cid,m_lastTriangle,OBJPROP_FILL,false);

      m_lastSwingHash    = GetSwingHash(p1,p2,p3,p4);
      m_lastTriangleTime = TimeCurrent();
      m_currentPatterns.Add(new PatternResult(
         sym,tf,type,
         latest,(p2.price+p4.price)/2.0,
         p1.time,p1.price,
         p2.time,p2.price,
         (datetime)tx,px
      ));

      ChartRedraw(cid);
      break;
   }
}
Rectangle Detection Logic
Rectangle detection follows a similar pivot sequence but applies more stringent constraints. It first identifies four swings in the same low-high to low-high pattern, requiring each swing (low to high and the second low to high) to span at least five bars and exceed an ATR-scaled magnitude threshold. The bottom of the rectangle is aligned to the average of the two lows, provided they lie within ATR tolerance. If the two highs also align within that tolerance, the top is set to their average; otherwise, a minimal height equal to one ATR unit is used, so the rectangle remains visible.
The rectangle is drawn using OBJ_RECTANGLE, spanning from the earliest pivot time to exactly twenty bars later, preventing unbounded growth. A unique pivot hash ensures each distinct rectangle is drawn only once per lockout period, and its details are recorded in a PatternResult.
void CGeometricPatternDetector::DetectRectangle(const string sym,const ENUM_TIMEFRAMES tf)
{
   int tot = m_swings.Total();
   if(tot < 4) return;

   ulong barSec    = PeriodSeconds(tf);
   ulong minSpan5  = 5 * barSec;
   double tolATR   = CalculateATR(sym,tf,14) * m_atrMultiplier;

   for(int i=0; i<=tot-4; i++)
   {
      SwingPoint *a = (SwingPoint*)m_swings.At(i);
      SwingPoint *b = (SwingPoint*)m_swings.At(i+1);
      SwingPoint *c = (SwingPoint*)m_swings.At(i+2);
      SwingPoint *d = (SwingPoint*)m_swings.At(i+3);

      if(!( !a.isHigh && b.isHigh && !c.isHigh && d.isHigh )) continue;
      if((ulong)(b.time - a.time) < minSpan5 ||
         (ulong)(d.time - c.time) < minSpan5) continue;
      if(MathAbs(b.price - a.price) < tolATR ||
         MathAbs(d.price - c.price) < tolATR) continue;
      if(MathAbs(a.price - c.price) > tolATR) continue;

      bool highAligned = MathAbs(b.price - d.price) < tolATR;
      double lowP  = (a.price + c.price) / 2.0;
      double highP = highAligned ? (b.price + d.price)/2.0 : lowP + tolATR;

      datetime leftT  = MathMin(a.time, c.time);
      datetime rightT = leftT + (datetime)(20 * barSec);

      string rh = TimeToString(leftT,TIME_SECONDS) + "_" +
                  DoubleToString(lowP,8) + "_" +
                  DoubleToString(highP,8);
      datetime lockT = m_lastRectangleTime + (datetime)(40 * barSec);
      if(rh == m_lastRectangleHash && TimeCurrent() < lockT) return;

      if(StringLen(m_lastRectangle) > 0)
         ObjectDelete(0,m_lastRectangle);

      string base = "GPD_"+sym+"_"+EnumToString(tf)+"_"+TimeToString(TimeCurrent(),TIME_SECONDS);
      long cid    = ChartID();
      m_lastRectangle = base+"_Rect";

      ObjectCreate(cid,m_lastRectangle,OBJ_RECTANGLE,0,
                   leftT,   highP,
                   rightT,  lowP);
      ObjectSetInteger(cid,m_lastRectangle,OBJPROP_COLOR, clrBlue);
      ObjectSetInteger(cid,m_lastRectangle,OBJPROP_WIDTH, 2);
      ObjectSetInteger(cid,m_lastRectangle,OBJPROP_FILL,  false);

      m_currentPatterns.Add(new PatternResult(
         sym,tf,PATTERN_RECTANGLE,
         leftT,(highP+lowP)/2.0,
         leftT,highP,
         leftT,lowP,
         rightT,lowP
      ));
      m_lastRectangleHash = rh;
      m_lastRectangleTime = TimeCurrent();

      ChartRedraw(cid);
      break;
   }
}
Using the Header in an Expert Advisor
Integrating this header into an Expert Advisor is straightforward. We simply include it, instantiate a CGeometricPatternDetector with our preferred parameters, and call its Update(Symbol(), _Period) method in the OnTick event handler. After each update, GetLastPattern reveals whether a new triangle or rectangle has been detected, and you can inspect detector.m_currentPatterns to retrieve full details, issue alerts, or place chart labels.
The EA does not need to know any of the underlying geometry or pivot logic; it simply drives the detector and reacts to high-level results. This separation—declaration in the header, detailed implementation in the same file, and simple usage in the EA—demonstrates how object-oriented design in MQL5 encapsulates complexity and produces reusable, maintainable code. Let’s go through the detailed steps below.
Header Includes and Global State
At the very top of GeometryAnalyzerEA.mq5, we include our detector header so that the Expert Advisor can access the CGeometricPatternDetector class and its supporting types. Immediately after, we instantiate a single detector object with chosen parameters—three bars lookback for pivots, an ATR multiplier of 1.5 for tolerance, and two minimum touchpoints for patterns. We also declare three global variables: lastAlerted remembers the type of the last pattern we alerted so we do not repeat it on the same bar, lastBarTime tracks when a new bar arrives, and lastLabelName holds the name of the text label we placed so that it can be deleted when a new pattern appears.
#include <GeometricPatternDetector.mqh>

//–– detector instance & state
CGeometricPatternDetector  detector(3, 1.5, 2);
ENUM_PATTERN_TYPE          lastAlerted    = PATTERN_NONE;
datetime                   lastBarTime    = 0;
string                     lastLabelName  = "";
Initialization and Cleanup
The OnInit function runs once when the EA starts. Here we simply print a message to confirm initialization, though you could also start a timer or allocate resources if needed. Conversely, OnDeinit executes when the EA is removed or the chart is closed. In that routine, we clear all drawn patterns via detector.ClearPatterns() and delete any lingering text label by name. Finally, we log the deinitialization reason, making it easier to diagnose why the EA stopped.
int OnInit()
{
   Print("GeometryAnalyzerEA initialized");
   return(INIT_SUCCEEDED);
}

void OnDeinit(const int reason)
{
   detector.ClearPatterns();
   if(StringLen(lastLabelName) > 0)
      ObjectDelete(0, lastLabelName);
   Print("GeometryAnalyzerEA deinitialized, reason=", reason);
}
Detecting a New Bar
Inside OnTick, the first step is to determine whether the incoming tick belongs to a newly formed bar. We fetch the current bar’s open time and compare it to our stored lastBarTime. If the bar is new, we reset lastAlerted so that patterns will trigger again and delete the previous text label to keep the chart clean. If the bar is not new, we simply return and do nothing else, ensuring pattern detection runs only once per bar.
void OnTick()
{
   datetime curBar = iTime(Symbol(), _Period, 0);
   bool isNewBar  = (curBar != lastBarTime);
   if(isNewBar)
   {
      lastBarTime = curBar;
      lastAlerted = PATTERN_NONE;
      if(StringLen(lastLabelName) > 0)
      {
         ObjectDelete(0, lastLabelName);
         lastLabelName = "";
      }
   }
   if(!isNewBar)
      return;
   // …
}
Running the Detector
Once we have confirmed a new bar, we call the detector’s Update method, passing in the current symbol and timeframe. This single call updates swing points and executes both the triangle and rectangle detection routines under the hood. After Update returns, we query GetLastPattern() to see whether a valid pattern was found on this bar. If no new pattern appears, or if it matches the one we already alerted, we exit early.
detector.Update(Symbol(), _Period);

ENUM_PATTERN_TYPE pattern = detector.GetLastPattern();
if(pattern == PATTERN_NONE || pattern == lastAlerted)
   return;
lastAlerted = pattern;
Handling a Detected Pattern
If a new pattern appears, we retrieve the most recent PatternResult from the detector’s pattern array. We then translate the pattern enum into a human-readable name and format its vertices for logging. Rectangles receive special handling because they only supply three corner points; we approximate the fourth to present a complete set of coordinates. We issue both an Alert pop-up and a Print statement, showing the pattern name, time, price, and corner coordinates.
int count = detector.m_currentPatterns.Total();
PatternResult *pr = (PatternResult*)detector.m_currentPatterns.At(count - 1);

string name = (pattern == PATTERN_RECTANGLE) ? "Rectangle" :
              (pattern == PATTERN_TRIANGLE_ASCENDING)   ? "Ascending Triangle" :
              (pattern == PATTERN_TRIANGLE_DESCENDING)  ? "Descending Triangle" :
                                                         "Symmetrical Triangle";

Alert("GeometryAnalyzerEA: Detected ", name, " on ", Symbol(), " ", EnumToString(_Period));
Print("GeometryAnalyzerEA: ", name,
      " @", TimeToString(pr.labelTime, TIME_SECONDS),
      " Price=", pr.labelPrice);
Drawing Labels
Finally, we place a text label on the chart at the pattern’s designated time and price. A unique object name is generated by combining the pattern name with the label time. Using chart‐object functions, we draw OBJ_TEXT and set its properties—text content, color, font size, and background—so it stands out clearly on the chart. We record the last label name so that it can be removed on the next new bar before drawing a fresh label. A call to redraw the chart ensures immediate rendering.
   lastLabelName = name + "_" + TimeToString(pr.labelTime, TIME_SECONDS);
   long chartId = ChartID();
   if(ObjectCreate(chartId, lastLabelName, OBJ_TEXT, 0, pr.labelTime, pr.labelPrice))
   {
      ObjectSetString(chartId, lastLabelName, OBJPROP_TEXT,     name);
      ObjectSetInteger(chartId, lastLabelName, OBJPROP_COLOR,    clrOrangeRed);
      ObjectSetInteger(chartId, lastLabelName, OBJPROP_FONTSIZE, 12);
      ObjectSetInteger(chartId, lastLabelName, OBJPROP_BACK,     true);
   }
   ChartRedraw(chartId);
}
Testing And Results
To quickly evaluate the EA’s performance, we used the Strategy Tester to preview its behavior on historical data. The results were promising, with patterns being correctly detected and shapes drawn as expected. Additionally, I had the opportunity to observe the EA running on a live chart, where it performed remarkably well. Pattern signals were triggered seamlessly alongside real-time shape rendering, confirming the robustness of the integration. Now, take a look at the presentation below.
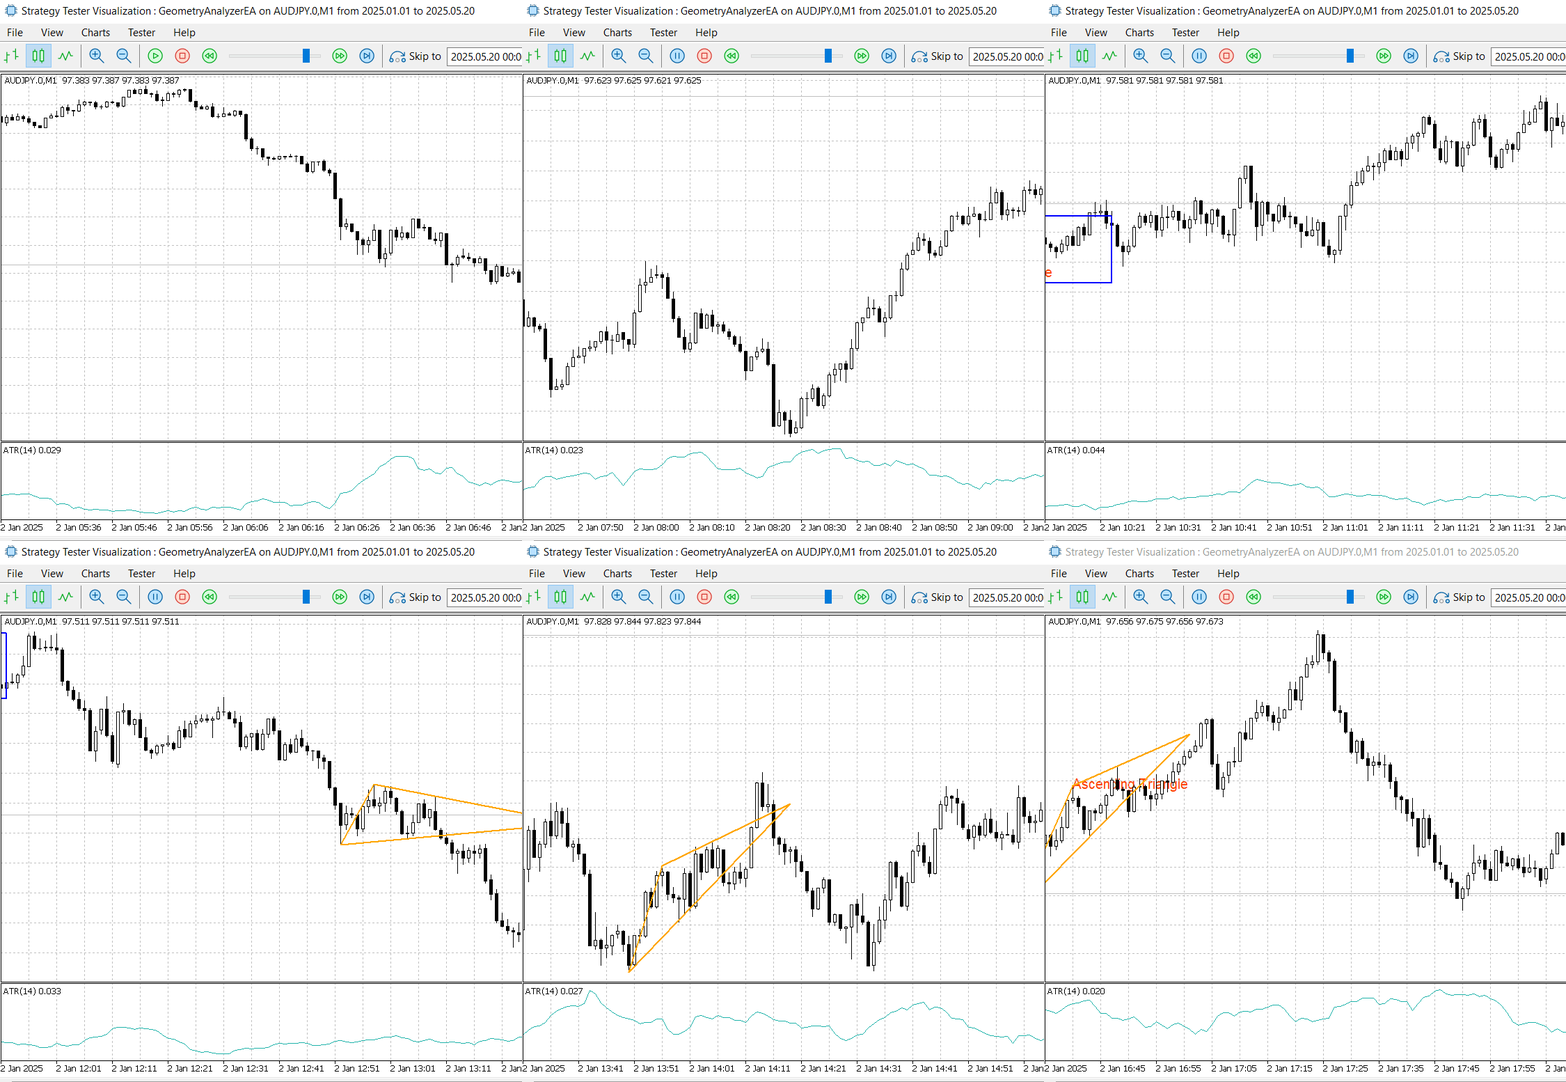
Strategy Tester Visualization: GeometricAnalyzerEA
Below is a log showing the detection of an ascending triangle during testing.
2025.05.20 13:40:54.241 2025.01.14 18:45:00   Alert: GeometryAnalyzerEA: Detected Ascending Triangle on AUDJPY.0 PERIOD_M1
2025.05.20 13:40:54.241 2025.01.14 18:45:00   GeometryAnalyzerEA: Ascending Triangle @14:03:00 Price=97.45599999999999 → Vertices: (1736863200@97.381), (1736863380@97.448), (1736873819@97.912)
2025.05.20 13:40:54.242 2025.01.14 18:46:00   Swing High detected at 2025.01.14 18:43 Price: 97.789
Conclusion
To conclude, we successfully used MQL5 to develop an automated system capable of detecting triangle and rectangle market structures. These geometric patterns, long recognized in technical analysis, provide meaningful insights into market behavior—especially in identifying potential continuation or reversal zones. By focusing on well-defined shapes like ascending triangles and rectangles, we demonstrate how geometry can translate price movements into visual, algorithmic structures that are both actionable and reliable.
The approach we implemented lays a strong foundation for building more complex analytical systems. The GeometricPatternDetector class is modular and reusable—it can be integrated into other projects and extended for improved detection accuracy and flexibility.
Although our system accurately draws the shapes on the chart, there is room for refining the structure detection logic to handle edge cases and improve pattern recognition precision. This project demonstrates how algorithmic approaches can simplify the detection of complex market patterns, streamlining what would otherwise be a very intricate manual process.
This journey has been one of continuous learning. Along the way, we've seen how class-based development in MQL5 not only enhances modularity but also promotes code reuse and interface abstraction. This allows other developers—or even end users—to work with a clean, high-level interface without needing to understand the low-level detection logic.
For those of us who build such systems, mastering the internal implementation is essential. But thanks to the encapsulated design, others can still benefit from the functionality without delving into the underlying code. With this structure in place, we can now confidently develop and extend the system to detect any market pattern by simply designing appropriate classes.
The next logical advancement would be to integrate order execution logic based on confirmed patterns—such as executing buy orders upon breakout from an ascending triangle, placing stop-losses at recent swing points, and setting dynamic take-profits using the pattern's height. More advanced enhancements could include confirming patterns with volume or oscillator indicators, applying multi-timeframe analysis for validation, and implementing a ranking system to prioritize high-quality setups.
Attachments:
| File | Description |
|---|---|
| GeometricPatternDetector.mqh | This header file contains the full class-based implementation of the geometric pattern detection logic. It defines data structures for swing points and pattern results, manages swing point detection, calculates market sensitivity using ATR, and includes routines for identifying triangles and rectangles. The file is designed for modular integration into Expert Advisors. |
| GeometryAnalyzerEA.mq5 | This Expert Advisor demonstrates the practical use of the pattern detection header. It initializes and updates the `CGeometricPatternDetector` class on each new bar, fetches pattern results, and visually annotates detected patterns on the chart. It serves as a simple, real-world example of integrating object-oriented pattern recognition into a trading strategy. |
 Neural Networks in Trading: Transformer with Relative Encoding
 From Basic to Intermediate: Array (I)
 Building MQL5-Like Trade Classes in Python for MetaTrader 5
 Price Action Analysis Toolkit Development (Part 24): Price Action Quantification Analysis Tool
- Free trading apps
- Over 8,000 signals for copying
- Economic news for exploring financial markets
You agree to website policy and terms of use