Category Theory in MQL5 (Part 16): Functors with Multi-Layer Perceptrons
Introduction
These series this far have shown how some foundational concepts in category theory can be represented and used in MQL5 code to help traders develop more robust trade systems. There are many facets to the subject of Category Theory but arguably the two lynch pin ones could be functors and natural transformations. So, by dwelling on functors again (like in our two previous articles) we are highlighting one of the capstone ideas of the subject.
This article’s focus though, even if we are still sticking to functors as per the last, will explore applications in generation of entry and exit signals unlike in the past when we focused on only the adjustment of the trailing stop. This again does not mean a grail is in the attached code, but rather an idea that should be improved and modified by the reader depending on how he sees the markets.
Recap: Functors and Graphs in MQL5
Functors are a mapping between categories that capture relationships not just across the objects in the two categories, but also across the morphisms of those categories. This has meant we have implemented them in code as either one of these two mappings, when making forecasts because effectively the mapping across the objects checks that across the morphisms and vice versa.
Graphs that can be viewed as a representation of interconnected systems with arrows and vertices were introduced to the series in article 11. In our last article though we illustrated them with economic calendar data availed by MetaQuotes via the MetaTrader 5 Terminal and used a simple hypothesis that links 4 different data points that form part of a time series. This graph as was shown in the article is effectively a category in its own right.
The functors looked at in our last article though, mapped two categories by a simple linear equation. There were options in the code shared to scale this up to a quadratic equation however these were not implemented in the testing undertaken for that article. So, the functor’s mapping essentially took an object’s value in the domain category, multiplied it by a coefficient and added a constant to get the object value in the codomain. It was linear since the coefficient and the constant were effectively the slope and y intercept of a simple linear equation.
Category Theory Functors from Economic Calendar Data
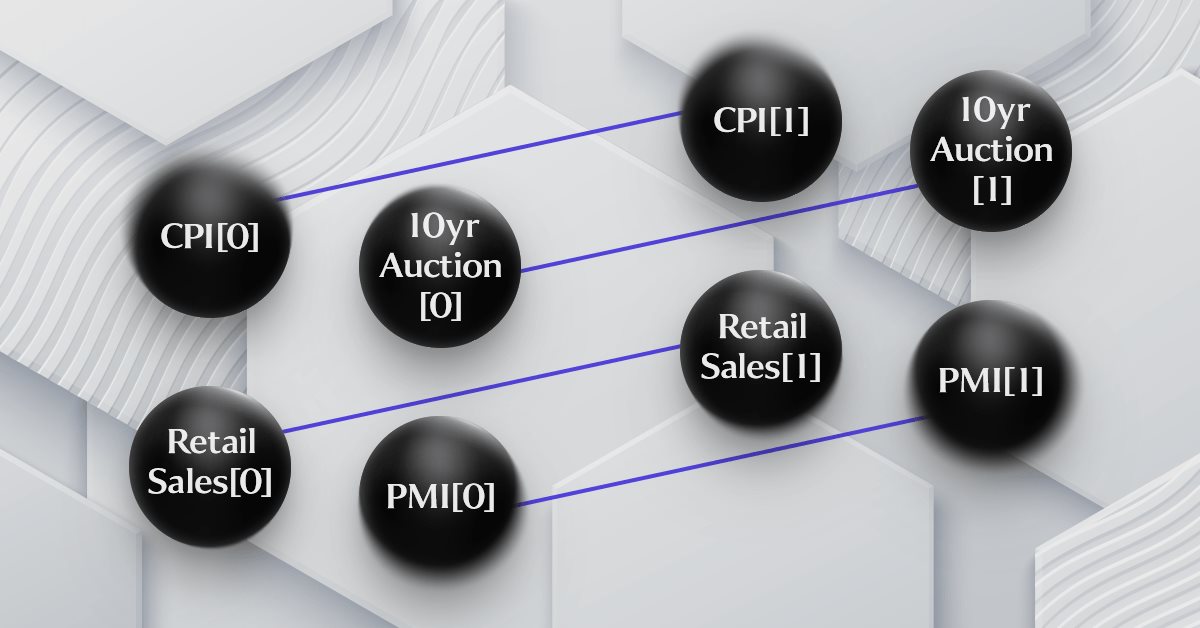
The reformatting of economic calendar data as a category achieved via the use of graphs, was suitable given the complex interconnectedness of the calendar data. As can be seen from the calendar tab in the MetaTrader 5 terminal there is a plethora of different types of economic data. This problem was stressed in a prior article, where the need to pair this data, since it is currency specific, in making trade decisions for a currency pair can be difficult. For the intended security though in the last article and this one there is no need to pair the data but still the notion that some of this data is dependent on other economic data is something that should be put into consideration especially given wide reaching significance of our security, the S&P 500. So, to address this we had come up with a simple hypothesis in the last article that CPI print is dependent on PMI print which in turn depends on the latest 10yr auction yields that are in turn influenced by retail sales. Therefore, rather than had a time series of just one of these economic data points, we have a series of multiple points forming a basis to S&P 500 volatility.
For this article though, we are more interested in the S&P 500 not just for its volatility as was the case in the last article(s), but its trends. We are looking to make forecasts on its short-term (monthly) trends and using those projections to open positions in our expert advisor. This means we will be dealing with the Expert Signal class and not the Expert Trailing class as has been the case so far in the series. So, implementing functor-based transformations on the graph of economic calendar data will result in the projected change in the S&P 500. This implementation will be achieved with the help of a multi-layer perceptron.
We did have a schematic representation of our simple hypothesis in the last article that links the four economic data points under consideration, however it was overly simplified and did not show it as a time series graph. The diagram below tries to achieve this:

As you can see from the diagram, the addition of time series objects does add some complexity which clearly supports the case for this being a graph. The hypothesis on which this is based is debatable as one may for instance argue CPI is a result of retail sales, which in turn are influenced by PMI, which would be set by money supply as measured off the 10yr auction performance. And so on. There are even a number of other permutations with different or more economic data points that perhaps would be more critical in influencing the forecast delta of the S&P 500. The good news is despite all these possible permutations and hypothesis, strategy tester in the terminal can put all these arguments to rest which is why it’s helpful to have your ideas clearly laid out in a format that can efficiently be tested.
To help with this the MQL5 wizard allows easy assembly of an expert advisor via a few clicks when all one has coded is a signal file.
Category Theory Functors for S&P 500 Index Values
Within the signal file, representing the S&P 500 index values as a graph amounts to a category because as shared in the last article each graph-vertex (data point) is equivalent to an object and thus the arrows between the vertices can be taken as morphisms. An object can have one element, but in this case the data point includes more than just the value we are interested in as extra data not considered for our category includes: the date economic data was released, consensus forecasts for that data leading up to its release, and other data all listed in the calendar tab in MetaTrader terminal. This link leads to a page with calendar event types and each attribute enumerated would be applicable to our object. All this data would then form an object or what we referred to as a set, in the economic calendar category.
The utilization of functors to analyze and preprocess historical economic calendar data can unfortunately only be done in strategy tester via a third party and not directly from MetaQuotes’ server(s). This is certainly a bottle neck one we have addressed by exporting the data to a csv by script and then reading that csv in strategy tester as in prior article. The difference here is we are doing it for an instance of the Expert Signal class and not the trailing class. Since we are dealing with two functors the script used wrote two files on prefixed 'true' meaning the functor is across objects and another prefixed 'false' meaning it is across the morphisms. The written files are attached at the end of the article.
A Graph-based representation of transformed S&P 500 index values has been shared in a diagram above.
Functor-Based Neural Network Architecture
Functors as multi-layer perceptrons (neural-nets) in this article is a step up from the previous linear or quadratic relationship we had used when mapping across categories, and even objects within a category (because a morphism relationship between two elements can be defined in the same way). As emphasized previously the use of functors implies mapping not just across the objects in the two categories but also across their respective morphisms. So, one can check the other i.e. if you know the objects in the codomain category, then the morphisms are implied and vice versa. This means we will be dealing with two perceptrons between our categories.
This article will also not provide a primer on perceptrons as there are already plenty of articles, not just amongst those published on this website, but also online in general so the curious reader is invited to do his own background research if it will help in clarifying what is presented here. The network architecture implemented here is thanks in large part to the Alglib which is accessible in MetaTrader’s IDE under the ‘Include\Math’ folder. And this is how an initialization of a perceptron in performed using the library:
//+------------------------------------------------------------------+
//|   Function to train Perceptron.                                  |
//+------------------------------------------------------------------+
bool CSignalCT::Train(CMultilayerPerceptron &MLP)
   {
      CMLPBase _base;
      CMLPTrain _train;

      if(!ReadPerceptron(m_training_profit))
      {
         _base.MLPCreate1(__INPUTS,m_hidden,__OUTPUTS,MLP);
         m_training_profit=0.0;
      }
      else
      {
         printf(__FUNCSIG__+" read perceptron, with profit: "+DoubleToString(m_training_profit));
      }

      ...

      return(false);
   }
The perceptrons used from this library are very basic and they comprise three layers. An input layer, a hidden layer, and an output layer. Our economic data category has four data points at a time (based off our hypothesis) so the number of inputs in the hidden layer will be four. The number of points on the hidden layer will be one of the few optimizable parameters but our default is seven. Then finally there will be one output in the output layer which will be the forecast change in S&P 500 index. Knowledge of weights, biases, and Activation functions is key in understanding feed forward workings of perceptrons. Once again, the reader is invited to do his research on these as necessary.
Training the Functor-Based Neural Network
The training process on historical economic calendar data will be done using the Levenberg-Marquardt algorithm. The coding for this is, like with the feedforward and backpropagation, handled by AlgLib functions. We would implement a training with from the library as follows:
      int _info=0;
      CMatrixDouble _xy;
      CMLPReport _report;
      TrainingLoad(m_training_stop,_xy,m_training_points,m_testing_points);
      //
      if(m_training_points>0)
      {
         _train.MLPTrainLM(MLP,_xy,m_training_points,m_decay,m_restarts,_info,_report);

         if(_info>0){ return(true); }
      }
The key portion here is populating the XY matrix with input data from a csv file in the common directory. The matrix fetches the four data points defined on each data-row as historical data, whenever a new bar is generated (or on timer) and uses it to train the network so as to generate its weights and biases. The population of XY input matrix will be handled by the ‘TrainingLoad’ function as shown below:
//+------------------------------------------------------------------+
//|   Function Get Training Points and Initialize Training Matrix.   |
//+------------------------------------------------------------------+
void CSignalCT::TrainingLoad(datetime Date,CMatrixDouble &XY,int &TrainingPoints,int &TestingPoints)
   {
      TrainingPoints=0;
      TestingPoints=0;

      ResetLastError();
      string _file="_s_"+m_currency+"_"+m_symbol.Name()+"_"+EnumToString(m_period)+"_"+string(m_objects)+".csv";
      int _handle=FileOpen(_file,FILE_SHARE_READ|FILE_ANSI|FILE_COMMON,"\n",CP_ACP);

      if(_handle!=INVALID_HANDLE)
      {
         string _line="";
         int _line_length=0;

         while(!FileIsLineEnding(_handle))
         {
            //--- find out how many characters are used for writing the line
            _line_length=FileReadInteger(_handle,INT_VALUE);
            //--- read the line
            _line=FileReadString(_handle,_line_length);

            string _values[];
            ushort _separator=StringGetCharacter(",",0);
            if(StringSplit(_line,_separator,_values)==6)
            {
               datetime _date=StringToTime(_values[0]);

               _d_economic.Let(); _d_economic.Cardinality(4);

               //printf(__FUNCSIG__+" initializing for: "+TimeToString(Date)+" at: "+TimeToString(_date));

               if(_date<Date)
               {
                  TrainingPoints++;
                  //
                  XY.Resize(TrainingPoints,__INPUTS+__OUTPUTS);

                  for(int i=0;i<__INPUTS;i++)
                  {
                     XY[TrainingPoints-1].Set(i,StringToDouble(_values[i+1]));
                  }
                  //
                  XY[TrainingPoints-1].Set(__INPUTS,StringToDouble(_values[__INPUTS+1]));
               }
               else
               {
                  TestingPoints++;
               }
            }
         }

         FileClose(_handle);
      }
      else
      {
         printf(__FUNCSIG__+" failed to load file. Err: "+IntegerToString(GetLastError()));
      }
   }
Worth noting is after training, reason why neural networks work and are popular is in their ability to develop and re-use weights and biases. For this article the storage of these weights and biases is handled by a custom function that the author is not comfortable sharing at this time, so its reference as an ex5 library will be present in the listing but its code will not.
Typically, when training a network there is data preprocessing involved that looks at normalizing the data to comparable values, and splitting it into training and testing sets. For our purposes though we are training the loaded history set of data at initialization of the expert and then testing it using a separate portion of the csv data whose split from the training data is defined by an input date. Since our only optimizable parameter will be the number of weights in the hidden layer (from 5 to 12), we write the trained weights of the network to a file in the common directory and at the end of each optimization pass, only and only if the optimization criteria from that pass exceeds that of the already written file in an earlier pass. If this is achieved and a file is written then on the initialization of the network on the next pass, the initial weights will be those written from that file.
Backpropagation and gradient descent are all handled by the ‘MLPTrainLM’ function which is within the ‘CMLPTrain’ class of AlgLib.
Trade Signal Generation using Functors and Neural Networks
The S&P 500 category that is a linear order of changes in the index forms a codomain to our ‘two’ functors from the economic calendar data category. To recap there are ‘two’ because the objects and morphisms are both linked. So, our signal on the test period defined by the input date read off the csv file, will be generated by the weights got at the end of each training. Training for the code attached to this article, occurs on each initialization of the expert. Attached is a signal file which like the trailing files that were attached in previous articles, can be used once assembled in the MQL5 wizard via MetaEditor IDE. We could train additionally on the timer since each new bar provides a new data row for our csv file, however this approach is not explored in the article and the reader is invited to independently explore as it may quickly pick up more emergent signals.
Our ‘GetOutput’ function as in past articles will be responsible for getting the value from which we process our trade decision. As can be shown from the listing below, besides updating the categories with current values, network inputs are prepared based on the current calendar readings off the csv file in common directory and these are filled in the ‘_x_inputs’ array from which the array is forward fed to the network with the function ‘MLPProcess’ that is a part of the ‘CMLPBase’ class. This is listed below:
//+------------------------------------------------------------------+
//|   Get Output value, forecast for next change in price bar range. |
//+------------------------------------------------------------------+
double CSignalCT::GetOutput(datetime Date)
   {
      if(Date>=D'2023.07.01')
      {
         printf(__FUNCSIG__+" log profit: "+DoubleToString(m_training_profit)+", account profit: "+DoubleToString(m_account.Profit())+", equity: "+DoubleToString(m_account.Equity())+", deposit: "+DoubleToString(m_training_deposit));

         if(m_training_profit<m_account.Equity()-m_training_deposit)
         {
            printf(__FUNCSIG__+" perceptron write... ");
            m_training_profit=m_account.Equity()-m_training_deposit;

            WritePerceptron(m_training_profit,_MLP);
         }
      }

      ...

      _value="";_e.Let();_e.Cardinality(1);
      _d_economic.Get(3,_e);_e.Get(0,_value);
      _x_inputs[3]=StringToDouble(_value);//printf(__FUNCSIG__+" val 4: "+_value);

      //forward feed?...
      CMLPBase _base;
      _base.MLPProcess(_MLP,_x_inputs,_y_inputs);

      _output=_y_inputs[0];

      //printf(__FUNCSIG__+" output is: "+DoubleToString(_output));

      return(_output);
   }
There is also potential to incorporate risk management and position sizing in trade system that uses these methods that could involve sizing depending on the magnitude of the signal. This will certainly require normalization of the signal value and as always when changes to position sizing are involved extra caution needs to be exercised. These changes though would be achieved by creating a custom instance of the ‘ExpertMoney’ class in the same way that we are using a custom instance of the ‘ExpertSignal’ class in defining entry and exit points.
Back testing and Performance Evaluation
Our back testing will be an optimization for the ideal number of weights in the hidden layer. Since these range from 5 to 12 there are only eight options and yet we want to have multiple runs on each number of weights before selecting an ideal number. So, in order to have the multiple runs we add a parameter that does nothing to the performance of the expert but has to be optimized and therefore adds extra runs to the optimization process to allow each number of weights option achieve multiple test runs. As mentioned above at the end of each run if the test result is better than that of the last file written to the common folder then those weights replace the ones written previously. Out optimization criteria will be maximum profit. We make runs on the monthly time frame because the calendar economic data on average gets updated about as often. The test runs were from 2022-07-01 to 2023-08-01 for the S&P 500 on monthly timeframe and our best run for the object to object functor yielded the report below:

Similarly, our morphism to morphism functor yielded the below report:

Analysis of the reports’ key metrics on drawdown, and profit factor, picks the morphism to morphism functor as the better performer. Perhaps it’s the one worth looking into to develop further? This is a question that is based answered with further testing on not just alternate securities but by also using different training approaches when making test runs such as those that consider whether training should be done on each new bar or quarterly.
Conclusion
To summarize, the key findings from testing with perceptrons are a trade system could be developed with a signal such as the one presented in the signal file. In leading up to its development a suitable domain category with data in a format easily accessible to strategy tester needs to be available, and since reliable testing tends to span multiple years, this data needs to be extensive.
The significance of using multi-layer perceptrons as functors is not just a step up but a boon that has a lot of potential given the many types and formats neural networks can take. Hyperlinks on studying perceptrons further have been shared in the article but this is a well-known and documented subject therefore they only serve as pointers. A lot of concepts already covered from limits, colimits, and universal properties can all be formulated with the help of neural networks.
References
Wikipedia as per shared links.
Notes on Attachments
Do place the files 'SignalCT_16_.mqh' in the folder 'MQL5\include\Expert\Signal\' and the file 'ct_16.mqh' can be in 'MQL5\include\’ folder.
In addition, you may want to follow thisguideon how to assemble an Expert Advisor using the wizard since you would need to assemble them as part of an Expert Advisor. As stated in the article I used no trailing stop and fixed margin for money management both of which are part of MQL5's library. As always, the goal of the article is not to present you with a Grail but rather an idea which you can customize to your own strategy.- Free trading apps
- Over 8,000 signals for copying
- Economic news for exploring financial markets
You agree to website policy and terms of use