
The RSI Deep Three Move Trading Technique
1. Introduction
This article is based on a new series of studies that showcase a few trading techniques based on the RSI. A trading technique is a way to use an indicator. The study is based on mql5 coding language.
2. A Simple Introduction to the RSI
The RSI stands for Relative Strength Index, a technical analysis indicator used to measure the strength and momentum of a security, such as a stock, currency, or commodity. The RSI is calculated using mathematical formulas and plotted on a graph to visually represent the level of strength or weakness of a security over a given period.
The RSI is based on the principle that as prices rise, the security becomes overbought, and as prices fall, the security becomes oversold. The RSI helps traders to identify potential trend reversals or price corrections.
The RSI calculation involves comparing the average gain of the security over a given period to the average loss of the security over the same period. The default version of the RSI is then plotted on a scale of 0 to 100, with readings above 70 considered overbought, and readings below 30 considered oversold. The RSI is a popular indicator among traders because it can provide early warning signals of potential market trends. For example, if the RSI of a security is consistently rising and reaches a level above 70, it could indicate that the security is overbought and due for a correction. On the other hand, if the RSI is consistently falling and reaches a level below 30, it could indicate that the security is oversold and due for a bounce-back.
It’s worth noting that the RSI should not be used in isolation as a sole basis for making trading decisions. Traders typically use the RSI in conjunction with other technical analysis tools and market indicators to gain a more comprehensive understanding of the market conditions and make informed trading decisions. Generally, the RSI is calculated over a rolling period of 14.
3. What is RSI (A deeper description).
3.1 IntroductionThe relative strength index (RSI) is a technical indicator used in the analysis of financial markets. It is intended to chart the current and historical strength or weakness of a stock or market based on the closing prices of a recent trading period. The indicator should not be confused with relative strength.
The RSI is classified as a momentum oscillator, measuring the velocity and magnitude of price movements. Momentum is the rate of the rise or fall in price. The relative strength RS is given as the ratio of higher closes to lower closes. Concretely, one computes two averages of absolute values of closing price changes, i.e. two sums involving the sizes of candles in a candle chart. The RSI computes momentum as the ratio of higher closes to overall closes: stocks which have had more or stronger positive changes have a higher RSI than stocks which have had more or stronger negative changes.
The RSI is most typically used on a 14-day timeframe, measured on a scale from 0 to 100, with high and low levels marked at 70 and 30, respectively. Short or longer timeframes are used for alternately shorter or longer outlooks. High and low levels—80 and 20, or 90 and 10—occur less frequently but indicate stronger momentum.
The relative strength index was developed by J. Welles Wilder and published in a 1978 book, New Concepts in Technical Trading Systems, and in Commodities magazine (now Modern Trader magazine) in the June 1978 issue. It has become one of the most popular oscillator indices.
The RSI provides signals that tell investors to buy when the security or currency is oversold and to sell when it is overbought.
RSI with recommended parameters and its day-to-day optimization was tested and compared with other strategies in Marek and Šedivá (2017). The testing was randomised in time and companies (e.g., Apple, Exxon Mobil, IBM, Microsoft) and showed that RSI can still produce good results; however, in longer time it is usually overcome by the simple buy-and-hold strategy.
3.2 CalculationFor each trading period an upward change U or downward change D is calculated. Up periods are characterized by the close being higher than the previous close:
![]()
Conversely, a down period is characterized by the close being lower than the previous period's close,
![]()
If the last close is the same as the previous, both U and D are zero. Note that both U and D are positive numbers.
Averages are now calculated from sequences of such U and D, using an n-period smoothed or modified moving average (SMMA or MMA), which is the exponentially smoothed moving average with α = 1 / n. Those are positively weighted averages of those positive terms, and behave additively with respect to the partition.
Wilder originally formulated the calculation of the moving average as: newval = (prevval * (n - 1) + newdata) / n, which is equivalent to the aforementioned exponential smoothing. So new data is simply divided by n, or multiplied by α and previous average values are modified by (n - 1) / n, i.e. 1 - α. Some commercial packages, like AIQ, use a standard exponential moving average (EMA) as the average instead of Wilder's SMMA. The smoothed moving averages should be appropriately initialized with a simple moving average using the first n values in the price series.
The ratio of these averages is the relative strength or relative strength factor:
![]()
The relative strength factor is then converted to a relative strength index between 0 and 100:
![]()
If the average of U values is zero, both RS and RSI are also zero. If the average of U values equals the average of D values, the RS is 1 and RSI is 50. If the average of U values is maximal, so that the average of D values is zero, then the RS value diverges to infinity, while the RSI is 100.
3.3 Interpretation
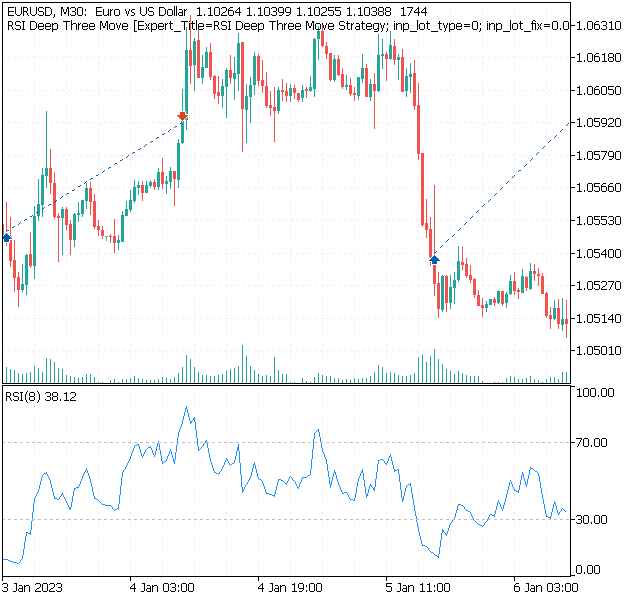
3.3.1 Base configurationThe RSI is presented on a graph above or below the price chart. The indicator has an upper line, typically at 70, a lower line at 30, and a dashed mid-line at 50. Wilder recommended a smoothing period of 14 (see exponential smoothing, i.e. α = 1/14 or N = 14).
3.3.2. Principles
Wilder posited that when price moves up very rapidly, at some point it is considered overbought. Likewise, when price falls very rapidly, at some point it is considered oversold. In either case, Wilder deemed a reaction or reversal imminent.
The level of the RSI is a measure of the stock's recent trading strength. The slope of the RSI is directly proportional to the velocity of a change in the trend. The distance traveled by the RSI is proportional to the magnitude of the move.
Wilder believed that tops and bottoms are indicated when RSI goes above 70 or drops below 30. Traditionally, RSI readings greater than the 70 level are considered to be in overbought territory, and RSI readings lower than the 30 level are considered to be in oversold territory. In between the 30 and 70 level is considered neutral, with the 50 level a sign of no trend.
3.3.3. Divergence
Wilder further believed that divergence between RSI and price action is a very strong indication that a market turning point is imminent. Bearish divergence occurs when price makes a new high but the RSI makes a lower high, thus failing to confirm. Bullish divergence occurs when price makes a new low but RSI makes a higher low.
3.3.4. Overbought and oversold conditionsWilder thought that "failure swings" above 50 and below 50 on the RSI are strong indications of market reversals. For example, assume the RSI hits 76, pulls back to 72, then rises to 77. If it falls below 72, Wilder would consider this a "failure swing" above 70.
Finally, Wilder wrote that chart formations and areas of support and resistance could sometimes be more easily seen on the RSI chart as opposed to the price chart. The center line for the relative strength index is 50, which is often seen as both the support and resistance line for the indicator.
If the relative strength index is below 50, it generally means that the stock's losses are greater than the gains. When the relative strength index is above 50, it generally means that the gains are greater than the losses.
3.3.5. Uptrends and downtrendsIn addition to Wilder's original theories of RSI interpretation, Andrew Cardwell has developed several new interpretations of RSI to help determine and confirm trend. First, Cardwell noticed that uptrends generally traded between RSI 40 and 80, while downtrends usually traded between RSI 60 and 20. Cardwell observed when securities change from uptrend to downtrend and vice versa, the RSI will undergo a "range shift."
Next, Cardwell noted that bearish divergence: 1) only occurs in uptrends, and 2) mostly only leads to a brief correction instead of a reversal in trend. Therefore, bearish divergence is a sign confirming an uptrend. Similarly, bullish divergence is a sign confirming a downtrend.
3.3.6. ReversalsFinally, Cardwell discovered the existence of positive and negative reversals in the RSI. Reversals are the opposite of divergence. For example, a positive reversal occurs when an uptrend price correction results in a higher low compared to the last price correction, while RSI results in a lower low compared to the prior correction. A negative reversal happens when a downtrend rally results in a lower high compared to the last downtrend rally, but RSI makes a higher high compared to the prior rally.
In other words, despite stronger momentum as seen by the higher high or lower low in the RSI, price could not make a higher high or lower low. This is evidence the main trend is about to resume. Cardwell noted that positive reversals only happen in uptrends while negative reversals only occur in downtrends, and therefore their existence confirms the trend.4. The RSI Deep Three Move
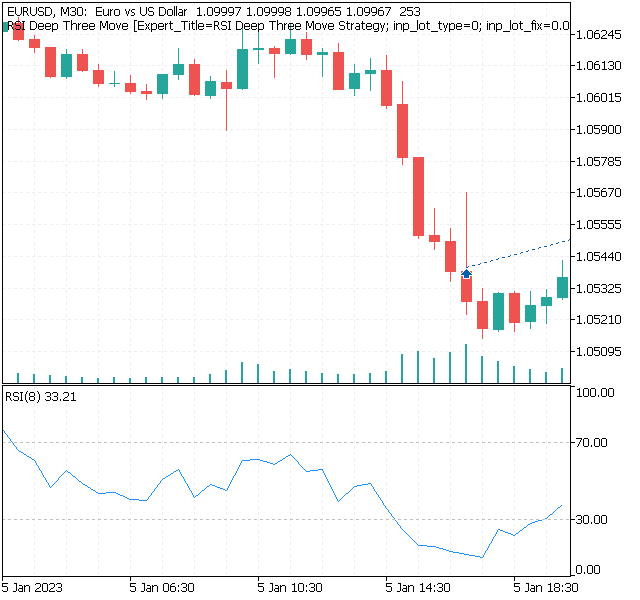
The deep three move techniques has an interesting hypothesis which states that generally whenever the RSI enters the oversold or overbought level and shapes three consecutive moves deeper while the fourth move being the confirmation (and must be also deeper), then a signal may be given. The trading conditions are as follows:
- A bullish signal is detected whenever the RSI is below the previous RSI which in turn is also below its previous RSI with the latter also below its prior RSI. As it’s generally used with 8-period RSI’s, the RSI three periods ago must be below 20 and the fourth period ago must be above 20 (to avoid duplicate signals).
-
A bearish signal is detected whenever the RSI is above the previous RSI which in turn is also above its previous RSI with the latter also above its prior RSI. As it’s generally used with 8-period RSI’s, the RSI three periods ago must be above 80 and the fourth period ago must be below 80 (to avoid duplicate signals).
A picture is worth a thousand words. The following Figure shows a bullish signal based on the technique:
5. Code
//+------------------------------------------------------------------+
//|                                          RSI Deep Three Move.mq5 |
//|                              Javier S. Gastón de Iriarte Cabrera |
//|              https://https://www.mql5.com/en/users/jsgaston/news |
//+------------------------------------------------------------------+
#property copyright "Javier S. Gastón de Iriarte Cabrera"
#property link      "https:/https://www.mql5.com/en/users/jsgaston/news"
#property version   "1.01"
#property script_show_inputs
#include <GetIndicatorBuffers.mqh>
#include <Trade\Trade.mqh>
#include <Trade\SymbolInfo.mqh>
#include <Trade\PositionInfo.mqh>


#include <Trade\AccountInfo.mqh>
//---
CPositionInfo  m_position;                                                         // object of CPositionInfo class
CTrade         m_trade;                                                            // object of CTrade class
CSymbolInfo    m_symbol;                                                           // object of CSymbolInfo class
CAccountInfo   m_account;                                                          // object of CAccountInfo class

CTrade  trade;
CTrade  Ctrade;

input string             Expert_Title             ="RSI Deep Three Move Strategy"; // Document name

enum ENUM_LOT_TYPE
  {
   LOT_TYPE_FIX   = 0,                                                             // fix lot
   LOT_TYPE_RISK  = 1,                                                             // risk %
  };
//--- input parameters

input ENUM_LOT_TYPE        inp_lot_type               = LOT_TYPE_FIX;              // type of lot

input double               inp_lot_fix                = 0.01;                      // fix lot
input double               inp_lot_risk               = 0.01;
input bool     InpPrintLog          = false;                                       // Print log
ulong                    Expert_MagicNumber       =11777;
bool                     Expert_EveryTick         =false;
input ENUM_TIMEFRAMES my_timeframe=PERIOD_CURRENT;                                 // Timeframe

input ENUM_APPLIED_PRICE   Inp_RSI_applied_price = PRICE_CLOSE;                    // RSI: type of price
input int InpPeriodRSI=8;                                                          // Period of the signal for the RSI inside custom
int    handle_iCustom;


input int ptsl = 5000;                                                             // points for stoploss
input int pttp = 5000;                                                             // points for takeprofit
string Orden;
double sl2;
double tp2;
This is a complicated piece of code written in MQL5 language. It is a trading strategy that uses the Relative Strength Index (RSI) to identify potential trading opportunities. The code includes the use of various classes such as CPositionInfo, CTrade, CSymbolInfo, and CAccountInfo. It also includes the use of various input parameters such as the type of lot, the fix lot, the risk percentage, the expert title, the magic number, the time frame, the RSI averaging period, the type of price, and the points for stop loss and take profit. The code also includes the use of variables such as handle_iRSI2, handle_iCustom, Orden, sl, and tp. The purpose of this code is to identify potential trading opportunities based on the RSI indicator.
//+------------------------------------------------------------------+
//| Expert initialization function                                   |
//+------------------------------------------------------------------+
int OnInit()
  {
//---
   handle_iCustom=iCustom(_Symbol,my_timeframe,"\\Indicators\\Examples\\RSI",InpPeriodRSI);

   if(handle_iCustom==INVALID_HANDLE)
     {
      //--- tell about the failure and output the error code
      PrintFormat("Failed to create handle of the iCustom indicator for the symbol %s/%s, error code %d",
                  _Symbol,
                  EnumToString(my_timeframe),
                  GetLastError());
      //--- the indicator is stopped early
      return(INIT_FAILED);
     }
//---
   return(INIT_SUCCEEDED);
  }
This code is part of an Expert initialization function in MQL5 language. It is used to create a handle for the iCustom indicator for a given symbol and timeframe. It also creates handles for the iRSI indicator with the given parameters. If the handle for the iCustom indicator fails to be created, an error message is printed and the indicator is stopped. If the handle is successfully created, the initialization is successful.
void OnTick()
  {
   MqlTick tick;
   double last_price = tick.ask;
   SymbolInfoTick(_Symbol,tick);
   int total = PositionsTotal();
//---
// Retrieve the current value
   MqlTradeResult  result;
   MqlRates rates[];
//---
   double array_rsi[];
   ArraySetAsSeries(array_rsi,true);
   int start_pos=0,count=5;
   if(!iGetArray(handle_iCustom,0,start_pos,count,array_rsi))
      return;
   string text="";
   for(int i=0; i<count; i++)
      text=text+IntegerToString(i)+": "+DoubleToString(array_rsi[i],Digits()+1)+"\n";
//---
   Comment(text);
     {
      if(array_rsi[0] < array_rsi[1] && array_rsi[1] < array_rsi[2] && array_rsi[2] < array_rsi[3] && array_rsi[3] < 20.0 && array_rsi[4] > 20.0)
        {
         Print("Open Order Buy");
         Alert(" Buying");
         Orden="Buy";
         sl=NormalizeDouble(tick.ask - ptsl*_Point,_Digits);
         tp=NormalizeDouble(tick.bid + pttp*_Point,_Digits);
         trade.PositionOpen(_Symbol,ORDER_TYPE_BUY,get_lot(tick.bid),tick.bid,sl,tp,"Buy");
         return;
        }
     }
     {
      if(array_rsi[0] > array_rsi[1] && array_rsi[1] > array_rsi[2] && array_rsi[2]  > array_rsi[3] && array_rsi[3] > 80.0 && array_rsi[4] < 80.0)
        {
         Print("Open Order Sell");
         Alert(" Selling");
         Orden="Sell";
         sl=NormalizeDouble(tick.bid + ptsl*_Point,_Digits);
         tp=NormalizeDouble(tick.ask - pttp*_Point,_Digits);
         trade.PositionOpen(_Symbol,ORDER_TYPE_SELL,get_lot(tick.ask),tick.ask,sl,tp,"Sell");
         return;
        }
     }
   if(total>0)
     {
      if(Orden=="Sell" && array_rsi2[0]<20.0)
        {
         trade.PositionClose(_Symbol,5);
         Print("cerró sell");
         return;
        }
      if(Orden=="Buy" && array_rsi2[0]>80.0)
        {
         trade.PositionClose(_Symbol,5);
         Print("cerró buy");
         return;
        }
     }
  }
This piece of code is an Expert Tick function in MQL5 language. It is used to open and close positions in the market. It first retrieves the current value of the symbol and stores it in the MqlTick tick variable. It then retrieves the total number of positions and stores it in the total variable. It then retrieves the RSI values from the iCustom function and stores it in the array_rsi and variable. It then checks if the RSI values are below 20 for a sell order and above 80 for a buy order, and if so, it opens the position with the corresponding parameters. Finally, it checks if the RSI values have crossed the 20 or 80 threshold, and if so, it closes the position.
bool iGetArray(const int handle,const int buffer,const int start_pos,
               const int count,double &arr_buffer[])
  {
   bool result=true;
   if(!ArrayIsDynamic(arr_buffer))
     {
      //if(InpPrintLog)
      PrintFormat("ERROR! EA: %s, FUNCTION: %s, this a no dynamic array!",__FILE__,__FUNCTION__);
      return(false);
     }
   ArrayFree(arr_buffer);
//--- reset error code
   ResetLastError();
//--- fill a part of the iBands array with values from the indicator buffer
   int copied=CopyBuffer(handle,buffer,start_pos,count,arr_buffer);
   if(copied!=count)
     {
      //--- if the copying fails, tell the error code
      //if(InpPrintLog)
      PrintFormat("ERROR! EA: %s, FUNCTION: %s, amount to copy: %d, copied: %d, error code %d",
                  __FILE__,__FUNCTION__,count,copied,GetLastError());
      //--- quit with zero result - it means that the indicator is considered as not calculated
      return(false);
     }
   return(result);
  }
This code is used to copy values from an indicator buffer into an array. The function takes five parameters: a handle to the indicator, the indicator buffer, the starting position in the buffer, the number of values to copy, and an array to store the values. It then checks if the array is dynamic, and if it is, it resets the error code and copies the values from the buffer into the array. If the copying fails, it prints an error message and returns false. Otherwise, it returns true.
double get_lot(double price)
  {
   if(inp_lot_type==LOT_TYPE_FIX)
      return(normalize_lot(inp_lot_fix));
   double one_lot_margin;
   if(!OrderCalcMargin(ORDER_TYPE_BUY,_Symbol,1.0,price,one_lot_margin))
      return(inp_lot_fix);
   return(normalize_lot((AccountInfoDouble(ACCOUNT_BALANCE)*(inp_lot_risk/100))/ one_lot_margin));
  }
double normalize_lot(double lt)
  {
   double lot_step = SymbolInfoDouble(_Symbol,SYMBOL_VOLUME_STEP);
   lt = MathFloor(lt / lot_step) * lot_step;
   double lot_minimum = SymbolInfoDouble(_Symbol,SYMBOL_VOLUME_MIN);
   lt = MathMax(lt, lot_minimum);
   return(lt);
  }
This code is used to calculate the lot size for a trade. The first function, get_lot(), takes in the price of the trade as an argument and checks the lot type (fixed or risk-based). If the lot type is fixed, the normalize_lot() function is called to normalize the lot size. If the lot type is risk-based, the OrderCalcMargin() function is used to calculate the margin required for the trade, and the AccountInfoDouble() function is used to get the account balance. The lot size is then calculated by dividing the account balance by the margin and multiplying it by the risk percentage. The normalize_lot() function is then called to normalize the lot size. The normalize_lot() function takes the lot size as an argument and calculates the step size and minimum lot size for the symbol. The lot size is then rounded down to the nearest step size and the minimum lot size is applied if necessary.
6. Results
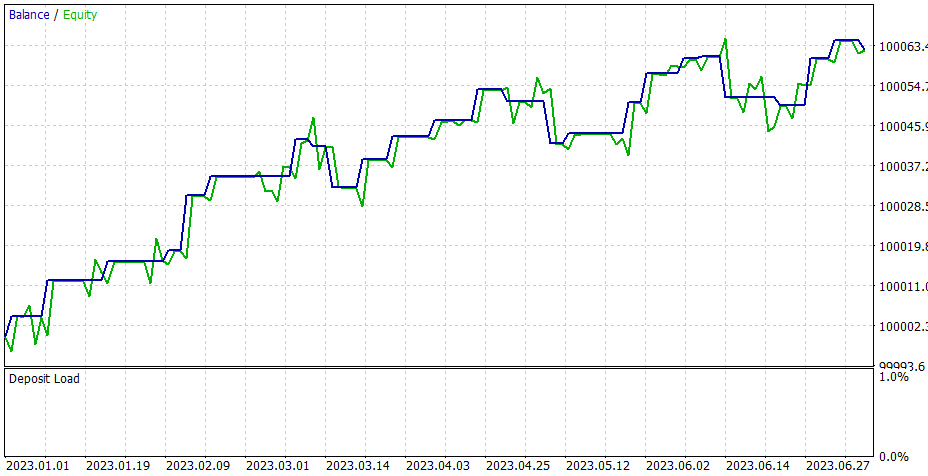
For EURUSD, 30 min periods, and 900 points for sl (remember to use 8 periods for RSI) for 2023 from the first of January to the end of June.

7. Conclusion
Of course, not all techniques are perfect. You are bound to encounter a few bad signals, specially during trending periods. As you may also notice, during severe trends, the technique does not work as expected.
The strategy must be optimized in order to be applied on markets but the idea is to present a mean reversion way of thinking about market analysis.
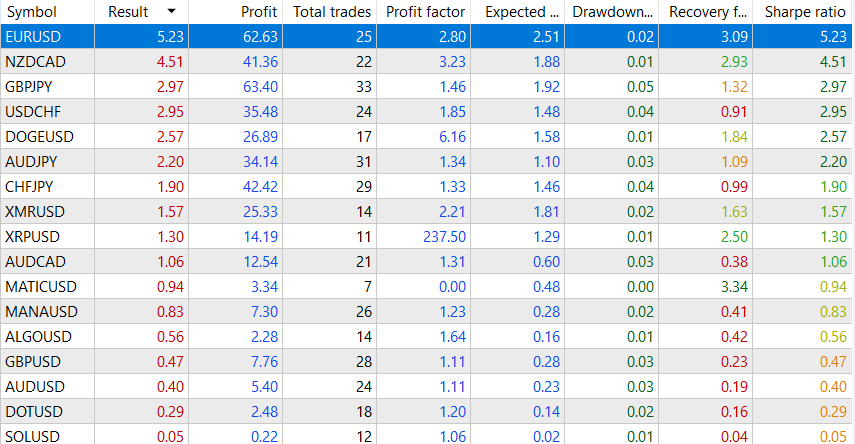
These are the profitable results for all the symbols of my broker in a Cent account, with a period of 30 minutes over 2023 till the end of June.
- Free trading apps
- Over 8,000 signals for copying
- Economic news for exploring financial markets
You agree to website policy and terms of use
Here is the contradictory explanation of the RSI : When it goes up there is an upward momentum and you must sell because it must go down. Momentum and reversal are opposite concepts.
Noticing that every time the RSI is above that of the previous period, there is a bull candle. So it's more a RSI crossing triple bull/bear strategy.
Also I tested the EA, with your given parameters, on a more extended period, and it seems overall unprofitable.
[...]
Also I tested the EA, with your given parameters, on a more extended period, and it seems overall unprofitable.