
Category Theory in MQL5 (Part 11): Graphs
Introduction
In our previous article, we delved into monoid groups, by exploring concept of symmetry within typical monoids. In introducing an additional axiom that all members of a monoid group must possess an inverse and restricting binary operations between mirror elements to yield the identity element, we extended applicability of monoids at crucial trade decision points. Building upon this, we now continue our study of category theory and its practical applications in trade system development by examining graphs.
Graphs serve as powerful tools for modeling complex systems and visualizing relationships between various components. Within the context of trade system development, the implementation of category theory graphs in MQL5 could offer valuable insights and an alternate perspective to how we view our decision-making processes. While our previous article hinted at potential of monoid groups in reclassifying and normalizing monoid sets to improve trade decisions, this article explores the usefulness of category theory graphs as part of an MQL5 trade system development. While there is acknowledgement of the broad usefulness and interconnectedness of graphs within category theory, this article aims to highlight specific benefits to trade system development; trailing stop management as has been the case in prior articles where we considered trading systems.
Throughout this article, we may uncover additional advantages of utilizing graphs in MQL5, examine how these enhance system design and organization, facilitate advanced data analysis and visualization, and contribute to system optimization and performance improvement; however, they will not be the focus.
Understanding Graphs in Category Theory
Graphs are a way of ‘concretely’ defining interconnected vertices and the arrows that link them within a system. Within category theory they thus constitute four things namely: the set of vertices, the set of arrows linking these vertices, a homomorphism function from the arrows set to the vertices set that maps the source vertex for each arrow, and finally another homomorphism function for the arrows’ targets to these vertices set.
Before we go any further though, it may be helpful to say something about the primary differences between graph theory and category theory. At a glance both appear to be about connecting things which may beg the pedestrian question why are they not same thing? To answer the question, if we consider cooking process as an example, with its steps and ingredients at each step; graph theory would be focused on the sequence of these preparation steps for a given recipe and perhaps what other iterations in these steps (paths) one can use in altering or improving the recipe. On the other hand, Category theory would take a more abstract view by dwelling more on the transformations at each cooking step and looking at how they may be compared to other recipes’ cooking step transformations. The other recipe would amount to another category if we take each cooking-step to be a set/ domain featuring a list of ingredients. In other words, category theory puts more emphasis on morphisms or in this case functors, rather than step sequence. So, we are looking at graphs here as a tool to category theory. For more on the subject there is a discourse on category of graphs vs graph of categories.
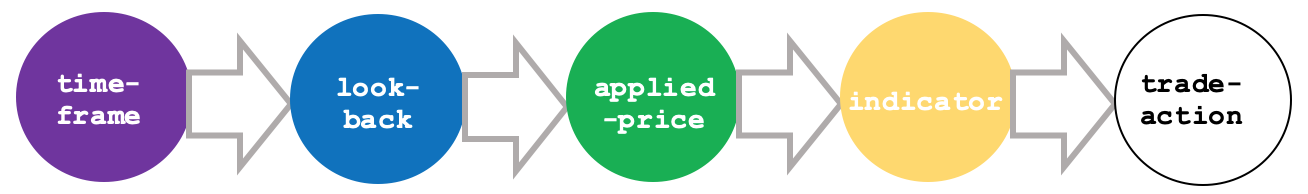
Graphs therefore, for our purposes, can be considered as a means of cataloging the number and sequence of steps in an interconnected system. Since we started on monoids we had looked at a trade decision system (with monoids at each node) that followed these steps:
- Select time-frame
- Select look-back period
- Select applied-price
- Select indicator
- And finally select trade-action
This could be diagrammatically represented as shown below:
Alternative systems of the same steps could also be drawn as shown below:
Option 1

Or option 2

With each of these options 1 and 2, we have simply iterated the interim steps between time-frame and trade action. As we’ll see in the case study 2 below, the potential to create different paths presents different patterns that could be useful in making some trade decisions.
Formally though, if we consider our default system that runs from time-frame to trade-action, a graph is represented by two tables; an arrows table and a vertices table. These are shown below:
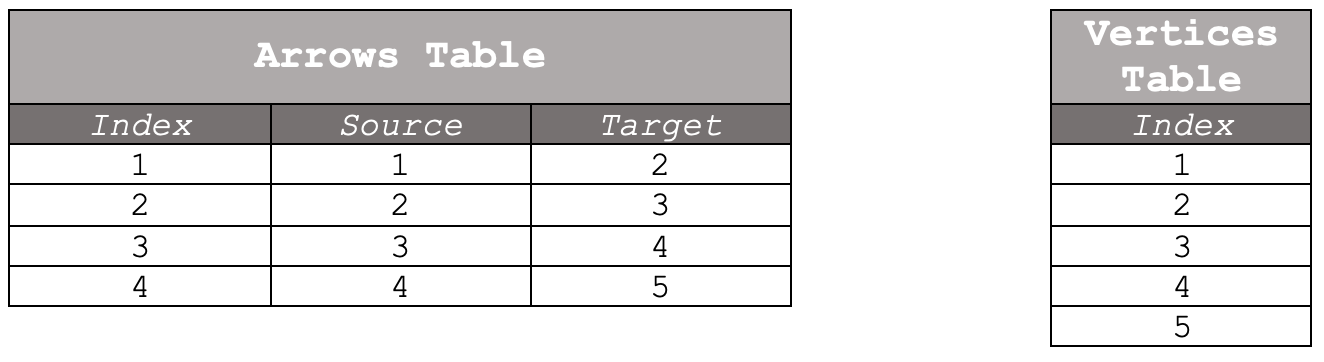
Where the source and target indices in the arrow table are the vertex indices. Index column in arrows only serves to enumerate arrows.
In remodeling the trading system, we considered and shared reports as per previous articles we will look to explore the significance of graphs by alternating the intra-steps of look-back, applied-price and indicator. We will keep the start and end steps the same so as not to overly complicate our logic. In addition, we will consider the possible homomorphisms between various graphs if we were to consider the hypothesis ‘there is no ideal system but rather these are expected to change on each new bar’; thus, we will try to project the next graph homomorphism given, say, the most recent two.
MQL5 and Trade System Development
In these series we have looked at trade system development from the inbuilt MQL5 wizard library. Trade systems as expert advisors can be assembled using the IDE inbuilt wizard as long as the user, in the process, selects a signal, a money management method, and a trailing stop method, from what is available in the library. For these articles we were looking to extend the library, specifically the trailing stop inbuilt methods by adding alternatives that use category theory concepts explored in the articles.
Trade system development in MQL5 is often plagued by quite a few challenges ranging from debugging in even relatively simple coded experts to sourcing and using accurate tick data, and finally testing on reasonably long periods of history in a timely fashion. There are other challenges but I would argue these could be the major ones. The debugging problem tends to be more nuanced than the others because a lot of times the bugs will not be compilation bugs, the kinds for which the compiler will notify you, but rather they can be in the system logic of your expert. And these can fail to show up all through testing up until you go live. That is why assembling your expert from standard library parts, as much as possible, can go a long way in avoiding this pitfall. To this end the systems that we test in these articles, will be assembled by the wizard using publicly available library and standard code with only modifications coming from our custom class that implements a particular concept.
Exploring Usefulness of Graphs in MQL5 Trade Systems
It may be helpful if we start by looking at the abstract benefits of graphs in MQL5. This s because on the whole they have potential to enhance system design and organization.
If we consider our hypothesis of no ideal order of trade steps between time frame selection and trade action selection, then we could leverage the changes between these systems as graph homomorphisms. These homomorphisms could be investigated for quadratic or even linear relationships when in sequence so as to see if forecasts could be made. Put another way we are leveraging graphs to better manage our trade system’s component relationships.
If we can establish such a relationship among the graph homomorphisms, whether it be quadratic or linear, we can re-use it in other or similar price action situations thus negating the need to reinvestigate and compute such relations. Said differently we are improving modularity and reusability of our trade systems.
And there’s more. If we take a step outside of our ‘closed’ trade system and try to see what else could be indicated by various ‘paths’ of graphs we could analyze for correlations between path types and price action. Supposing we consider a single price bar that has the typical four prices of open, high, low and close. We could deem these a path because usually their order is not always O-H-L-C. In bullish bars, though not always, the order could be O-L-H-C. This and other observations could lead to pattern recognition by early detection of price action changes based on the path type of prior intra-bar price movements.
Also, if we simply color code the intra steps of our 5-step trade system that starts with time-frame selection and ends at trade-action selection, and have our expert advisor periodically update and display these colored sequenced steps on the chart it is attached, we would at a glance know what system we are using at that time. This would be helpful if we stick with our earlier hypothesis of the ideal step-sequence could change on each new chart price bar. This visual representation of a trade system in such a dynamic format can be very helpful to traders for analysis and understanding long term price-action trends.
Optimization and performance improvement of a trade system can also be exploited with graphs if input parameters are attuned to graph settings. For instance, if in a trade system different from the one we are considering, we sought to find the ideal entry signal for each type intra-bar price steps (see OHLC above), these could be optimized over a strategic period and walk forward tests done to see if the strategy has legs.
There are bottlenecks as well though with graphs. The main one being the requirement for visual representation and interpretation. In a fluid trading environment this can be quite a drag which is why expert advisors using graphs need to be as seamless and nimble as possible by using memory efficient methods like indexing of the various system steps to allow a more fluid and efficient execution.
Case Studies: Implementing Graphs in MQL5
Case study 1: Graphs based on intra price bar values:
For our first case study we can, as has been the case in previous articles, examine the impact different graph paths of lagging intra price bars have on eventual high and low ranges on subsequent price bars. So, to recap from above the intra price bars consider the order of open, low, high and close price sequence. You always start with the open and end with the close but the order of high and low is not standard, and this variability allows us to study for any relations to subsequent changes in highs and lows. In achieving this we will as before construct an instance of the Expert Trailing class and have this pair with other existing classes in the library for signal and money management so as to form an expert advisor. For this study we will pair our trailing class with the awesome oscillator signal class and fixed margin money management class.
If we run tests on the pair USDJPY on the one-hour timeframe from June of 2022 to June of this year we get results indicated in the report below.

Case study 2: Graphs as modification of prior trading system
For the second study we can consider different iterations of the intra steps in our trade system used in previous articles. Recall the steps were: timeframe selection, lookback period selection, applied-price selection, indicator selection, and finally trade decision selection. So, as we have constrained the first and last vertices of the graph paths for case 1 we will also fix timeframe selection and trade decision selection as the first and last respectively. In testing and examination therefore, we will iterate lookback period, applied-price and indicator selection to come up with different paths. The impact of each path will, as in case 1, examined for accuracy in forecasting changes between price bar range. The forecasts made based on selected iteration, will be used in adjusting trailing stop as had been case in previous articles.
If we run tests on the pair USDJPY as with case 1 we get results indicated in the report below.

Potential Challenges and Considerations
As can be garnered from our test expert advisors implemented in the 2 case studies above, using graphs in a trade system is fairly complex and involves a steep learning curve in order to reap meaningful results. If we consider the first expert advisor we derived our paths from intra-bar price steps of open, high, low, and close. These paths were coded as a rudimentary class that did not even include weighting for each arrow, a feature which is useful if a graph class instance gets updated over time with new arrow information. What we have used instead is a class instance that gets initialized at each new bar thus losing out on learnt memory. Implementing the later would ideally involve having a file stored in the IDE sandbox of these graphs which in and of itself is memory consuming. Add to that the processing power and time involved in testing would increase versus the simple class we used in the case study. Also, we chose to define each vertex as a price point within a bar yet we could have used a more computationally efficient option of defining each price point as the close price. This points to the need to carefully weigh decisions and balance them against expected accuracy of your system. Furthermore, there are many types of directed graphs which implies the developer needs to carefully select what would work best with the strategy they have in mind. To make matters worse broker price data is never complete and is often riddled with gaps and missing prices. Add to that the relationship across the graph arrows, of the connected price points, is fairly complex. It is influenced by a host of factors including market conditions, investor sentiment, and economic events and a slew of many others. It may be incumbent on the graph system developer to come up with a way of capturing this such that his system is able to get meaningful trade results in the long run and given the amount of ambiguity introduced here, it certainly does complicate the process. And finally, scalability is something that should be considered here because as new price data is realized every day the graphs, especially the learning kind with weights (which we did not cover in our case studies) will need to be updated. The retraining of the graphs is bound to get more computationally intensive with time unless the developer is able to come up with smart and efficient methods of coding his classes to avoid this.
There are no libraries yet, at least suitable ones to aid in implementing graph-theory in MQL5. This implies coders need to invest significantly in time and resources to come up with workable solutions. And since they are not commonly shared but independent they are bound to be error prone. For comparison plenty of trading indicators that implement a host of ideas from Relative Strength indicator, to Bollinger Bands (at least 47 in total) are available in the MQL5 IDE to use without having to code them from scratch.
As highlighted above implementing graph structures and algorithms from scratch without suitable libraries in MQL5 is not only time-consuming but is error-prone, and bound to require traders invest significant effort into coding workable solutions. This process not only increases development time but also introduces a higher risk of bugs and inefficiencies.
In contrast to graph-theory implementation, several other trading concepts enjoy availability of widely used and well-documented libraries in MQL5. These include:Built-in technical indicators, such as moving averages, oscillators, and trend lines. Traders can readily access and utilize these indicators without need to reinvent wheel. Furthermore, a vast collection of custom indicators developed by trading community is available, allowing traders to choose from a multitude of pre-built solutions.
In addition, MQL5 provides a comprehensive set of mathematical functions, including statistical calculations, mathematical transformations, and probability distributions. These functions enable traders to perform complex calculations and analyses, facilitating development of sophisticated trading strategies.
While MQL5 excels in providing libraries for many trading concepts, lack of standard libraries specifically tailored for graph implementation poses a significant challenge. Traders who wish to incorporate graphs into their strategies face the obstacles of excessive Time and Effort, poor reliability & Efficiency, and a steep Learning Curve.
To bridge gap in graph implementation within MQL5, a few approaches can be considered. These could includeCommunity Contributions by encouraging MQL5 community to develop and share graph-related libraries that can significantly enhance availability of pre-built solutions. Promoting collaboration, knowledge sharing, and creation of open-source projects fosters a vibrant ecosystem that benefits all traders seeking to incorporate graph-based strategies. Another avenue could beThird-Party Libraries where exploring outside of MQL5 ecosystem could be considered to provide alternative solutions. Various programming languages, such as Python or C++, already have extensive graph libraries that can be integrated with MQL5 through custom DLLs (dynamic-link libraries) or API (Application Programming Interface) interactions. Finally vendor support by lobbying service desk for inclusion of standardized graph libraries in future MQL5 updates can leverage expertise of platform developers. Requesting enhancements and providing feedback on necessity and benefits of such libraries may motivate platform providers to address this gap.
Also, Open-CL, available in IDE could help tackle performance issues.
Future Directions and Possibilities
Advancements in category theory graph that could lead to possible implementation for trade systems are happening daily. There are a few sites that cover this matter here and here. Suffice it to say, integration with artificial intelligence platforms like chatGPT 4.0 may not be as esoteric as say 2 years ago. A lot is happening. Potential for meaningful impact and opportunities for further research and development will continue to sprout which is why we may continue to hear more exciting news in this field.
Conclusion
To recap this article has looked at the implementation of category theory graphs in MQL5. Emphasis has been drawn to the usefulness of graphs in trade system development. Reader is encouraged to undertake further research and study on materials and code provided before adoption and use in their own trade systems.
- Free trading apps
- Over 8,000 signals for copying
- Economic news for exploring financial markets
You agree to website policy and terms of use
I really would have expected that the EA(s) with the shown results with there settings are attached.
Would you mind to upload them here in the comment part?