Смотри обучающее видео по маркету на YouTube
Как купить торгового робота или индикатор
Запусти робота на
виртуальном хостинге
виртуальном хостинге
Протестируй индикатор/робота перед покупкой
Хочешь зарабатывать в Маркете?
Как подать продукт, чтобы его покупали
Технические индикаторы для MetaTrader 4 - 11
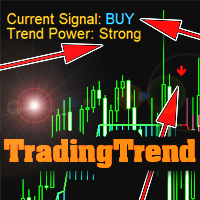
Индикатор не перерисовывается.
Можно использовать как уже готовую торговую стратегию. Показывает: Направление тренда; Силу тренда; Точки разворота или затухания тренда. Настройки: Trend sensitivity (the lower, the more accurate) - чувствительность работы (чем выше, тем точнее); Calculation method - метод расчета; Info position - угол расположения инфо-надписи (или убрать); Text Color - цвет текста; Trend Color Buy - цвет БАЙ-текста; Trend Color Sell - цвет СЕЛЛ-текста; Sound Alert - Всплывающ

Или CKC.
Этот индикатор работает в зависимости от классического правила десятидневной скользящей средней, описанного Честером В. Келтнером (1909–1998). По умолчанию все параметры настроены на классическую версию системы Кельтнера, при этом пользователь может изменить их по своему желанию. Важная информация
Прочтите руководство CKC: https://www.mql5.com/en/blogs/post/736577 Пример советника CKC: https://www.mql5.com/en/blogs/post/734150
О формуле канала Келтнера
1. Рассчитайте центральную л

All Symbols AND All Time frames Scan
Document Introduction
The ABCD is a basic harmonic pattern. The ABCD pattern is a visual, geometric chart pattern comprised of three consecutive price swings. It looks like a diagonal lightning bolt and can indicate an upcoming trading opp

Индикатор синхронизирует восемь видов разметки на нескольких графиках одного торгового инструмента.
Этот индикатор удобно использовать вместе с "Multichart Dashboard" или другим похожим помощником, который позволяет работать сразу с несколькими графиками одновременно.
"Multichart Dashboard" можно найти по ссылке на моём youtube-канале.
Настройки:
включение синхронизации Vertical Line
включение синхронизации Horizontal Line
включение синхронизации Trend Line
включение синхрониз
FREE

Monster Harmonics - индикатор гармонических моделей (harmonic patterns). Он распознает следующие модели: Гартли (Gartley), Летучая мышь (Bat), Краб (Crab), Бабочка (Butterfly), Монограмма (Cypher), Черный лебедь (Black Swan), Белый лебедь (White Swan), Акула (Shark) и AB=CD. Незаконченные модели также распознаются. Monster даже показывает потенциальную зону разворота (Potential Reversal Zone, PRZ). Пользователи могут добавлять свои паттерны. Кроме текущей модели, Monster также показывает все мод
Pipfinite creates unique, high quality and affordable trading tools. Our tools may or may not work for you, so we strongly suggest to try the Demo Version for MT4 first. Please test the indicator prior to purchasing to determine if it works for you. We want your good reviews, so hurry up and test it for free...we hope you will find it useful.
Combo Channel Flow with Strength Meter Strategy: Increase probability by confirming signals with strength Watch Video: (Click Here)
Features Detects ch

Точный торговый анализ у вас под рукой: программное обеспечение для анализа торговли нового поколения Основное программное обеспечение для анализа торговли, доступное на рынке, часто предоставляет только почасовую или еженедельную статистику коэффициента прибыли и убытков, что не отвечает требованиям более точного анализа торговли. Однако на реальном торговом рынке каждый день складываются уникальные обстоятельства. Понедельники тихие, среды активные с тройным овернайт-процентом, а пятницы искл
FREE

RT_TrendlineTool : Semi-AutoTrendline Tool on MT4 2 easy steps, just press the [T] button on your keyboard and click on the Swing High/Low that you're interested.
Then the indicator will try to draw a trendline that runs through only the wick, not cut through candlestick's body
and try to cross the swing point as much as possible with the least slope of the trendline. You can draw up to 10 trendlines.
You are able to get alert when price breakout these trendlines. Additional Hotkey : Press
FREE

Надоело строить трендовые линии? Индикатор PZ TrendLines применяет механический подход к построению трендовых линий за вас! Он может нарисовать до 18 линий По желанию трендовые линии могут основываться на фракталах Каждая линия представляет уровень пробоя Каждая трендовая линия может быть пробита или отклонена Настраиваемое число линий Настраиваемое число цветов
Автор Артуро Лопез Перез, частный инвестор, биржевой спекулянт, программист и основатель Point Zero Trading Solutions.
FREE

The Penta-O is a 6-point retracement harmonacci pattern which usually precedes big market movements. Penta-O patterns can expand and repaint quite a bit. To make things easier this indicator implements a twist: it waits for a donchian breakout in the right direction before signaling the trade. The end result is an otherwise repainting indicator with a very reliable trading signal. The donchian breakout period is entered as an input. [ Installation Guide | Update Guide | Troubleshooting | FAQ | A
FREE

Note: This is an Arrows Only Indicator. Get paid scanner or free TDI extra indicators here: https://abiroid.com/product/tdi-sharkfin-arrows-and-scanner/
About:
This is a TDI Arrow Indicator for finding the Shark Fin Pattern. It will show an arrow in the current bar if RSI sharkfin is finished forming in previous bar.
What is Shark Fin TDI Pattern?
Upper Shark Fin: In TDI Indicator when Green RSI breaks above a certain level and also breaks upper Volatility band and then breaks below that
FREE

TrendExpert Indicator Overview
The TrendExpert indicator is designed to identify and visualize trend zones in financial markets. It utilizes zigzag high and low points to determine support and resistance levels, providing insights into potential market reversals and continuation patterns.
Features - Detection of support and resistance zones based on price action. - Strength categorization (Proven, Verified, Untested, Turncoat, Weak) based on historical testing. - Adjustable parameters fo
FREE
Этот индикатор является уникальным в своём роде, больше всего подходит для скальпинга на XAUUSD а также для торговли на более старших таймфреймах!
Уведомление сообщит самые важные точки входа, поэтому следует торговать по тренду. Идеален для скальпинга! The Best Trend Signals - трендовый мультивалютный индикатор, может использоваться на любых финансовых инструментах валюта, криптовалюта, металлы, акции, индексы. Рекомендуемый тайм-фрейм M15, M30, H1, H4, D1.
Как торговать с помощью индикат
FREE
Thank you for your interest in "Goldfish Indicator". I have been trading since 2008. I usually trade on Renko chart in reversal pattern with Goldfish Indicator. If you share your vps details with me, I will connect your account (Live/Demo). To get proper results copy my trades for at least 30 days. Minimum Deposit: $1000 Leverage: 100:1 Profit Target: Monthly average profit target is 10% to 20%+/- Draw-down: The average drawdown is 10% to 20% Risk
Warning: Trading financial products on margin
FREE

Nas100 killer V2 (See video of how we test the indicator live) 1000% non-repaint indicator appears on current candlestick. Timeframes: M5, M15, M30, H1, H4. Works on pairs such as (NAS100, US30, SPX500, and Gold) The indicator is strictly for scalping do not hold trades for too long. Orange arrows look for selling opportunities. Light Blue arrows look for buying opportunities.
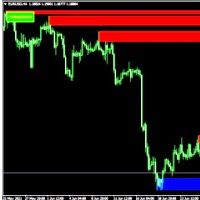
Use the indicator only in retest zones The newly formed zone should be used for scalping only New zones are repainted or recalculated When supports and resistances are violated, they are deleted as they no longer function. Recommended on M30 and higher timeframes You will see the trading zones and identify the most profitable points to open positions. The indicator marks the supply and demand zones. With this show you will now make profitable trades that will set the trends. Shows all support a
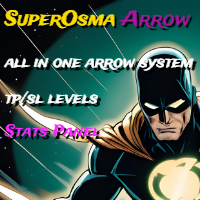
SuperOsma Arrow — это супертрендовый индикатор на основе osma, который подает сигналы на покупку и продажу. Индикатор не перерисовывается и поставляется с информационной панелью, на которой отображается статистика сигналов.
Рекомендуемый таймфрейм: 15 и выше.
Buy: стрелка покупки появляется на открытии бара, устанавливает tp и sl, как показано на графике.
Продажа: стрелка продажи появляется на открытии бара, устанавливает tp и sl, как показано на графике.
============================

Time Session OPEN-HIGH-LOW-CLOSE This Indicator Will Draw Lines Of OHLC Levels Of Time Session Defined By User. It Will Plot Floating Lines On Current Day Chart. Time Session Can Of Current Day Or Previous Day. You Can Plot Multiple Session Lines By Giving Unique ID To Each Session. It Can Even Show Historical Levels Of Time Session Selected By User On Chart To Do Backdating Test. You Can Write Text To Describe The Lines.
FREE

Информация об индикаторе MACD доступна по этой ссылке .
Описание программы Этот индикатор способен отображать 1-2 индикатора MACD на разных таймфреймах и с разными настройками. Имеется бесплатная версия, которая использует для расчетов EMA. Данная версия Pro использует все 4 типа скользящих средних для расчетов: простая, экспоненциальная, сглаженная и линейно-взвешенная. Активные индикаторы могут подавать всплывающее, звуковое, push-сообщение или оповещение по электронной почте. В бесплатной в

PLEASE NOTE You can customize the settings of Fast EMA, Slow EMA, MACD SMA & Main SMA. The accuracy will change as per your settings.
100% Non repaint indicator
Pre-alert (get ready) signals
Non-delay indications
24/7 signals
100% No lag
No recalculating The arrows wont repaint even if the signal fails, or you refresh or restart the mt4 Indicator is based on simple crossover strategy of main line and signal line of MACD indicator in consideration with zero line and Main SMA. The best
FREE

This Indicator is a affordable trading tool because with the help of Popular Developers & Support of M Q L Platform I have programmed this strategy. I tried to combine logic of Moving Averages, Parabolic Stop And Reverse, Trend Strength, Oversold, Overbought . Furthermore, I have also care about Support Resistance that Trader can easily get in touch with market by selecting one indicator only. What is in for Trader?
Trading Modes: This selection is for activate whole strategy "Power
FREE
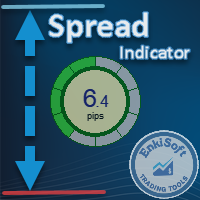
Custom Spread Indicator *Please write a review, thanks!
Also MT5 version is available
Spread Indicator show the current spread in pips with color codes. Handle 3 levels, Low, Medium, High. You can set levels and colors for each level (eg. Low: Green, Medium: Orange, High: Red), and can choose display position on the chart.
There is two spread calculation mode: -> Server spread value -> Ask - Bid value
Can set opacity, for better customization. When spread jump bigger, then display do
FREE

Вы торгуете по гармоническим паттернам? Паттерн "Три движения" (Three Drives) представляет собой шеститочечный паттерн разворота, состоящий из серии повышающихся максимумов или понижающихся минимумов, завершающейся на уровнях Фибоначчи 127% или 161.8%. Он сигнализирует о том, что движение слабеет и высока вероятность разворота. Паттерн легко обнаруживается Позволяет изучить основы гармонических паттернов Полезен при поиске дешевых и дорогих зон Бычьи откаты отображаются синим цветом Медвежьи отк
FREE
This indicator informs the user when the ATR is above a certain value defined by the user, as well as when the ATR prints a percentage increase or percentage decrease in its value, in order to offer the user information about the occurrence of spikes or drops in volatility which can be widely used within volatility-based trading systems or, especially, in Recovery Zone or Grid Hedge systems. Furthermore, as the volatility aspect is extremely determining for the success rate of any system based o
FREE
Introduction to the Candle Time Indicator The Candle Time Indicator for MetaTrader 4 (MT4), helps users know how much time on a candlestick is remaining. This is a simple but incredibly powerful and useful tool. To download the Dagangduit CandleTime.mq4 indicator, check the bottom of this post. It’s one of the best forex time indicators in its category. The function of the indicator will not change, even if you change the name of the indicator. The candlestick countdown timer will tell you how m
FREE

Индикатор TrueChannel показывает нам истинные каналы движения цены. Этот индикатор своим видом напоминает Donchian Channel , но построен на основе совершенно иных принципов и дает более адекватные торговые сигналы. Как показано в статье цена на самом деле движется в каналах параллельных временной оси и резко – перепрыгивает из предыдущих каналов в последующие. Установить такое движение цены позволяет индикатор Probabilities distribution of price ( PDP ). Индикатор
FREE

Tipu Heikin-Ashi Panel - это модифицированная версия оригинального индикатора Heiken Ashi, опубликованного MetaQuotes здесь . Профессиональная версия индикатора доступна здесь .
Особенности Это простая в использовании панель, которая отображает тренд Heiken Ashi на выбранном таймфрейме. Настраиваемые алерты Buy/Sell, push-уведомления, сообщения по email и визуальные оповещения на экране. Настраиваемая Панель. Панель можно разместить в любом месте графика или свернуть, чтобы освободить простран
FREE

This indicator identifies swing highs and swing lows in the price chart by comparing the Highs and lows of each candle to a specified number of candle before and after it. Once it has identified the swing highs and swing lows, it can use them to determine potential support and resistance levels. A support level is formed when the price drops and bounces back up from a swing low, indicating that there is buying pressure at that level. A resistance level is formed when the price rises and reve
FREE

Индикатор отображает профили объёма по принципу вложенности. Периоды профилей предустановлены так, что каждый последующий профиль имеет протяжённость вдвое большую, чем протяжённость предыдущего профиля. Помимо профилей индикатор отображает кластеры объёма, отсортированные по цвету, в зависимости от содержащегося в них объёма.
Особенности работы индикатора Индикатор работает на типовых таймфреймах от M5 до MN, но для вычислений использует исторические данные меньших таймфреймов: M1 - для таймф
FREE
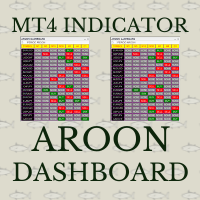
Aroon crossover Dashboard uses the value of Aroon indicator. The Aroon period can be adjusted via the Edit box of this dashboard. The monitoring pairs will be selected by adding to the Market Watch (no need to set prefixes or suffixes) , you can monitor many pairs as you like. This dashboard will check almost popular time frame (M1,M5,M15,M30,H1,H4 and D1). The colors can be customized. The Aroon indicator has been included in to this Dashboard, you do not need purchasing it. Crossover signal c

The indicator displays the following elements: Supply Zones, Demand Zones, Fair Value Gaps and sends alerts when a supply or demand zone is reached. The zone timeframe is set independently of the chart timeframe. For example, it is possible to set M5 zones on an H4 chart. The importance of zones can be adjusted using the zone strength parameter. Demand zones are displayed if at least one candle in the range of the zone is entirely above the zone. Similarly, supply zones are displayed if at least
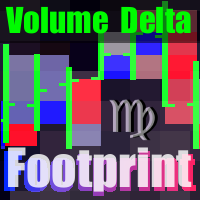
Индикатор позволяет визуализировать и анализировать дельты тиковых объемов. Он вычисляет на каждом баре тиковые объемы для покупок и продаж (раздельно), а также их разницу. Далее объемы отображаются в разбивке по кластерам (ячейкам) цен на заданном количестве последних баров. Это специальная, более наглядная версия индикатора VolumeDelta . Это ограниченная по своим возможностям замена анализа рыночной дельты (глубины рынка), которая традиционно основывается на реальных объемах, но они недоступны

This indicator is very useful for day traders or short term traders. No need to calculate the number of pips manually, just look at the chart and you will see the Virtual Take Profit / Virtual Stop Loss target line and evaluate whether the entry point is feasible to reach the intended target or not.
Enter the intended Take Profit / Stop Loss pips for your trade. The indicator will display Virtual Take Profit / Virtual Stop Loss lines for you to easily see if the target is feasible or not.
FREE
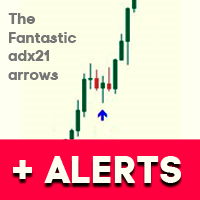
Смотри скриншоты индикатора. Использует информацию о текущем тренде. В основе лежит классический индикатор ADX. Дает сигнал на вход в сделку по нестандартной стратегии. Подпишись на мой telegram канал, ссылка в контактах моего профиля . Настройки: Наименование Описание
Period of ADX Период классического индикатора ADX Distance between +D & -D lines Расстояние между линиями +D и -D. Определяет силу тренда Freshness of the signal (bars) Проверка свежести сигнала на покупку или продажу.
Выбир
FREE

Закрытие предыдущего дня и смещение баров для MetaTrader! Индикатор Закрытие предыдущего дня и смещение баров - это инструмент, разработанный для улучшения технического анализа и принятия решений в торговле. С помощью этого индикатора вы получите подробную информацию о уровнях открытия, максимума, минимума и закрытия любого бара, что позволит провести точный и всесторонний анализ движения рынка. Представьте себе возможность поместить один таймфрейм в другой, позволяя детально анализировать кажды
FREE

Detect strength for uptrends and downtrends by tracking Buy Power and Sell Power. Stay on the right side of the market by being able to determine whether the market is in a bull or bear trend and how strong the trend is.
Free download for a limited time! We hope you enjoy, with our very best wishes during this pandemic!
Trend Trigger Factor aims to ride out sideways movement, while positioning the trader in the correct side of the market to capture big trends when they occur. It was orig
FREE

Индикатор Th3Eng PipFinite PRO Этот продукт отличается от Th3Eng PipFinite Original, используя другую логику и алгоритмы. Индикатор Th3Eng PipFinite Pro проводит анализ направлений тренда с помощью собственных алгоритмов. Он показывает направление тренда, точки входа, точку стоп-лосса и три точки тейк-профита. Индикатор также отображает точки поворота, динамические каналы поддержки и сопротивления, а также боковое окно с детальной текущей информацией о сигнале.
Как торговать с Th3Eng PipFinit

The 5X target indicator is an indicator that plots the optimal entry zone and the target for the trading day. It also plots a level where the stoploss can be moved to breakeven for a risk free trade which is 2X. This indicator has time window inputs. The default settings are from 02:00 to 19:00 CET+1 time zone. This indicator is based used with a direction bias for the day. I post the direction bias for several pairs in the comments section. Added a new feature Time Zone to help trade the highes

Мультивалютный и мультитаймфреймовый индикатор Heikin Ashi. Отображает текущее состояние рынка. На панели вы можете видеть направление, силу и количество баров текущего тренда. Также, с помощью цвета, отображаются свечи консолидации/разворота цены. В параметрах можете указать любые желаемые валюты и периоды. Также индикатор может отправлять уведомления при изменении тренда или появлении разворотных и прорывных свечей. По клику на ячейке будет открыт данный символ и период. Heikin-Ashi — японский

Scalping Indicator Pro is a powerful indicator that works in trend as well as non trending market conditions. This indicator is perfect for scalp trades as well as swing trades. Scalping Indicator Pro is not just an indicator, but a trading strategy itself. It doesn't requires any additional indicators for the trading setup.
Check out the indicator in action. [Video demonstration below]
Why use Scalping Indicator Pro? Great for novice traders as well as experienced traders. Low risk entrie
Like most things that work in trading, it's really simple. However, it's one of the most powerful tools I have that makes entries of many systems much more precise.
In its essence, it measures the recent volatility against the medium-term average. How does it work? Markets tend to be prone to strong trending movements when relative volatility is low and tend to be mean-reverting when relative volatility is high.
It can be used with both mean-reversion systems (like the Golden Pickaxe) an
FREE

A top and bottom indicator that can intuitively identify the trend of the band. It is the best choice for manual trading, without redrawing or drifting. How to get this indicator for free: Learn more Price increase of $20 every 3 days, price increase process: 79--> 99 --> 119...... Up to a target price of $1000. For any novice and programming trading friend, you can write the signal into the EA to play freely. Array 3 and array 4, for example, 3>4 turns green, 3<4 turns red. If you don't underst

Реализация известного индикатора SuperTrend. Индикатор позволяет увидеть значения, на которых срабатывают оповещения индикаторов SuperTrend Scanners:
SuperTrend Scanner SuperTrend Scanner FREE
Параметры SuperTrendATRPeriod: период для расчета значения SuperTrend SuperTrendMultiplier: множитель для расчета значения SuperTrend
FREE

Gold TL MTF – это прекрасный биржевой технический индикатор. Алгоритм индикатора анализирует движение цены актива и отражает трендовые линии по фракталам заданного таймфрейма (ТФ).
Преимущества индикатора: Индикатор выдает сигналы с высокой точностью. Подтвержденный сигнал индикатора не исчезает и не перерисовывается. Торговать можно на торговой платформе MetaTrader 4 любого брокера. Торговать можно любыми активами (валюты, металлы, крипто валюты, акции, индексы и т.д.). Торговать можно на л
FREE

Forex Gump - это полностью готовая полуавтоматическая торговая система. В виде стрелок на экран выводятся сигналы для открытия и закрытия сделок. Все, что вам нужно, это следовать указаниям индикатора. Когда индикатор показывает синюю стрелку, Вам нужно открывать ордер на покупку. Когда индикатор показывает красную стрелку, нужно открывать ордер на продажу. Закрываем ордера когда индикатор рисует желтый крестик. Для того, чтобы получить максимально эффективный результат, рекомендуем использовать

Candle Power Signals - трендовый индикатор использующий стратегию поиска потенциальных волатильных сигналов для принятия торговых решений.
Анализируя рынок индикатор определяет зоны повышенной и пониженной волатильности в пределах направленного трендового движения.
Основные параметры генерации сигналов уже настроены, оставшиеся настройки и периоды проиндексированы в 2 параметра для ручной настройки:
1. "Candle calculation method" - 2 режима генерации сигналов, рекомендуется использовать об
FREE

Contact me after payment to send you the User-Manual PDF File. Harmonic Trading The secret is the Fibonacci. It has been proven in the markets that price always reacts to Fibonacci levels. Fibonacci levels are one of the most important indicators of price changes. Sometimes the sequence of reactions to these levels in the chart make geometric shapes, which are called harmonic patterns. The price creates harmonic patterns with its fluctuation and reaction to Fibonacci levels. Harmonic patterns c

This indicators automatically draws the Support and resistances levels for you once you've dropped it on a chart. It reduces the hustle of drawing and redrawing these levels every time you analysis prices on a chart. With it, all you have to do is dropped it on a chart, adjust the settings to your liking and let the indicator do the rest. But wait, it gets better; the indicator is absolutely free! Get the new and improved version here: https://youtu.be/rTxbPOBu3nY Parameters Time-frame -> T
FREE

Free automatic fibonacci - это индикатор, который автоматически строит коррекции Фибоначчи, основываясь на количестве баров, выбранных в параметре BarsToScan. Линии Фибоначчи автоматически обновляются в реальном времени при появлении новых максимальных и минимальных значений среди выбранных баров. В настройках индикатора можно выбрать уровни, значения которых будут отображены. Также можно выбрать цвет уровней, что позволяет трейдеру прикреплять индикатор несколько раз с разными настройками и цве
FREE

The indicator builds a Renko chart in the sub window for the current symbol. The bars are formed from live data and the desired bar size can be set in the inputs tab. Most importantly, because the Renko chart only uses price to construct bars and ignores time, the indicator can be applied to any time frame and same results can be achieved. Recommended usage
As Renko charts are famous for eliminating noise so traders can use this tool to see clear picture of the trend to help their analysis, ent
FREE

Индикатор для скальпинга. Учитывает волатильность, движение цены на локальном промежутке, направление текущего тренда. Рекомендуется таймфрейм - М5. Преимущества: Низкая волатильность при появлении сигнала обеспечивает минимальное движение против открытой позиции. Индикатор не перерисовывает свои сигналы. Есть оповещения сигналов. Это отличный инструмент для внутридневной торговли. Подпишись на мой telegram канал, ссылка в контактах моего профиля .
Настройки: Наименование Описание Period П
FREE

MP Candle Countdown indicator with a progress bar is a tool used in technical analysis that displays the time remaining until the current candlestick on a chart closes, along with a progress bar that shows visually the amount of time that has elapsed since the candlestick opened. This indicator can be helpful for traders who use candlestick charting to make trading decisions, as it provides both a visual representation of the time left until a candlestick closes and an indication of how much ti
FREE

Индикатор MQLTA Supertrend Multi Timeframe сочетает в себе значения Supertrend, найденные на нескольких таймфреймах, чтобы подтвердить тренд пары. Для работы утилиты необходим бесплатный индикатор MQLTA Supertrend Line - https://www.mql5.com/en/market/product/25951.
Как он работает? Индикатор проверяет состояние Supertrend на всех выбранных таймфреймах и отображает результат в виде легко читаемой таблицы.
Как торговать с помощью индикатора Supertrend Multi Timeframe Покупку следует совершать
FREE

Heikin Ashi is Japanese for "average bar", and may make it easier for you to identify trends. Our version of this popular indicator adjusts the size of the candles based on the zoom level of your chart, making it appear more naturally just like the traditional candlesticks. The colors are selected based on the color scheme you use on your charts, but can be customized anyway you would like. You may also choose whether to display only the Heikin Ashi candles, or show the other selected chart as w
FREE

Омега-поддержка и сопротивление Уникальный индикатор для стратегий «купи дешево, продай дорого». Входы разворотного типа: когда цена поднимается до полной линии, ожидайте, что цена развернется/качается/развернется. Можно торговать 4 часа для междневных сетапов или ежедневно, еженедельно для долгосрочных входов. Высокоточный прогноз будущих цен для максимума или минимума любого продукта на недельных, дневных, 4-часовых и даже 1-часовых графиках. Лучше всего использовать индикатор цветной полосы
FREE

Индикатор Candle_Timer_and_Spread показывает на одном графике время до конца свечи и процент изменения цены вместе со спредом по выбранным символам.
Таймер времени до конца свечи по текущему таймфрейму и изменение цены в процентах относительно цены открытия дня по умолчанию расположен в правом верхнем углу графика. Панель показывает спред и процент изменения текущей цены относительно открытия дня для выбранных символов. Панель располагается по умолчанию в левом верхнем углу.
Входные настрой
FREE
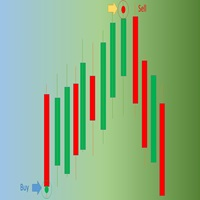
Wave_Entry_Alerts_In_EUR.mq4 is a custom indicator developed by Azad Gorgis for MetaTrader 4. This indicator is designed to provide alerts based on ZigZag patterns, specifically tailored for trading on the (EUR/USD) symbol.
Key Features: - Chart Window Indicator: The indicator is designed to be displayed on the main chart window. - Arrow Signals: The indicator generates arrow signals on the chart, indicating potential reversal points based on ZigZag patterns. - Customizable Parameters: Trader
FREE

This is the free version of the Supply&Demand + Trendline + Trend tool. This version works only with EURCHF! You find the full version here: https://www.mql5.com/en/market/product/67274
PAAIOS stands for Price Action All In One Solution. And that is the purpose of the Indicator. It should give you a tool to improve your trading decisively because you get the crucial information at a glance. The indicator simplifies the search for strong signals. It shows trend lines, demand and s
FREE
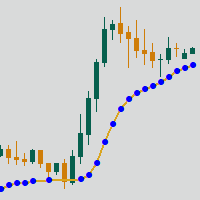
Adaptive Moving Average (AMA) — трендовый индикатор, использующий скользящую среднюю и фильтр рыночного шума. Особенностью индикатора являются точки синего и красного цветов, показывающие силу тренда.
Рекомендации по торговле:
Вспомогательный индикатор Определение тренда Определение силы тренда Определение потенциальной точки разворота Главный индикатор Показывает точки входа свинг-торговли Выступает динамической поддержкой и сопротивлением Рекомендации по использованию: Любой инструмент Люб
FREE

Break It Down основан на индексе направленного движения (Directional Movement Index), который сообщает о том, что рыночный тренд вероятнее всего насыщен и готов к ослаблению. Эта модель более предсказуема при применении этой системы во время ралли на рынке, но в пределах торгового диапазона. Поскольку трейдеры распродают в страхе, что рынок часто движется быстрее, когда снижается! Когда это происходит, могут возникнуть хорошие движения. Так как трейдеры больше не заинтересованы в тренде, объем б
FREE
Highly configurable Stochastic indicator.
Features: Highly customizable alert functions (at levels, crosses, direction changes via email, push, sound, popup) Multi timeframe ability Color customization (at levels, crosses, direction changes) Linear interpolation and histogram mode options Works on strategy tester in multi timeframe mode (at weekend without ticks also) Adjustable Levels Parameters:
Stochastic Timeframe: You can set the lower/higher timeframes for Stochastic. Stochastic Bar
FREE

RaysFX TMAT3 è uno strumento potente che combina due tipi di medie mobili per aiutarti a identificare e seguire le tendenze del mercato. L’indicatore utilizza una media mobile triangolare centrata (TMA) e un T3 Moving Average. Queste due medie mobili lavorano insieme per fornire segnali di trading chiari e tempestivi. Quando il T3 Moving Average è inferiore alla TMA, l’indicatore considera che la tendenza del mercato sia al rialzo e genera un segnale di acquisto. Al contrario, quando il T3 Movin
Download the free version here.
A Full Concept of BUY/SELL Scalping Strategy Trend detection is one of the basic challenges of every trader. Finding a way to tell when to enter a trade is very important, timing is a game changer, not too early and not too late. Sometimes, due to not knowing the market conditions, the trader closes his positions with a small profit or allows the losses to grow, these are the mistakes that novice traders make. Indicator Trend Whipper is a complete trading st

BeST Oscillators Collection is a Composite MT4 Indicator including the Chaikin,Chande and TRIX Oscillators which by default are contained in MT5 but not in MT4 platform. It also provides the option of displaying or not a Mov. Avg. as a Signal Line and the resulting Signals as Arrows in a Normal (all arrows) or in a Reverse Mode (without showing up any resulting successive and of same type arrows). Analytically for each one of the specific Oscillators: The Chaikin Oscillator ( CHO ) is
FREE

A combined indicator of two famous indicators: RSI , Bollinger Bands Can be used in all currency pairs Can be used in all time frames with many signals Very simple and fast to use
Description:
This indicator is made from the combination of RSI and Bollinger Bands indicators
As you can see, it shows good signals and is worth using and testing
We hope you are satisfied with this indicator
Settings: show past show candle: Displays the number of candles that the indicator calculates.
For
FREE

Introduction This indicator detects volume spread patterns for buy and sell opportunity. The patterns include demand and supply patterns. You might use each pattern for trading. However, these patterns are best used to detect the demand zone (=accumulation area) and supply zone (=distribution area). Demand pattern indicates generally potential buying opportunity. Supply pattern indicates generally potential selling opportunity. These are the underlying patterns rather than direct price action. T
FREE
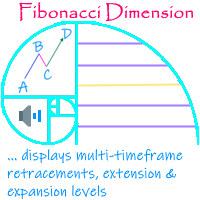
'Fibonacci Dimension' indicator allows display of preset or user-defined multi-timeframe Fibonacci levels. It automatically takes the previous high and low for two user-defined timeframes and calculates their Fibonacci retracement levels. It also considers the retraced level to draw the expansions on every change of price. A complete visual dimension in multiple timeframes allows deriving profitable strategies for execution. The functionalities included are: Provides an option to consider a pres
FREE

This is a trend indicator.
Timeframe: any Symbol: any Color meaning: blue: long trend, up trend red: short trend, down trend yellow: market trend is changing Feature: 1, very easy to use, obvious signal, profitable 2, suitable to work on charts of any timeframe 2, all type of alerts 3, standard data buffers, can be easily implanted into any EA program. 4, all color customizable.
wish you like it :)
FREE
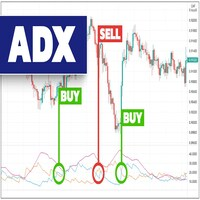
The indicator provides buy and sell signals on the charts every time ADX DI- and DI+ crosses each other. Blue arrow for uptrend (DI+>DI-). Red arrow for downtrend (DI->DI+). This technical analysis tool can be applied to various trading strategies. The ADX Crosses Signals Indicator is based on the Average Directional Index Metatrader Indicator. The ADX is a lagging indicator, meaning that a trend must already be established before the index can generate its signal.
Inputs PERIOD; AlertOn
FREE

Профессиональный инструмент для торговли - индикатор дивергенции между RSI и ценой, позволяющий своевременно получать сигнал о развороте тренда или ловить движения откатов цены (в зависимости от настроек). Настройки индикатора позволяют регулировать силу дивергенции за счет угла наклона пиков RSI и процентного изменения цены, что даёт возможность тонко настроить силу сигнала. Код индикатора оптимизирован и в составе советника очень быстро тестируется. Индикатор не перерисовывает, стрелки для
FREE
MetaTrader Маркет - торговые роботы и технические индикаторы для трейдеров, доступные прямо в терминале.
Платежная система MQL5.community разработана для сервисов платформы MetaTrader и автоматически доступна всем зарегистрированным пользователям сайта MQL5.com. Ввод и вывод денежных средств возможен с помощью WebMoney, PayPal и банковских карт.
Вы упускаете торговые возможности:
- Бесплатные приложения для трейдинга
- 8 000+ сигналов для копирования
- Экономические новости для анализа финансовых рынков
Регистрация
Вход
Если у вас нет учетной записи, зарегистрируйтесь
Для авторизации и пользования сайтом MQL5.com необходимо разрешить использование файлов Сookie.
Пожалуйста, включите в вашем браузере данную настройку, иначе вы не сможете авторизоваться.