Смотри обучающее видео по маркету на YouTube
Как купить торгового робота или индикатор
Запусти робота на
виртуальном хостинге
виртуальном хостинге
Протестируй индикатор/робота перед покупкой
Хочешь зарабатывать в Маркете?
Как подать продукт, чтобы его покупали
Технические индикаторы для MetaTrader 4 - 15

The Supertrend draws a line following the current trend.. Green Line under the candle means a likely bullish trend Red Line above the candle means a likely bearish trend
How to trade with SuperTrend indicator Buy when the Supertrend Green line is below the price, Sell when the Supertrend Red line is above the price. It is strongly suggested to use this indicator in a trending market.
Parameters Multiplier - the lower it is and the more sensitive is the line, meaning it will follow the price
FREE

Introduction RSI divergence is a main technique used to determine trend reversing when it’s time to sell or buy because prices are likely to drop or pick in the charts. The RSI Divergence indicator can help you locate the top and bottom of the market. This indicator finds Regular divergence for pullback the market and also finds hidden RSI Divergence to show continuing trend. This indicator shows divergence on the RSI that is a strong hint for an excellent entry point and finds immediately with
FREE

MP Candle Countdown indicator with a progress bar is a tool used in technical analysis that displays the time remaining until the current candlestick on a chart closes, along with a progress bar that shows visually the amount of time that has elapsed since the candlestick opened. This indicator can be helpful for traders who use candlestick charting to make trading decisions, as it provides both a visual representation of the time left until a candlestick closes and an indication of how much ti
FREE
This indicator informs the user when the ATR is above a certain value defined by the user, as well as when the ATR prints a percentage increase or percentage decrease in its value, in order to offer the user information about the occurrence of spikes or drops in volatility which can be widely used within volatility-based trading systems or, especially, in Recovery Zone or Grid Hedge systems. Furthermore, as the volatility aspect is extremely determining for the success rate of any system based o
FREE
Данный индикатор основывается на работах легендарного трейдера Вильяма Ганна, а точнее на математических моделях используя данные прошлых дней. Он рассчитывает потенциальное время разворота по выбранным парам на текущий день. Время отображается на будущее, на открытие дня и больше не изменяется. Так же данный индикатор оснащен алертами когда приходит потенциальное время. В индикатор встроен алгоритм возможного движения цены . Когда приходит время подается алерт, а так же изменяется цвет строки

ALQANNAS (Sniper) Indicator Overview: Welcome to ALQANNAS, your ultimate sniper in the forex market! ALQANNAS is a powerful and versatile trading indicator designed to enhance your trading experience. Whether you're a beginner or an experienced trader, ALQANNAS provides you with accurate non repainting signals, trend direction and strength, and advanced features to elevate your trading strategy. Key Features: Buy and Sell Signals: ALQANNAS is equipped with a sophisticated algorithm that genera

本指标 基于 Zigzag 基础上... 增加了: 1.增加了箭头指示,使图表更鲜明 2.增加了价格显示,使大家更清楚的看清价格. 3.增加了报警等设置,可以支持邮件发送 原指标特性: 1.基本的波段指标构型. 2.最近的2个ZIGZAG点不具有稳定性,随着行情而改变,(就是网友所说的未来函数) 3.原指标适合分析历史拐点,波段特性,对于价格波动有一定的指导性.
Zigzag的使用方法一 丈量一段行情的起点和终点 (1)用ZigZag标注的折点作为起点和终点之后,行情的走势方向就被确立了(空头趋势); (2)根据道氏理论的逻辑,行情会按照波峰浪谷的锯齿形运行,行情确立之后会走回撤行情,回撤的过程中ZigZag会再次形成折点,就是回撤点; (3)在回撤点选择机会进场,等待行情再次启动,止损可以放到回撤的高点。 一套交易系统基本的框架就建立起来了。 Zigzag的使用方法二 作为画趋势线的连接点 趋势线是很常见的技术指标,在技术分析中被广泛地使用。 但一直以来趋势线在实战中都存在一个BUG,那就是难以保证划线的一致性。 在图表上有很多的高低点,到底该连接哪一个呢?不同的书上画趋势线的方
FREE

Индикатор показывает сигналы на покупку и продажу в соответствии с определением торговой зоны, данным Биллом Вильямсом. Прост в использовании и интерпретации Избегает флета Детерминистский индикатор с четкими правилами Не перерисовывается Доступны все типы алертов Согласно Биллу Вильямсу, торговля в пределах зоны позволяет максимизировать/удвоить/утроить прибыль при движении рынка в нужную сторону, а именно, когда импульс, ускорение и цена подтверждают сильный тренд или период ускорения. Распола
FREE

Description:
This indicator (with its algorithm) marks relative highs and lows, which have an array of useful applications.
This indicator will never repaint.
Features:
Marks relative highs and lows Use this to determine points of trend continuation i.e. where the trend may pull back before continuing higher or lower, past this point Or use this to determine potential points of reversal, particularly in ranging markets, or with other price action These highs and lows can sometimes
FREE

SX Price Action Patterns is a comprehensive indicator which shows various price action patterns on the chart for those who are interested in price action trading. These patterns are as follows: A Pin Bar is a candlestick price bar, which has a long wick on one side and a small body. It is a powerful signal of price reversal in a currency trading strategy. An Inside Bar is characterized by a bar or candle that is entirely ‘inside’ the range of the preceding one and represents the consolidation o
FREE

Точный торговый анализ у вас под рукой: программное обеспечение для анализа торговли нового поколения Основное программное обеспечение для анализа торговли, доступное на рынке, часто предоставляет только почасовую или еженедельную статистику коэффициента прибыли и убытков, что не отвечает требованиям более точного анализа торговли. Однако на реальном торговом рынке каждый день складываются уникальные обстоятельства. Понедельники тихие, среды активные с тройным овернайт-процентом, а пятницы искл
FREE
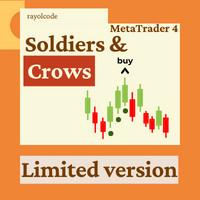
This indicator accurately identifies and informs market reversals and continuation patterns by analyzing and signaling the Three White Soldiers / Three Black Crows pattern. User-friendly interface and multi-asset compatibility Fully customizable parameters and colors Does not repaint Can be easily convert its signals into an Expert Advisor. Full support granted.
FOR MT4 FULL VERSION: CLICK HERE
What is the Three White Soldiers / Three Black Crows price action pattern The Three White Soldi
FREE

Informative & optimized Zigzag, Accumulated volume, Price change A rewrite of the traditional zigzag tool with new additions. Features:- Optimized code Displays accumulated volume between peaks Displays price change between peaks Usage:- Identify trend swings Identify high volume swings Compare price changes between swings Drawing Fibonacci tool on strong price change or high volume swings
FREE

RECOMMEHDATION Trade with this indicator for 2-3 weeks and you will feel significant progress in your trading. This indicator is developed based on the use of HMA, Laguerre, CCI . Indicator will help you: accurately enter the market; reduce the number of errors when opeinng orders; visually see market movement; predict price movement(in absent of significant news); do not rush to close profitable trades prematurely and increase profit; do not rush to enter the market and wait for "easy prey".
FREE

Или CKC.
Этот индикатор работает в зависимости от классического правила десятидневной скользящей средней, описанного Честером В. Келтнером (1909–1998). По умолчанию все параметры настроены на классическую версию системы Кельтнера, при этом пользователь может изменить их по своему желанию. Важная информация
Прочтите руководство CKC: https://www.mql5.com/en/blogs/post/736577 Пример советника CKC: https://www.mql5.com/en/blogs/post/734150
О формуле канала Келтнера
1. Рассчитайте центральную л
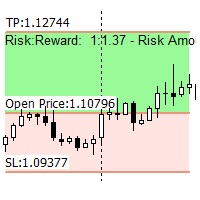
This is a useful tool to plan a trade risk to reward visually. The indicator is very simple to use with minimum settings. Long or Short You can use the indicator for both long and short positions.
Lot Size Calculator You can also use this indicator as a lot size calculator. If you set the risk amount the indicator will calculate the lot size for you based on the stop loss line. You do not need to calculate the lot size manually. Free Version Free versions works fully on EURUSD pair. For oth
FREE

As per name Strength, This Indicator is a affordable trading tool because with the help of Popular Developers & Support of M Q L Platform I have programmed this strategy. I tried to input different types and different periods of Calculation regarding Support Resistance, Trends, Trend lines, Currency Strength, Oversold and Overbought Indications for good results. Furthermore, I have also care about Adjustable Settings So Trader can easily get in touch with market in another way also. What
FREE

Реализация известного индикатора SuperTrend. Индикатор позволяет увидеть значения, на которых срабатывают оповещения индикаторов SuperTrend Scanners:
SuperTrend Scanner SuperTrend Scanner FREE
Параметры SuperTrendATRPeriod: период для расчета значения SuperTrend SuperTrendMultiplier: множитель для расчета значения SuperTrend
FREE

Ищет точки входа по локальному тренду без перерисовки! Стрелками отображаются точки входа. Основан на классических индикаторах. Индикатор легкий в использовании. Подпишись на мой telegram канал, ссылка в контактах моего профиля . Настройки Наименование Описание Frequency factor Частота сигнала. Чем меньше, тем чаще.
Соответственно, это влияет на качество.
Рекомендации: Рекомендуется использовать на мажорных валютных парах. Таймфрем от м5, м15, м30
FREE

TwoMA Crosses indicator displays arrows based on whether the short term moving average crosses above or below the long term moving average. A moving average doesn't predict price direction. Instead, it defines the current direction. Despite this, investors use moving averages to filter out the noise. Traders and investors tend to use the EMA indicator, especially in a highly volatile market because it’s more sensitive to price changes than the SMA.
Download for FREE TwoMA Crosses EA from th
FREE

This indicator is a simple tool to spot a possible trend.
When the ribbon below the price bars, It will turn to Green color and the trend is seen to be bullish When the ribbon above the price bars, it will turn to Red color and the trend is seen to be bearish. It can be used a either Entry Signal Exit Signal or trailing stop, so it is very versatile. By default color : Green is UP trend and Red is Down trend and this work perfect with Bar4Colors.ex4
FREE
Эта программа сделает анализ нескольких таймфреймов более удобным.
Это поможет синхронизировать все графики на разных графиках синхронизации таймфреймов, чтобы отображать один и тот же символ, тот же определенный период времени и синхронизация объектов чертежа Показать на всех диаграммах одновременно
Поддержка синхронизации объектов: вертикальная/горизонтальная линия, линия тренда, прямоугольник, стрелка, коррекция Фибоначчи
Дополнительная функция: оповещение о линии тренда
Как им польз
FREE

The indicator shows divergence between the slope of lines connecting price and MACD histogram peaks or troughs. A bullish divergence (actually a convergence) occurs when the lines connecting MACD troughs and the lines connecting the corresponding troughs on the price chart have opposite slopes and are converging. A bearish divergence occurs when the lines connecting MACD peaks and the lines connecting corresponding price peaks have opposite slopes and are diverging. In such a case, the indicato

Presenting the uGenesys Break of Structure and Change of Character Indicator The uGenesys Market Structure Indicator is the advanced solution designed specifically for forex traders seeking a competitive edge. This innovative tool goes beyond merely identifying Break of Structure (BoS) and Change of Character (CHoC); it also illuminates optimal entry and exit points on your forex charts, transforming your trading experience.
While the uGenesys Market Structure Indicator can reveal pivotal pa
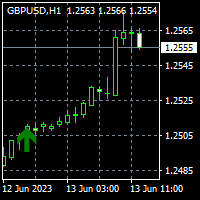
To get access to MT5 version please click here . This is the exact conversion from TradingView: "UT Bot Alerts" by "QuantNomad". This is a light-load processing and non-repaint indicator. Buffers are available for processing in EAs. Candle color option is not available. You can message in private chat for further changes you need. Here is the source code of a simple Expert Advisor operating based on signals from UT Bot Alerts . #property strict input string EA_Setting= "" ; input int magic_numb

SmartChanel - универсальный индикатор для всех типов рынка. Данный индикатор должен иметь в своем арсенале каждый трейдер, так как он представляет собой классический подход к анализу цены торгового инструмента и является готовой торговой стратегией. Индикатор формирует верхний, средний предел движения цены.
Преимущества индикатора работает с любым торговым инструментом работает на любом временном периоде можно использовать как на классическом рынке, так и на рынке бинарных опционов индикатор н

The Swing Hit Perfect Master Indicator for MT4 displays accurate buy and sell signals on the chart and is no repaint and can be used on any pair, gold and indices. It's all in one the best indicator Swing and trend detection and is able to make precise entries. The indicator for MT4 points dots on the chart arrow after the swing high and low is maintained and takes perfect entries with the trend. The template shows the lows and highs of the market. They mark good entry and exit points. The blue

Draw and Sync Objects Multiple Charts 1. Draw objects by key press. ( You must: 1. Press Function key => 2. Click where you want to draw => 3. Draw it => 4. Press ESC to complete). (If you don't want to draw after pressing function key, you must press ESC to cancel). 2. Developing : Sync selected objects to multiple charts by button. 3. Developing: Hide objects that do not belong to the current symbol (Objects drawn with this indicator will belong to the symbol they are plotted
FREE

Check my p a id tools they work perfect please r ate Here is an Upgraded version with Bonus Ea in case of purchase it costs 30$ only and you get Ea as Bonus: https://www.mql5.com/en/market/product/96835 This indicator is experimetal, it shows TMA channel arrows with Volatility filter built in to avoid lagging. Try to experiment with it, search for better conditions of use. It is possible to adjust different timeframes for TMA and for Volatility filter Same time on the current chart, so it ma
FREE

. Simple Trading System Update !!! Follow this link to see our Strategy !!! (With auto trade indicator)
Description This is an indicator Free Version and showing only history signals, Not real time. Binary Deal Trading Indicator is an indicator on MT4 for Binary Option Trading. It forecasts the overbought / oversold level, Reversal and Fractal point. This indicator will help you to decide a reversal price on any time frame (Recommend M1, M5 and M15). The expiry time is 5-15 minutes after re
FREE

Отличный полезный инструмент, с помощью которого вы можете в режиме реального времени отслеживать рост вашего счета и распространение символа. Это будет знать, как точно идентифицировать данные, чтобы знать, например, есть ли у вас учетная запись Prop Firm, чтобы знать правильный Laverage, манипулируют ли спредом и т. д., чтобы сделать точный лот.
Сочетание кредитного плеча и индикатора спреда. Инструменты для автоматической проверки кредитного плеча и спреда на вашем торговом счете. Работа в
FREE

Pivot Classic, Woodie, Camarilla, Fibonacci and Demark Floor/Classic Точки разворота или просто развороты полезны для определения потенциальных уровней поддержки/сопротивления, торговых диапазонов, разворотов тренда и настроений рынка путем изучения максимума, минимума и значений закрытия актива. Точки разворота Floor/Classic можно рассчитать следующим образом. Pivot Point (P) = (High + Low + Close)/3 S1 = P * 2 - High S2 = P - (High - Low) S3 = Low – 2*(High - P) R1 = P * 2 - Low R2 = P + (H
FREE

BIG CANDLE ALERT https://www.mql5.com/en/users/earobotkk/seller#products P/S: If you like this indicator, please rate it with 5 stars in the review section, this will increase its popularity so that other users will be benefited from using it. This indicator draws a bullish and bearish vertical line inside a candle whenever the size of a candle body exceeds the minimum size specified in the input. INPUT Bullish Candle Color: choose the color of your choice. Bearish Candle Color: choose the co
FREE
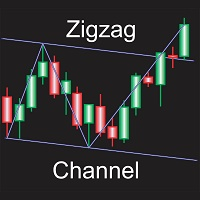
Automatically draws channel base on zigzag, with option to draw zigzag based on candle wicks or close prices. All zigzag parameters can be adjusted in settings, option to display or hide zigzag also available, every other adjustable settings are self explanatory by their name, or at least so I believe. Only download this indicator if you need a program to automatically plot channels for you based on zigzag of any specific settings.
FREE

Индикатор ищет консолидацию(флэт) на рынке в определенное время, строит коробку-канал и отмечает уровни с отступом от него на пробой. После пересечения одного из уровней индикатор отмечает зону для тейкпрофита и считает соответствующий профит или убыток в направлении данного входа на панели. Таким образом, индикатор, подстраиваясь под рынок, находит флэтовый участок с началом трендового движения для входа в него. Версия для МТ5: https://www.mql5.com/ru/market/product/58380
Преимущества:
уник
FREE

Этот индикатор представляет собой метод анализа рынка, основанный на статье «Математическая формула для прогнозов рынка», написанной У.Д. Ганном, в зависимости от метода квадрата девяти и квадрата 144.
Руководство пользователя: Add Your review And contact us to get it
Вы можете купить полную версию MT5 у:
https://www.mql5.com/ru/market/product/28669
Вы можете бесплатно протестировать на МТ4:
https://www.mql5.com/en/market/product/15316
Этот продукт может нарисовать для вас к
FREE

Advanced Bollinger Bands Scanner is a multi symbol multi timeframe Bollinger bands dashboard that monitors and analyzes the Bollinger Bands indicator from one chart. This panel monitors the Bollinger bands indicator in up to 28 configurable instruments and 9 timeframes for price overbought/oversold, price consolidation (Bollinger bands squeeze), and consolidation breakout (squeeze break) with a deep scan feature to scan all market watch symbols (up to 1000 instruments!).
Download Demo here

Asesor Experto "Sniper FX": Precisión Milimétrica para Tus Operaciones El asesor experto "Sniper FX" redefine la precisión en el trading automatizado al ofrecer un enfoque estratégico centrado en pocas, pero extraordinariamente precisas, entradas en el mercado. Inspirado por la agudeza de un francotirador, este asesor experto utiliza algoritmos avanzados para identificar oportunidades óptimas de compra y venta, maximizando el potencial de beneficios mientras minimiza la exposición al mercado.
FREE

See RSI values turned into colored candles
This indicator provides both colored candles and a colored moving average. 6 drawaing styles are provided to allow customization of the color coding.
Applying coding to the chart may help in conceptualizing price trend and impulse movements defined through RSI values.
Features - optional colored candles - optional colored ma - 6 draw styles; RSI slope RSI above/below overbought/oversold levels RSI above/below level 50 RSI above/below it's moving aver
FREE

Автоматически сканирует график, чтобы найти гармонические паттерны, и дает вам возможность войти на раннем этапе в хорошие операции. Кроме того, если этот параметр выбран, он будет предупреждать вас заранее, когда появятся будущие шаблоны, показывая вам проекцию возможного будущего шаблона. Основная цель этого алгоритма - с высокой точностью определить момент, когда тренд заканчивается и начинается новый. Предлагаем вам лучшую цену при развороте. Мы добавили «Золотую сделку», определяем

Индикатор отображает в виде стрелок пересечение индикатора Скользящая Средняя Осциллятора (Moving Average of Oscillator, OsMA) нулевого уровня. Индикатор является мультитаймфреймовым и отображает сигналы с других временных интервалов В индикаторе есть уведомление при появлении сигнала - всплывающее окно (Alert), отправка на EMail.
Параметры Time-frame - Выбор временного интервала для отображения сигналов индикатора. Fast EMA Period - Быстрое EMA – скользящая средняя от цены, экспоненциального
FREE

The Pivot Indicator is a vital tool for technical analysis used by traders in the financial markets. Designed to assist in identifying potential reversal points or trend changes, this indicator provides valuable insights into key levels in the market. Key features of the Pivot Indicator include: Automatic Calculations: The Pivot Indicator automatically calculates Pivot Point, Support, and Resistance levels based on the previous period's high, low, and close prices. This eliminates the complexity
FREE

Статистика панели управления учетной записью
Это инструмент, который поможет вам иметь сфокусированное представление, чтобы узнать о прибылях и убытках вашего счета, чтобы вы могли отслеживать их, а также проводит анализ просадки, чтобы узнать полученный риск. Скачав и активировав его в личном кабинете, вы должны привязать его к любому символу например EURUSD H1, тогда с этого момента инструмент начнет отслеживать вашу статистику
панель полностью расширена, ее можно скрыть и переместить куд
FREE

Сканер показывает значения тренда на основе пересечения двух скользящих средних. Значения отображаются на нескольких символах (до 30) и 8 таймфреймах. Уведомляет о смене направления тренда в терминале MetaTrader 4, по email и push-уведомлением.
Важная информация Для максимального использования потенциала сканера прочитайте полное описание (на английском языке): www.mql5.com/en/blogs/post/718074
Есть различные способы использования сканера SuperTrend Scanner. Вот два примера: Сканера позволяе
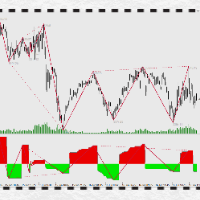
Introduction to PowerTrapezoid:
The application of market Power deviation system is not a secret, such as volume price deviation, MACD deviation, Chanlun deviation and so on. However, how to correctly understand and calculate, and accurately judge the increase or decrease of POWER is a threshold in application, which is difficult to cross with the conventional system. How to avoid reciting? How to implement multi level backflow parallel computing? How to intuitively show the range of backtrac
FREE

Entry and Exit indicator simplifies the trading process by automatically providing the entry price and the take profit price with the appropriate stop loss. The indicator constantly monitors the market for the right entry conditions and send outs signals via push notifications to the trader's mobile phone or pc as desired. Hence a trader do not need to watch the chart all day but only act when signals are sent. This indicator is built around the 'H4 Engulfing System' and the 'Triple Stochastic S

In statistics, Regression Channel is a approach for modelling the relationship between a scalar response (or dependent variable) and one or more explanatory variables (or independent variables).We Applied relative strength index(rsi) values to develop regression models of various degrees in order to understand relationship between Rsi and price movement. Our goal is range prediction and error reduction of Price divergence , thus we use Rsi Regression

Simple Trading System Update !!! Follow this link to see our 2024 Strategy !!! ( Download the EAs scanner )
INTRODUCTION : The strength meter is an trading tool that is used to identify trending and consolidating markets based on the percentage rate.
HOW TO USE IT :
You can use this indicator with Deal Trading Trend >> Click Here << To use this trading tool to identify trending and consolidating markets (the most important part)
FREE
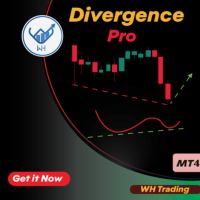
Готовы ли вы вывести свою торговлю на новый уровень? Представляем WH Дивергенция Про MT4 ,
продвинутый индикатор дивергенции, который позволяет вам выбирать из множества популярных технических индикаторов.
Теперь вы можете адаптировать сигналы дивергенции в соответствии с вашей уникальной торговой стратегией. Свяжитесь со мной после покупки, чтобы помочь вам в процессе Ключевая особенность :
Выбор индикатора : выберите предпочитаемый индикатор из следующих вариантов: RSI (
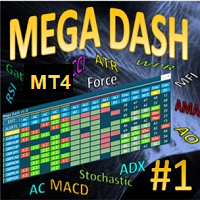
Create Unlimited Dashboards Each dashboard can be upto 28 Symbols x 24 Indicators. Mix and match from 23 leading indicators and all timeframes, to create unlimited unique dashboards. Create Group Alerts to be alerted when your chosen indicators are all aligned.
32 customizable trading strategy alerts (Trend, Breakout, Overbought, Oversold, Thresholds, Saucers etc). Scalper, Day or Long Term Trader? Mega Dash has you covered, design your dashboard to suit your trading style. Mega Dash is proba

Индикатор PipTick OHLC показывает текущие и исторические значения минимума, максимума, открытия, закрытия и средне цены на выбранном периоде. Он может отображать текущие значения или значения за предыдущую сессию. Диапазоном для расчета индикатора может быть дневная, недельная, месячная или любая выбранная пользователем сессия.
Уровни Максимум текущей или предыдущей сессии. Минимум текущей или предыдущей сессии. Открытие текущей или предыдущей сессии. Закрытие текущей или предыдущей сессии. Ср
FREE

This indicator shows the direction of the trend and trend change. Ganesha Trend Viewer is a trend indicator designed specifically for gold and can also be used on any financial instrument. The indicator does not redraw. Recommended time frame H1. Ganesha Trend Viewer is perfect for all Meta Trader symbols. (currencies, metals, cryptocurrencies, stocks and indices..) MT5 Version here!
Parameter setting
MA Short Period ----- Moving Average short period MA Long Period ----- Moving Average l
FREE

Price Breakout pattern Scanner - это полностью автоматический и мощный анализ для трейдеров и инвесторов. Он определяет следующие паттерны на графике. Голова и Плечи - Распространенный паттерн для торговли. Обратная Голова и Плечи - эта модель обратна паттерну Голова и плечи. Двойная вершина - когда цена дважды достигает уровня сопротивления и снизится к уровню поддержки, трейдер может ожидать внезапный медвежий прорыв уровня поддержки. Двойное дно - двойное дно является противоположностью формы

YOU CAN NOW DOWNLOAD FREE VERSIONS OF OUR PAID INDICATORS . IT'S OUR WAY OF GIVING BACK TO THE COMMUNITY ! >>> GO HERE TO DOWNLOAD Most of the time, market reversals / pull backs usually follow volume and price spikes thus these spikes could be the first indication of an exhaustion and possible reversal/pullback. High volume Turns is an indicator that scans the market for price and volume spikes around over-bought/over-sold market conditions. These spikes when spotted serves as the first ind
FREE
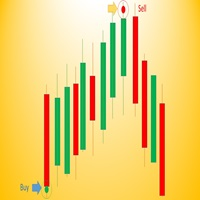
Wave Entry Alerts In Gold is a custom indicator developed by Azad Gorgis for MetaTrader 4. This indicator is designed to provide alerts based on ZigZag patterns, specifically tailored for trading on the Gold (XAU/USD) symbol.
Key Features: - Chart Window Indicator: The indicator is designed to be displayed on the main chart window. - Arrow Signals: The indicator generates arrow signals on the chart, indicating potential reversal points based on ZigZag patterns. - Customizable Parameters: Trad
FREE

This automated DOJI BAR FINDER INDICATOR can be utilized to manage trades and identify potential areas of support and resistance for both buying and selling. It is designed to identify zones for Sell/Buy trades and can be effectively used in conjunction with other indicators, such as order block indicators, and more. Currently designed for MT4, it will later be adapted to function on MT5. We also offer the opportunity to customize the robot according to your trading strategy. https://t.me/FXTSPr
FREE

Принципы построения индикатора. Индикатор Absolute Bands ( AB ) напоминает своим видом и функциями индикатор Bollinger Bands , но только более эффективен для торговли из-за существенно меньшего количества выдаваемых им ложных сигналов, что обусловлено его более робастным характером. В индикаторе Bollinger Bands по обе стороны от скользящего среднего – Ma откладываются среднеквадратичные отклонения Std=Sqrt(<(X- Ma )^2>) (где X - история цены, <…> - процедура усред
FREE

How To Trade
Execute your trades in 3 Easy Steps!
Step 1: Trade Setup Entry Buy in Line color Blue Touch on line color Red. Entry Sell in Line color Blue Touch on line color Green. Success Rate ≥ 80% 100:20 depend your experience and fast your take. Step 2: Set Stop Loss Stop loss BUY ----> You can not put stoploss with a fixed price, your speed in determining the closing request------>Line color Blue Touch on line color Green. Stop loss SELL ----> You can not put stoploss with a fixed price,
FREE

Индикатор Currency Strength Matrix (CSM) показывает текущую силу основных валют на нескольких таймфреймах, позволяя сортировать валюты по силе и обнаруживать потенциально прибыльные пары. Индикатор идеален для скальпинга и во время резких сильных движений.
Как она работает? CSM сравнивает значение текущей скользящей средней с такое же скользящей средней на предыдущей свече для всех 28 пар и 9 таймфреймов, формируя таблицу силы всех отдельных валют. Затем валюты сортируются по силе на определен
FREE
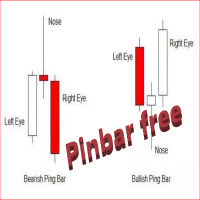
The Free Pin Bar MT4 indicator identifies Pin Bars It will even give you sound or email alerts if want them. If you download it and like it please leave a review! It would be wonderful
Pin Bars are purely based on price action as reflected by the candle formations created by Forex price movements. input Parameters are maximum allowed body/length ratio for the Nose bar. Nose body should be position in top (bottom for bearish pattern) part of the Nose bar. tells the indicator that the Left E
FREE
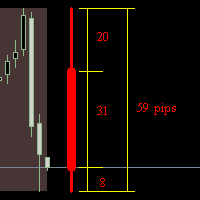
Индикатор 'рисует' дневную, недельную или месячную свечу на текущем графике. Показывает в пунктах размеры верхней и нижней тени, тела и всей свечи. Работа в реальном времени. Работает в тестере стратегий. Параметры индикатора: How_much_to_show - сколько показать блоков. Block_period - период блока (день/неделя/месяц)
Shift - смещение от края графика в барах. language - выбор языка.
FREE

"Five Minute Drives" indicator that is designed to be used in the 5 minute timeframe. One of its most important advantages is that it shows the general trend in the upper time frames when looking at the 5-minute timeframe. Therefore, when opening positions in the 5 minute timeframe, when it is in line with the trends in the upper timeframes, you are less likely to be upside down. If you can evaluate breakout/breakdown opportunities between the curves on the graphic screen with your geometric per
FREE

SPREADEX e' un indicatore per MT4 e MT5 che indica la distanza dell'ASSET dal GP. il GP e' il prezzo del vero valore dell'ASSET sottostante ottenuto per stima. Il GP e' come una calamita, attira il prezzo dell'ASSET con alta probabilita' ed all'interno della stessa giornata di trading. Quindi SPREADEX indica quali sono gli asset piu distanti dal GP al momento in tempo reale. Fornendo un punto di vista al TRADER su quali asset concentrarsi e cercare eventuali segnali di inversione dei prezzi per
FREE

*This is TradingView indicator converted to mql4*
The SuperTrend V indicator is a popular technical analysis tool used to identify trends and potential trend reversals in financial markets. It is based on the concept of the SuperTrend indicator but incorporates additional features and variations. The SuperTrend V indicator uses a combination of price action and volatility to determine the trend direction and generate trading signals. Here are the key components and features of the indicator:
FREE
Индикатор линий сил валют (Currency Strength Lines, CSL) - это весьма полезный инструмент как для начинающих, так и для опытных трейдеров. Он способен рассчитывать силы одиночных валют и отображать их на графике, чтобы вы могли видеть тренд и замечать торговые возможности.
Как она работает? Индикатор CSL проводит расчеты на 28 парах, показывая общую силу по всем одиночным валютам на рынке в любой заданный момент. Вы можете использовать эти данные для определения валют, которые сильны, усиливаю
FREE

Defining Range ( DR ) and Implied Defining Range ( IDR ) indicator
Show DR and IDR ranges on the chart for Regular , Overnight and After Sessions
for more information how DR and IDR work and the high probability watch : https://www.youtube.com/@themas7er or https://twitter.com/IamMas7er
Remember to set set your chart TimeZone when you attach indicator to the chart under indicator settings / inputs
Volume Imbalance : https://www.mql5.com/en/market/product/91165?source=Site+Pr
FREE
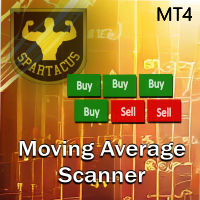
Moving Average Scanner — это многокадровый сканер, который идеально подходит для быстрого просмотра тренда на нескольких таймфреймах без изменения графика.
Он может использовать до 4 скользящих средних по вашему выбору за 9 единиц времени. Он полностью настраиваемый и может быть перемещен в любое место графика простым «перетаскиванием».
Скользящие средние можно настроить в 4 различных методах расчета. Вы также можете установить оповещения на основе количества скользящих средних и количеств
FREE

This comprehensive technical indicator calculates and plots up to 3 moving averages with 3 different periods. By employing three moving averages of distinct lookback periods, the trader can confirm whether the market has indeed experienced a change in trend or whether it is merely pausing momentarily before resuming its prior state. SX Golden MA Pack for MT5 is available here . The shorter the moving average period, the more closely it tracks the price curve. When a security initiates an upt
FREE

Price Channels are also known as Donchian Channels being named after Richard Donchian. They use the highest and lowest price of a set number of periods to create an upper and lower channel or envelope around the price. The upper channel shows the high of the number of periods chosen. The lower channel shows the low of the number of periods chosen. For example, the screenshot shows the Price Channels using 320 periods. The upper channel in the screenshot shows the highest high of the previous 3
FREE

Martingale Arrow — это индикатор mt4 типа стрелки, предназначенный для торговли бинарными опционами по мартингейлу. Эта стрелка печатается на открытом/внутри баре и выдает предупреждение. КАК ИСПОЛЬЗОВАТЬ: откройте сделку, когда появится стрелка момента. Если сделка выиграла, дождитесь следующего сигнала и торгуйте тем же лотом. Если сделка теряет двойной лот по следующему сигналу и продолжаете делать это до тех пор, пока сигнал не выиграет, затем выполните сброс и торгуйте первым лотом. РЕКОМЕ
MetaTrader Маркет - торговые роботы и технические индикаторы для трейдеров, доступные прямо в терминале.
Платежная система MQL5.community разработана для сервисов платформы MetaTrader и автоматически доступна всем зарегистрированным пользователям сайта MQL5.com. Ввод и вывод денежных средств возможен с помощью WebMoney, PayPal и банковских карт.
Вы упускаете торговые возможности:
- Бесплатные приложения для трейдинга
- 8 000+ сигналов для копирования
- Экономические новости для анализа финансовых рынков
Регистрация
Вход
Если у вас нет учетной записи, зарегистрируйтесь
Для авторизации и пользования сайтом MQL5.com необходимо разрешить использование файлов Сookie.
Пожалуйста, включите в вашем браузере данную настройку, иначе вы не сможете авторизоваться.