|
不
经验
|
2
产品
|
17
演示版
|
|
0
工作
|
1
信号
|
0
订阅者
|
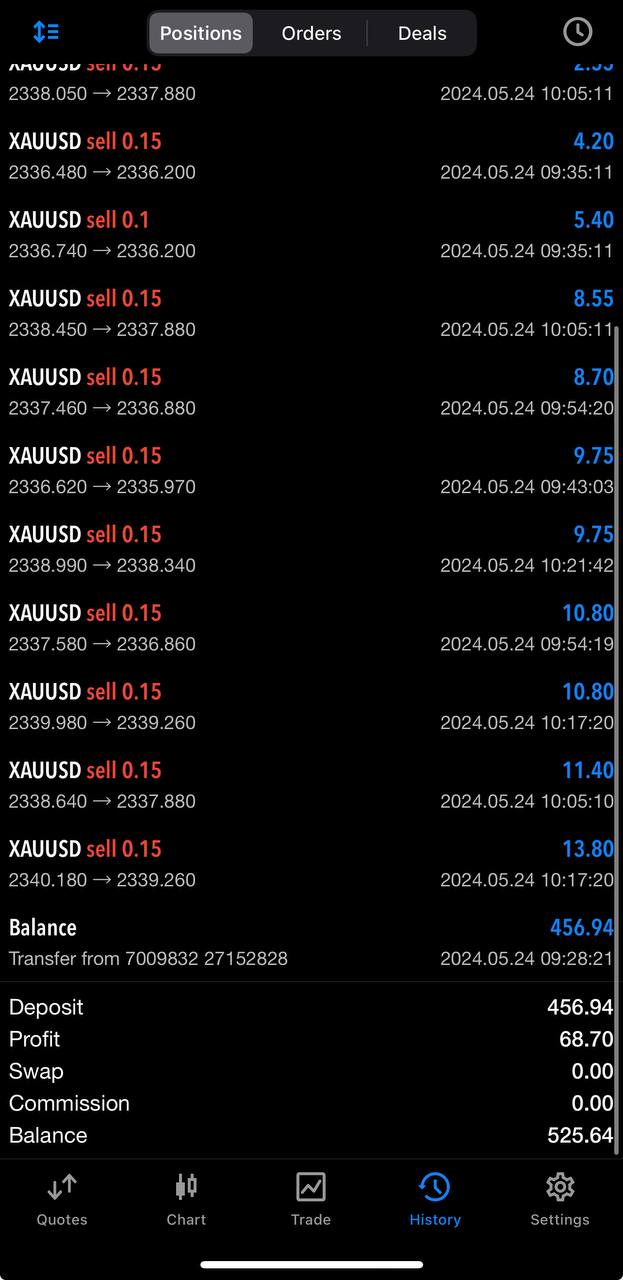
Hello, my name is Nastasya Vasilenko. I am a trader with more than 7 years of experience in the market. My specialization is the development of trading systems and indicators for manual trading, as well as the creation of artificial intelligence to automate trading processes.
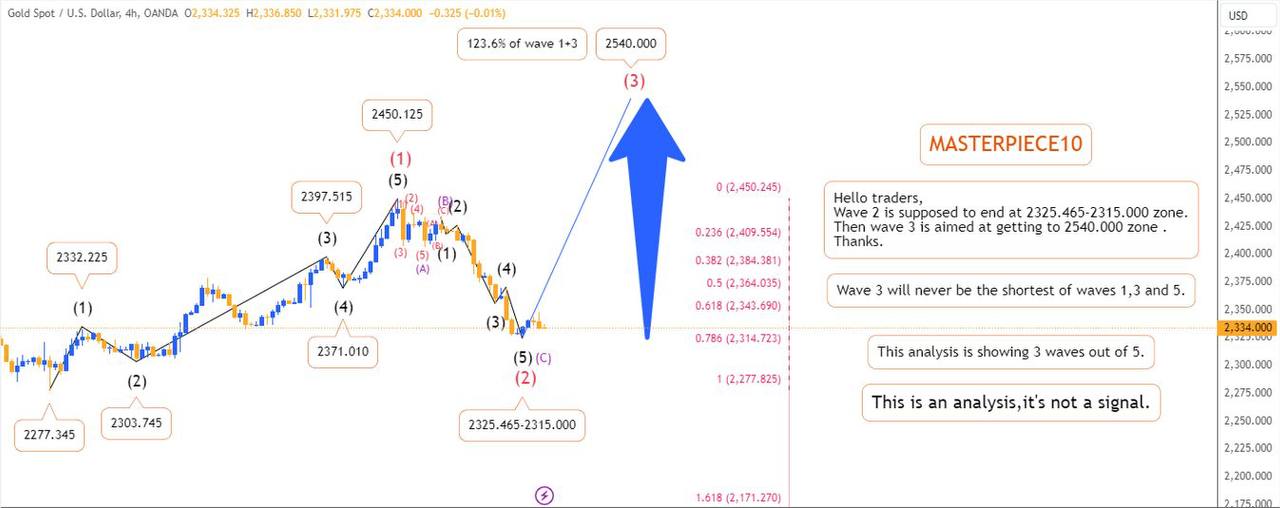
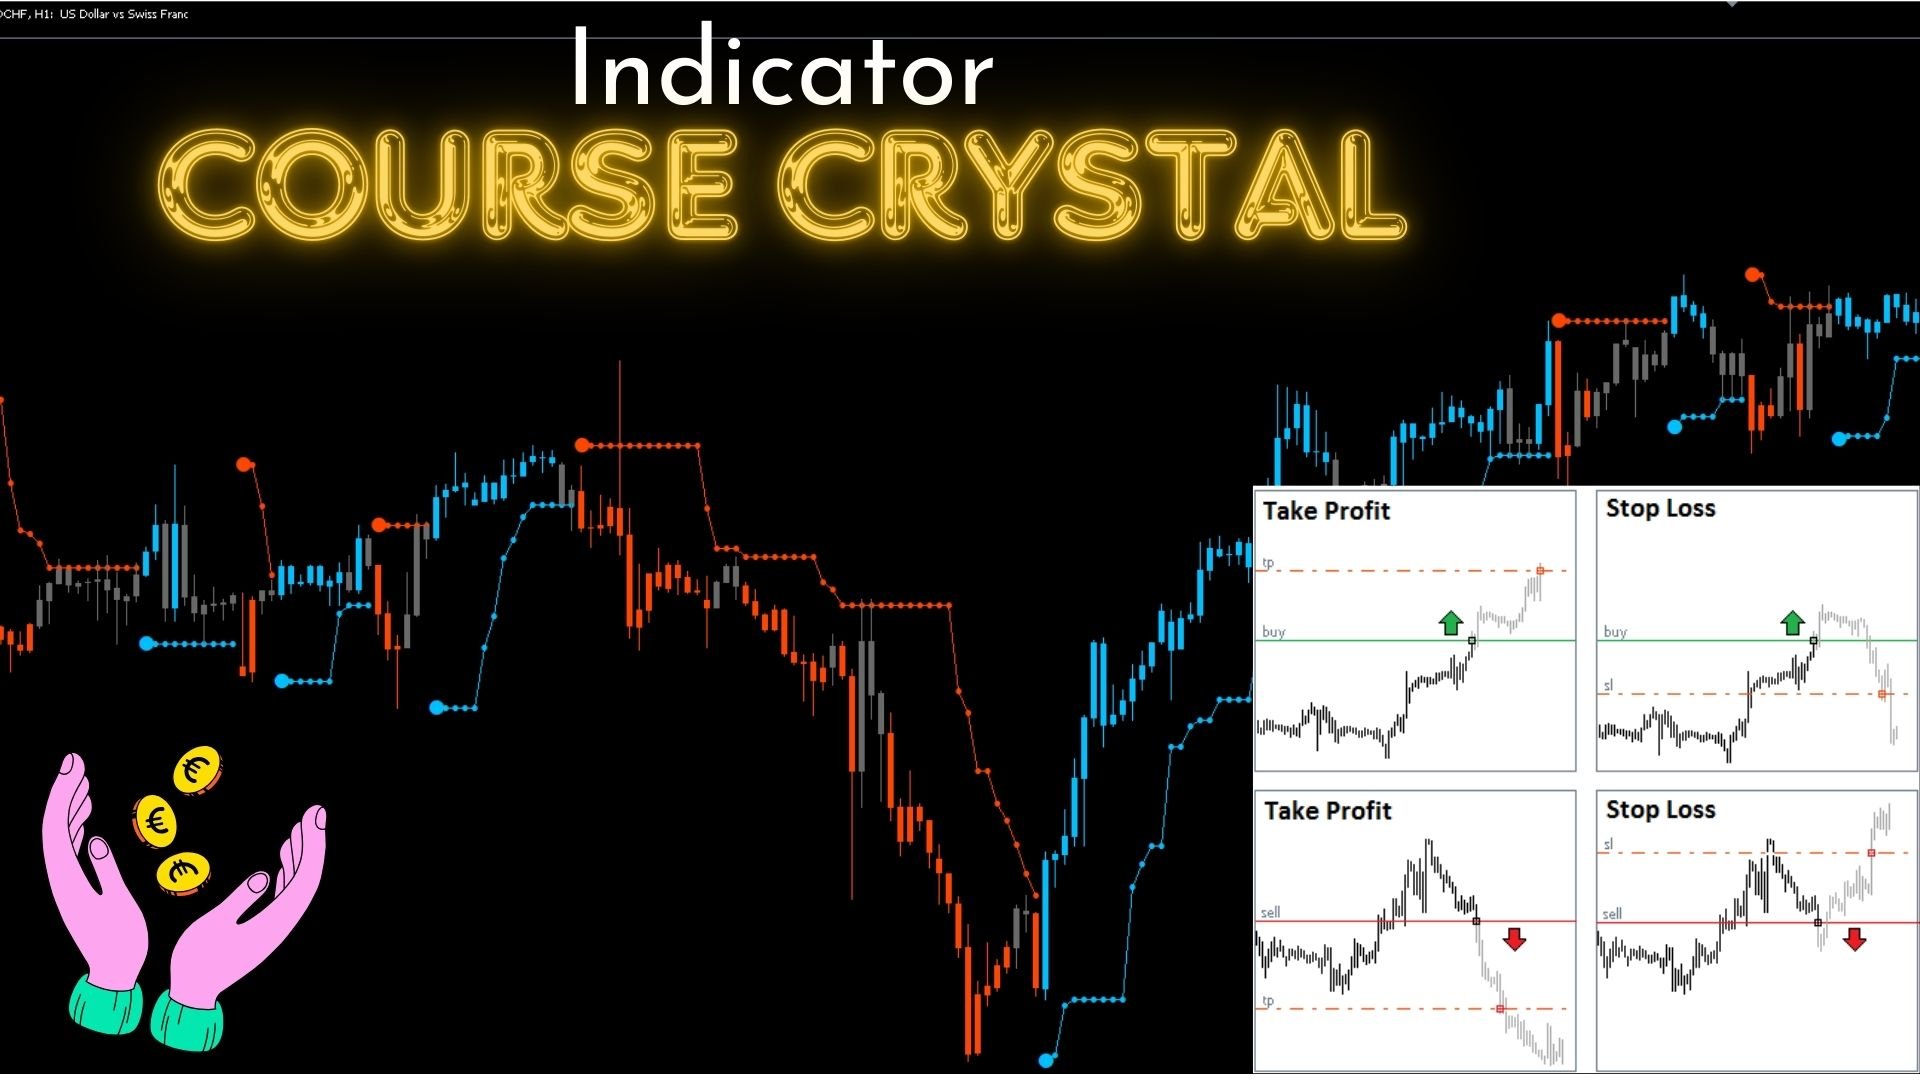
My experience includes a deep understanding of financial markets and trading strategies, as well as the application of programming to create innovative solutions. I develop indicators that help traders determine the optimal moments to enter and exit trades, as well as predict possible trend changes.
In the field of artificial intelligence, I work on creating machine learning algorithms that can analyze large amounts of data and make accurate predictions about future market behavior.
I always strive for continuous learning and development
My channel has a lot of free signals and indicators. - https://t.me/TrendLaboratoryFX