

Course Crystal - https://www.mql5.com/en/market/product/117663?source=Site+Profile
An advisor for this indicator will be published on June 1

An advisor for this indicator will be published on June 1
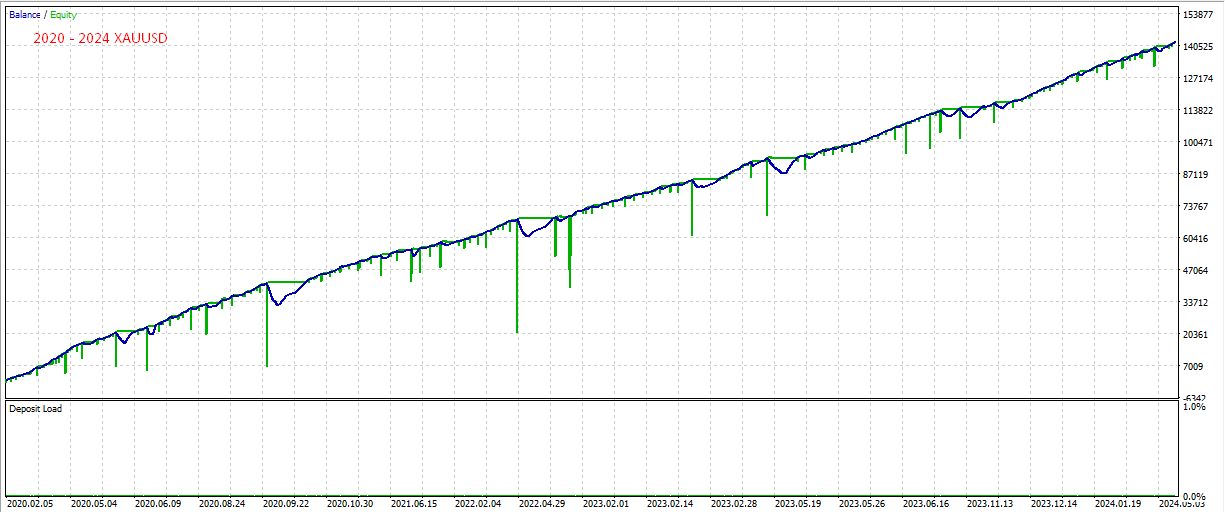
Course Crystal is an indicator that helps traders determine the direction of the trend in the market. It uses a unique algorithm to analyze price movements and displays the results on the chart as colored areas. Blue indicates a buying opportunity, while red indicates a selling opportunity.
Manual trading system:
Trend Determination: The Course Crystal indicator analyzes current and past price data to determine the overall direction of the trend. If the majority of data points to higher prices, the indicator turns blue. If the data indicates falling prices, the indicator turns red.
Signals to enter a trade: When the indicator changes color from red to blue, this can be a signal to buy. When the indicator changes color from blue to red, it can be a signal to sell.
Risk Management: It is important to always set a stop loss and take profit for each trade to manage your risks. It is recommended to set a stop loss at a level that is above (for buying) or below (for selling) the last high or low.
Exit trade: The trade is closed when the take profit or stop loss level is reached, or when the indicator changes color in the opposite direction.
Remember that no indicator is 100% accurate and it is always important to use indicators in combination with other technical analysis and risk management tools. Happy trading! 😊
Each trade is opened taking into account the second confirmation candle


Each trade is opened taking into account the second confirmation candle


