• 概述
  • 评论
  • 评论 (1)

Gap Indicator 123 Gap

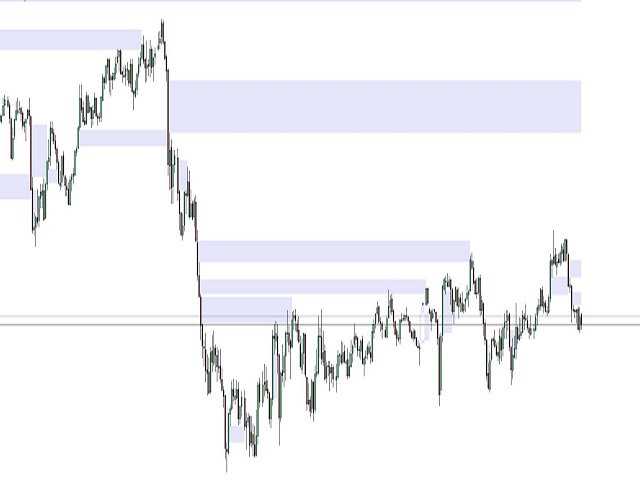
This indicator identifies the gap between the first and third candles in 3 consecutive candles. This area can be used to identify strong areas that the price may return to after a reversal or pullback.


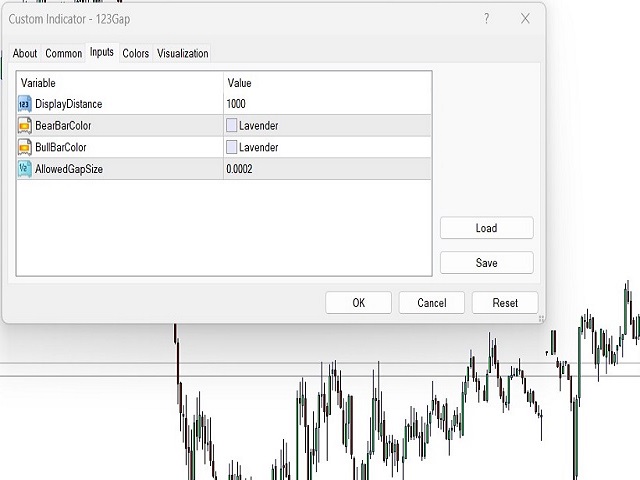
The indicator has 4 user defined settings:

1. Display Distance: This is how many previous candles the indicator will use to identify gaps.

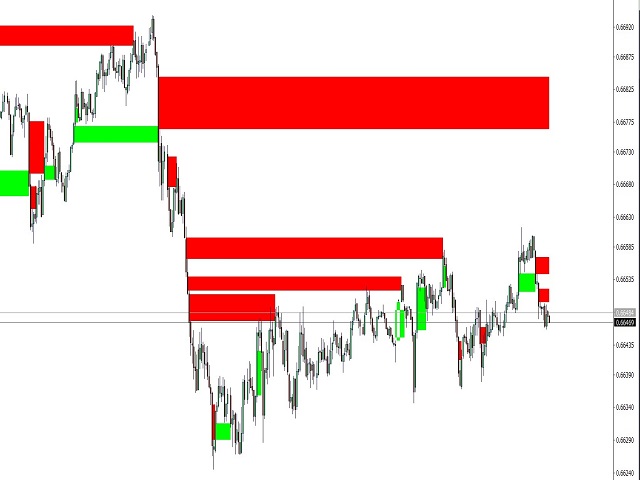
2. BearBarColor: This is the color that will be used for gaps created during a downtrend.

3. BullBarColor: This is the color that will be used for gaps created during an uptrend.

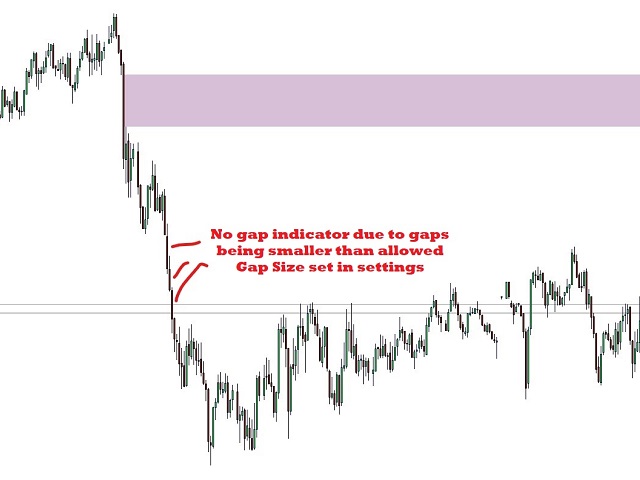
4.  AllowedGapSize: This is the minimum size that a gap that will be highlighted on the chart

推荐产品
Blahtech Market Profile
Blahtech Limited
4.56 (16)
Was: $249  Now: $99   Market Profile defines a number of day types that can help the trader to determine market behaviour. A key feature is the Value Area, representing the range of price action where 70% of trading took place. Understanding the Value Area can give traders valuable insight into market direction and establish the higher odds trade. It is an excellent addition to any system you may be using. Blahtech Limited presents their Market Profile indicator for the MetaTrader community. Ins
BoxChart MT4
Evgeny Shevtsov
4.5 (6)
The market is unfair if only because 10% of participants manage 90% of funds. An ordinary trader has slim changes to stand against these "vultures". This problem can be solved. You just need to be among these 10%, learn to predict their intentions and move with them. Volume is the only preemptive factor that faultlessly works on any timeframe and symbol. First, the volume appears and is accumulated, and only then the price moves. The price moves from one volume to another. Areas of volume accumu
这是一个预测蜡烛收盘价的指标。 该指标主要用于 D1 图表。 该指标适用于传统外汇交易和二元期权交易。 该指标可以用作独立的交易系统,也可以作为您现有交易系统的补充。 该指标分析当前蜡烛,计算蜡烛本身内部的某些强度因素,以及前一根蜡烛的参数。 因此,该指标预测市场走势的进一步方向和当前蜡烛的收盘价。 由于这种方法,该指标既适用于短期盘中交易,也适用于中长期交易。 该指标允许您设置指标在分析市场情况期间将产生的潜在信号的数量。 在指标设置中有一个特殊的参数。 此外,该指标可以通过图表上的消息、电子邮件以及推送通知的形式通知新信号。感谢您的关注!交易愉快! 购买后一定要写信给我! 我会给你我的交易指标的建议! 还可以获得奖金!
Simply The Best Pro
Szymon Palczynski
5 (1)
This indicator displays the histogram and arrows on chart. When Simple The Best Pro are placed on a chart, they identify the trend.  The color of may be blue or red. The blue color stands for upside moves and the red color stands for downside trends. The indicator offers to set Stop Loss (SL) and  Take Profit (TP)  setting. The default value is ATR. Indicator has automatic optimization. The STB is a unique indicator that shows the tendency (button Bars) of a particular signals. The STB tells us
CumulativeDeltaBars
Stanislav Korotky
This indicator is a conventional analytical tool for tick volumes changes. It calculates tick volumes for buys and sells separately, and their delta on every bar, and displays volumes by price clusters (cells) within a specified bar (usually the latest one). The algorithm used internally is the same as in the indicator VolumeDelta , but results are shown as cumulative volume delta bars (candlesticks). Analogous indicator for MetaTrader 5 exists - VolumeDeltaBars . This is a limited substitution
Blahtech Supply Demand
Blahtech Limited
4.61 (33)
Was: $299  Now: $99   Supply Demand uses previous price action to identify potential imbalances between buyers and sellers. The key is to identify the better odds zones, not just the untouched ones. Blahtech Supply Demand indicator delivers functionality previously unavailable on any trading platform. This 4-in-1 indicator not only highlights the higher probability zones using a multi-criteria strength engine, but also combines it with multi-timeframe trend analysis, previously confirmed swings
History Pattern Search
Yevhenii Levchenko
该指标建立当前报价,可以与历史报价进行比较,并在此基础上进行价格走势预测。指示器有一个文本字段,用于快速导航到所需日期。 选项: 符号 - 选择指标将显示的符号; SymbolPeriod - 选择指标从中获取数据的时段; IndicatorColor - 指示器颜色; HorisontalShift - 由指标绘制的报价移动指定的柱数; Inverse - true 反转引号,false - 原始视图; ChartVerticalShiftStep - 图表垂直移动(键盘上的向上/向下箭头); 接下来是文本字段的设置,您可以在其中输入日期,您可以通过按“回车”立即跳转到该日期。 接下来是文本字段的设置,您可以在其中输入日期,您可以通过按“回车”立即跳转到该日期。
Volume Profile Indicator for MT4 Gain a trading edge with the "Volume Profile" indicator for MetaTrader 4 (MT4). This advanced technical analysis tool allows you to precisely identify key support and resistance levels based on transaction volume. Easily visualize market areas of high interest, where trading volumes are highest, and use this information to make more informed trading decisions. Key Features: Clear and detailed visualization : The indicator displays volume histograms directly on th
Time Bubble
Ahmed Mohamed
Time Bubble ***Specialized for GBPJPY 1H time frame*** (tested for two years with success rates about 82%) Time Circle's smart algorithm detects the price circles with time . give strong signals at the right time as result of combine the price and time. our team spent months to develop this indicator specially for GBPJPY ..with high success rates about 82% win trades over two years .tested from December 2016 to November 2018. *** in last two years total signals 1012 with 829 Wins and
Market Dynamics
Thomas Bradley Butler
市场动态用于趋势剥头皮。 蓝色是买入,红色是卖出。 这些线是价格整合的区域,常规的蜡烛线是未确定的。 价格将在支撑线和阻力线之间盘整,然后价格走势突破该区域。 在上方或下方绘制头皮区域,并遵循头皮的主要趋势或日间交易。 市场动态用于趋势剥头皮。 蓝色是买入,红色是卖出。 这些线是价格整合的区域,常规的蜡烛线是未确定的。 价格将在支撑线和阻力线之间盘整,然后价格走势突破该区域。 在上方或下方绘制头皮区域,并遵循头皮的主要趋势或日间交易。 市场动态用于趋势剥头皮。 蓝色是买入,红色是卖出。 这些线是价格整合的区域,常规的蜡烛线是未确定的。 价格将在支撑线和阻力线之间盘整,然后价格走势突破该区域。 在上方或下方绘制头皮区域,并遵循头皮的主要趋势或日间交易。
AQ XFifteen Pro
HIT HYPERTECH INNOVATIONS LTD
Χ15 indicator is a MetaTrader 4 tool that allows you to  BUILD & BACKTEST ON REAL TIME  your own strategies quickly, easily and efficiently. It contains  15 of the most popular technical analysis indicators  that you can use, each one in a different way. Choose the indicators that you want to use, select how you will use them and you will see on the chart BUY (green) and SELL (red) arrows implementing your strategy. Choose Take Profit and Stop Loss and you will see the results of your strategy w
Zig Zag 123
Stephen Reynolds
Zig Zag 123 tells us when a reversal or continuation is more likely by looking at the shift in supply and demand. When this happens a signature pattern appears known as 123 (also known ABC) will often break out in direction of higher low or lower high. Stop loss and take profit levels have been added. There is a panel that shows the overall performance of your trades for if you was to use these stop loss and take profit levels.  We get alerted if a pattern 123 appears and also if the price
The Chaikin Oscillator is a technical indicator developed by Marc Chaikin that combines price and volume data to measure the accumulation and distribution of a financial instrument. It aims to identify potential buying and selling opportunities in the market. The Chaikin Oscillator is calculated by subtracting a 10-day exponential moving average of the Accumulation Distribution Line (ADL) from a 3-day exponential moving average of the ADL. Here's how to use the Chaikin Oscillator indicator in tr
VolumeProfile
Robert Hess
3.8 (5)
Descption: The Volume Profile displays detailed informations of historical trading activities at certain price levels (Market Profile). So you can locate the areas with the best prices in the market and get an advantage about other market participants. Features: Customizable Volume Profile / Market Profile Shows the "fair" Value Area with 70% of all Volume Shows critical low volume zones Shows VPOC, VAL and VAH Points Works on all timeframes Also available for MT5 ( https://www.mql5.com/en/m
FRB Time MT4
Fernando Baratieri
FRB Time - FRB Trader Indicator that shows the server's time of operation. You can edit the font color and size of the timetable. Settings font color Font size Background color To move the Timetable, just click on it and move the mouse to where you want to leave it. After placing the Time where you want it, click again or press "ESC" and the time will stay where you left it.
FREE
The indicator allows you to trade binary options. The recommended time frame is М1 and the expiration time is 1,2,3 minutes. The indicator suitable for auto and manual trading. A possible signal is specified as a arrows above/under a candle. You should wait until the candle closes! Arrows are not re-painted Trade sessions: TOKYO section (Half-end) Currency pairs: USD/JPY Working time frame: M1 Expiration time: 1,2,3 minutes. The indicator also shows good results when using the martingale strateg
FREE
A technical indicator that calculates its readings on trading volumes. In the form of a histogram, it shows the accumulation of the strength of the movement of the trading instrument. It has independent calculation systems for bullish and bearish directions. Works on any trading instruments and time frames. Can complement any trading system. The indicator does not redraw its values, the signals appear on the current candle. It is easy to use and does not load the chart, does not require additi
Dynamic Forex28 Navigator - The Next Generation Forex Trading Tool Dynamic Forex28 Navigator is the evolution of our long-time, popular indicators, combining the power of three into one: Advanced Currency Strength28 Indicator + Advanced Currency IMPULSE with ALERT + CS28 Combo Signals (recent Bonus) What Does This Next-Generation Strength Indicator Offer? Everything you loved about the originals, now enhanced with new features and greater precision. Key Features: Proprietary Currency Strength F
UR Gamma
Krzysztof Jan Debski
UR伽瑪 (由機器學習系統中的類似計算提供支持) UR Gamma 是一種尖端的金融分析工具,它對經典的 WaveTrend 指標進行了全新改進。 通過結合先進的數字信號處理技術,UR Gamma 解決了傳統 WaveTrend 算法的一些局限性,並提供了一種更準確、穩健和動態的方法來識別和衡量價格行為的趨勢。 使用 UR Gamma 的優勢: 簡約設置 所有數據都在後台計算 - 用戶只有 1 個輸出 - 清晰整潔。 表明疲憊的背景水平 適應各種資產。 有一個特殊的電報聊天,您可以在其中了解最新的工具更新,如果您覺得缺少什麼,也可以發送請求! 為什麼選擇 UR Gamma? 目標是讓概率分佈在 -1 和 1 之間振盪,中間點為 0。 為實現這一目標,使用機器學習中稱為激活函數的技術來轉換數據。 一個這樣的函數是雙曲正切函數,它經常用於神經網絡,因為它保持 -1 和 1 之間的值。通過對輸入數據進行一階導數並使用二次均值對其進行歸一化,tanh 函數有效地重新分配輸入 信號進入 -1 到 1 的所需範圍。 UR Gamma 是交易者和投資者的強大工具,為他們
Market Profile 3
Hussien Abdeltwab Hussien Ryad
3 (2)
Market Profile 3 MetaTrader 4 indicator  — is a classic Market Profile implementation that can show the price density over time, outlining the most important price levels, value area, and control value of a given trading session. This indicator can be attached to timeframes between M1 and D1 and will show the Market Profile for daily, weekly, monthly, or even intraday sessions. Lower timeframes offer higher precision. Higher timeframes are recommended for better visibility. It is also possible t
FREE
Pip Rider
Brenden Caleb Luebeck
Tired of looking at indicator cluttered charts? Are you a trend trader? I have just the solution for you. Trend Boss. This indicator allows you to choose some of the most popular trend identifiers such as CCI(Supertrend) or Ichimoku and pair them with some of the most popular entries such as Kijun/Tenkan cross or MACD zero cross. You can now keep your charts clean by hiding all those oscillators and moving averages. Only arrows will be displayed depending on your entry criteria. Trend filt
Indicator function Buy and sell according to the index color change It is best to use 1H for testing   About update questions In order to be more suitable for market fluctuations, the company regularly updates the indicators   Product cycle and trading time applicable to indicators Applicable mainstream currency pair EUR/USD GBP/USD NZD/USD AUD/USD USD/JPY USD/CAD USD/CHF Applicable mainstream cross currency pair EUR/JPY EUR/GBP EUR/CHF EUR/CAD EUR/NZD AUD/CAD AUD/NZD AUD/CHF AUD/JPY GBP/JPY GB
UPD1 Profile Levels
Vitaliy Kuznetsov
5 (5)
该指标在指定柱数的工作直方图上找到最大和最低价格量(市场概况)的水平。   复合型材 。 柱状图的高度是全自动的,并适应任何仪器和时间框架。 作者的算法被使用,并且不重复众所周知的类似物。 两个直方图的高度近似等于蜡烛的平均高度。 智能警报将帮助您了解有关交易量水平的价格。 概念Smart Money   。 Low Volume - Imbalance. 用于寻找良好的市场环境,确定市场结构并作为二元期权的过滤器。 它是价格的磁铁。 High Volume - Liquidity. 用于退出累积时的测试。 输入参数   。 基本   。 Bars Count - 要计数和显示的条数   。 Signal Fractal = 5 (对于颜色信号电平)。 水平将在以下条件下成为信号:顶部和底部有五个直方图不超过它   。 Min Candles For High Volume Level - 在水平蜡烛的最小数量,以便它可以成为一个信号   。 按钮设置   。 Visual Button - 按钮显示(启用/禁用)   。 Corner - 按钮的卡角   。 X i
Dollar Mint Indicator
David Mwaniki Mbugua
Dollar mint indicator is a special workmanship with years of experience in forex.   Dollar mint ea is a fully non repaint indicator optimised with price action data such that once it gives you a signal t . The indicator   can be used to trade anything on the mt4 with much ease. Benefits ; Fully non repaint Use in any timeframe Use in all the available tradable assets on mt4 Best to use on h4. It generates fully analysed buy and sell signals based on trend and also filters out retracement
MarketProfile EForex
Veridiana Adorno Kendrick
Market Profile Shows where the price has spent more time, highlighting important levels that can be used in trading. It is a powerful tool which is designed to take the fundamental components which comprise every market; price/volume/time, and visually display their relationship in real-time as the market develops for a pre-determined time period. Very powerful tool!
The market profile indicator provides with an X-Ray vision into market activity, outlining the most important price levels, value area and control value of the daily trading session. [ Installation Guide | Update Guide | Troubleshooting | FAQ | All Products ] Easy to understand and use Understand market dynamics easily Automatic timeframe selection Identify zones of trading value and discard others It is useful in all market conditions Effective for any trading strategy It implements three color
GND Tail Candle
Nguyen Dang Giang
A tall upper shadow occurs when the price moves during the period, but goes back down, which is a bearish signal. A tall lower shadow forms when bears push the price down, but bulls pull it back up, which leaves a long line or shadow. This is considered a bullish signal. Some technical analysts believe a tall or long shadow means the stock will turn or reverse. Some believe a short or lower shadow means a price rise is coming. In other words, a tall upper shadow means a downturn is coming, whil
Cosmic Diviner X Planet
Olena Kondratenko
4 (2)
This unique multi-currency strategy simultaneously determines the strength of trends and market entry points, visualizing this using histograms on the chart. The indicator is optimally adapted for trading on the timeframes М5, М15, М30, Н1. For the convenience of users, the indicator renders the entry point (in the form of an arrow), recommended take profit levels (TP1, TP2 with text labels) and the recommended Stop Loss level. The take profit levels (TP1, TP2) are automatically calculated for
CyberZingFx Trend Reversal
Afsal Meerankutty
4.18 (17)
Indicator captures the trend reversals with no-repaint Buy and Sell Arrow signals. CyberZingFx Trend Reversal Indicator - your go-to solution for accurate and reliable trend reversal signals. With its  advanced trading strategy , the indicator offers you Buy and Sell Arrow signals that do not repaint, making it a reliable tool for catching Swing Highs and Swing Lows in any market and any time frame. Indicator works on  any market  and  any time frames . __________________________________________
斐波那契折返和扩展画线工具 适用于MT4平台的斐波那契折返和扩展画线工具,适合于使用黄金分割交易的交易者 优点:没有多余的线,没有过长的线,易于观察发现交易的机会 试用版: https://www.mql5.com/zh/market/product/35884 主要功能: 1.可以直接画出多组斐波那契折返,可以看出重要折返点之间的关系; 2.可以画出斐波那契扩展,比率有三种0.618,1,1.618 3.画出的斐波那契折返和扩展均可左右移动,有数值显示,方便观察 4.可通过数字键切换周期 使用指南和功能键: 1.按 [ 或R画折返,按需要画折返,最多云持8组折返; 2.按 ] 或E画扩展; 3.按 \ 删除当前周期下的所有扩展和折返,其余周期的不受影响 4.如何左右移动折返和扩展 (1)点击第一组折返的F5字符,可以左右移动折返; (2)点击COP的字符 ,可以左右移动扩展; 5. (1)点击第一组折返的F5字符,按del 可以删除这组折返; (2)点击COP的字符, 按del 可以删除这组扩展; 6.修改折返和扩展(随着市场的运行
该产品的买家也购买
Gann Made Easy
Oleg Rodin
4.85 (81)
Gann Made Easy 是一个专业且易于使用的外汇交易系统,它基于使用先生理论的最佳交易原则。 W.D.江恩。该指标提供准确的买入和卖出信号,包括止损和获利水平。您甚至可以使用推送通知在旅途中进行交易。 购买后请联系我!我将免费与您分享我的交易技巧和丰厚的红利指标! 您可能已经多次听说过江恩交易方法。通常 Gann 的理论不仅对于新手交易者而且对于那些已经有一定交易经验的人来说都是非常复杂的东西。这是因为江恩的交易方法在理论上并不那么容易应用。我花了几年时间来完善这些知识,并将最好的原则应用到我的外汇指标中。 该指标非常易于应用。您所需要的只是将其附加到您的图表并遵循简单的交易建议。该指标不断进行市场分析工作并寻找交易机会。当它检测到一个好的入口点时,它会为您提供一个箭头信号。该指标还显示止损和获利水平。 换句话说,当您像先生一样进行交易时,该指标会为您提供最佳江恩建议。江恩亲自告诉你此时此刻该做什么。但最好的部分是您不需要了解任何有关江恩交易原则的知识,因为该指标会为您完成整个市场分析工作。
TPSpro RFI Levels
Roman Podpora
4.82 (22)
Atomic Analyst
Issam Kassas
5 (2)
首先值得强调的是,该交易指标是非重绘、非延迟的指标,这使其成为手动和机器人交易的理想选择。 用户手册:设置、输入和策略。 Atomic Analyst是一种PA价格行动指标,利用价格的力量和动量来寻找市场上更好的机会。配备了高级过滤器,可帮助去除噪音和假信号,并提高交易潜力。使用多层复杂的指标,Atomic Analyst扫描图表,并将复杂的数学计算转化为任何初学者都能理解并用来做出一致交易决策的简单信号和颜色。 “Atomic Analyst”是专为新手和经验丰富的交易者量身定制的综合交易解决方案。它将高级指标和一流功能融合为一体的交易策略,使其成为所有类型交易者的多功能选择。 日内交易和剥头皮策略:专为快速准确的日内交易和短期交易而设计。 日内和摆动交易策略:可用作追求价格大幅波动的日内和摆动交易者的可靠工具。 多货币和市场:凭借其可靠的精度,在不同的工具和市场上运作。 多个时间框架:可在多个时间框架上使用,性能良好。 稳定性:所有指标均不重绘、不重绘和不滞后,确保可靠的信号。 信号清晰度:提供箭头信号,用于清晰的入场和出场点。 实时警报:通过交易入场、SL和TP警报通知交
Gold Stuff
Vasiliy Strukov
4.89 (238)
Gold Stuff 是专为黄金设计的趋势指标,也可用于任何金融工具。 该指标不会重绘,也不会滞后。 推荐时间框架 H1。 在它指标工作全自动专家顾问 EA Gold Stuff。 你可以在我的个人资料中找到它。 重要! 购买后立即与我联系,以获得说明和奖金!   您可以免费收到我们的强力支持和趋势扫描指标的副本,请私信。大部头书! 购买后立即联系我以获得设置和个人奖励!   设置 绘制箭头 - 打开关闭。 在图表上绘制箭头。 警报 - 打开关闭声音警报。 电子邮件通知 - 打开关闭。 电子邮件通知。 Puch-notification - 打开关闭。 推送通知。 接下来,调整色域。 Gold Stuff 是专为黄金设计的趋势指标,也可用于任何金融工具。 该指标不会重绘,也不会滞后。 推荐时间框架 H1。 在它指标工作全自动专家顾问 EA Gold Stuff。 你可以在我的个人资料中找到它。 购买后立即联系我以获得设置和个人奖励!   设置 绘制箭头 - 打开关闭。 在图表上绘制箭头。 警报 - 打开关闭声音警报。 电子邮件通知 - 打开关闭。 电子邮件通
Trend Punch
Mohamed Hassan
4.95 (19)
This indicator is unstoppable when combined with our other indicator called  Support & Resistance . After purchase, send us a message and you will get it   for  FREE as a BONUS! Introducing Trend Punch , the revolutionary forex trend indicator that will transform the way you trade! Trend Punch is uniquely designed to provide precise buy and sell arrows during strong market trends, making your trading decisions clearer and more confident. Whether you're trading major currency pairs or exotic sym
目前八折优惠! 对任何新手或专家交易者来说都是最好的解决方案! 这个仪表板软件适用于28种货币对。它基于我们的两个主要指标(高级货币强度28和高级货币冲动)。它对整个外汇市场提供了一个伟大的概述。它显示高级货币强度值,货币运动速度和28个外汇对在所有(9)时间段的信号。想象一下,当你可以使用图表上的单一指标观察整个市场,以确定趋势和或剥头皮的机会时,你的交易将得到改善 我们已经在这个指标中建立了一些功能,使你更容易识别强势和弱势货币,同时识别和确认潜在的交易。该指标以图形方式显示货币的强势或弱势是增加还是减少,以及它在所有时间段的表现。 增加的新功能是动态市场斐波那契水平,它适应当前的市场条件变化,这是一个已经在我们的高级货币强度28和高级货币冲动指标中使用的成熟的加分项。 在交易时,总是将弱势货币和强势货币配对,这个新指标将帮助你做到这一点。 用户手册:点击这里  https://www.mql5.com/en/blogs/post/708783 特点  显示每个时间段的ACS28和GAP-speed(冲动)的货币强度值。 列:颜色代码以7种颜色
TPSproTREND PrO
Roman Podpora
4.79 (19)
TPSpro TREND PRO 是一个趋势指标,可以自动分析市场并提供有关趋势及其每次变化的信息,并给出进入交易的信号而无需重新绘制! 该指标使用每根蜡烛,分别对其进行分析。指不同的脉冲——向上或向下脉冲。货币、加密货币、金属、股票、指数交易的准确切入点! MT5版本                 指标的完整描述   我们建议将其与 指示器 -   RFI LEVELS 一起使用 主要功能: 准确的输入信号,无需渲染! 如果出现信号,它仍然相关!这是与重提指标的一个重要区别,重提指标可以提供信号然后改变信号,这可能导致存款资金的损失。现在您可以以更高的概率和准确度进入市场。还有一个功能是在箭头出现后为蜡烛着色,直到达到目标(止盈)或出现反转信号。 显示止损/获利区域 为了提高搜索切入点时的视觉清晰度,创建了一个模块,该模块最初显示买入/卖出区域,在该区域中搜索进入市场的最佳点。用于处理止损水平的附加智能逻辑有助于随着时间的推移减小其大小,从而降低进入交易(移动 sl)时的初始风险。 显示较高时间范围内的最小值/最大值(MTF 模式) 添加了一项功能,可以显示较高时间间隔的最小
Scalper Inside PRO
Alexey Minkov
4.73 (56)
An exclusive indicator that utilizes an innovative algorithm to swiftly and accurately determine the market trend. The indicator automatically calculates opening, closing, and profit levels, providing detailed trading statistics. With these features, you can choose the most appropriate trading instrument for the current market conditions. Additionally, you can easily integrate your own arrow indicators into Scalper Inside Pro to quickly evaluate their statistics and profitability. Scalper Inside
- Real price is 80$ - 40% Discount ( It is 49$ now ) Contact me for instruction, add group and any questions! Related EA Product: Bitcoin Expert Introduction The breakout and retest strategy is traded support and resistance levels. it involves price breaking through a previous level.  The break and retest strategy is designed to help traders do two main things, the first is to avoid false breakouts. Many false breakouts start with a candlestick that breaks out of a level but ends with an immedi
Trend Screener
STE S.S.COMPANY
4.8 (87)
趋势指标,趋势交易和过滤的突破性独特解决方案,所有重要趋势功能都内置在一个工具中! 它是 100% 非重绘多时间框架和多货币指标,可用于所有符号/工具:外汇、商品、加密货币、指数、股票。 限时优惠:支撑和阻力筛选指标仅售 50美元,终身有效。(原价 250 美元)(优惠延长) 趋势筛选器是有效的指标趋势跟踪指标,它在图表中提供带有点的箭头趋势信号。 趋势分析器指标中可用的功能: 1.趋势扫描仪。 2. 具有最大利润分析的趋势线。 3.趋势货币强度计。 4. 带有警报的趋势反转点。 5. 带有警报的强趋势点。 6. 趋势箭头 每日分析示例,每日信号表现...等与我们的趋势筛选指标,可以在这里找到: 点击这里 限时优惠:Trend Screener Indicator 仅售 50 美元且终身可用。原价 125$) 通过访问我们的 MQL5 博客,您可以找到我们所有的高级指标以及分析示例、每日信号表现...等。 : 点击这里 我们的趋势系统由 2 个指标组成: 1. Trend Screener Indicator:显示趋势仪表盘、图表中的趋势线、入场点...等。 2.
FX Power MT4 NG
Daniel Stein
5 (12)
通过 mql5 和 Telegram 上 的晨间简报获取每日市场更新,包括详细信息和屏幕截图 ! FX Power MT4 NG 是我们长期以来非常受欢迎的货币强度计算器 FX Power 的下一代产品。 这款下一代强度计算器能提供什么?您所喜爱的原版 FX Power 的所有功能 附加功能 黄金/XAU 强度分析 更精确的计算结果 可单独配置的分析周期 可自定义计算限制,以获得更好的性能 为希望查看更多信息的用户提供特殊的多实例设置 无尽的图形设置,可在每个图表中设置您最喜欢的颜色 无数的通知选项,让您再也不会错过任何重要信息 采用 Windows 11 和 macOS 风格的全新圆角设计 神奇的移动指标面板 FX Power 主要功能 所有主要货币的完整强势历史 所有时间框架内的货币强弱历史 所有经纪商和图表的计算结果完全相同 100% 可靠的实时计算 -> 无重绘 可通过下拉列表选择分析时段 通过自定义模式单独配置分析时段 可在一个图表中使用多个实例 可移动 FX Power 显示屏(通过拖放) 适用于高分辨率 QHD、UHD 和 4K 显示器 自动终端配置 针对平板电脑
FX Volume
Daniel Stein
4.58 (33)
通过 mql5 和 Telegram 上 的 " 晨间简报 "获取每日市场更新,包括详细信息和屏幕截图 ! 外汇交易量(FX Volume)是第一个也是唯一一个从经纪商角度真正洞察市场情绪的交易量指标。 直接在您的图表上看到这些信息是真正改变游戏规则和突破性的交易解决方案。 受益于独特的市场数据洞察,如 比率(Ratios )显示货币多头和空头头寸的比率(百分比 比率变化 显示所选时间段内的多头比率及其百分比变化 总交易量 显示货币的总交易量(多头和空头),以手为单位 多头 交易量显示货币所有多头头寸的交易量 空头 交易量显示所有货币空头头寸的交易量 净多头 显示净多头交易量,即所有多头头寸减去所有空头头寸(以手为单位)。 净多头百分比 显示货币净多头交易量的变化 请阅读我们的基本教程 -> "如何使用外汇交易量进行交易 " 获取更多信息,如常见问题、交易技巧和教程视频,请访问我们的 外汇交易量公共信息频道 请 安装并运行 SI Connect 以建立与我们数据中心的持续连接 背景信息 我们都知道,外汇是一个分散的市场。这就是为什么我们必须打破常规思维,开发一个独
Advanced Currency IMPULSE with ALERT
Bernhard Schweigert
4.9 (480)
目前31%的折扣!! 对任何新手或专家交易者来说都是最好的解决方案! 这个指标是一个独特的、高质量的、负担得起的交易工具,因为我们已经纳入了一些专有的功能和一个秘密的公式。只需一张图表,它就能给出所有28种货币对的警报。想象一下,你的交易将如何改善,因为你能够准确地确定新趋势或剥头皮机会的触发点 建立在新的基础算法上,它使识别和确认潜在交易变得更加容易。这是因为它以图形方式显示了一种货币的强势或弱势是否正在加速,并测量了这种加速的速度--把它想象成你汽车中的速度表。当你加速时,事情显然会发生得更快,这在外汇市场上也是一样的,即如果你配对的货币正在向相反的方向加速,你就会发现一个潜在的有利可图的交易。 货币动量的垂直线和箭头将指导你的交易! 动态的市场斐波那契23水平被用作警报触发器,将适应市场活动。如果冲动触及黄色触发线,您将在MetaTrader或您的电子邮件或推送警报中收到警报。然后你就知道作为一个交易员应该做什么。货币对和方向已经给出。只要点击警报按钮,就可以切换到该货币对或打开一个新的图表,以便进一步分析。警报级别可以通过用户输入来改变,可以选择3个敏感度级别
Enigmera
Ivan Stefanov
5 (3)
ENIGMERA:市场核心 https://www.enigmera.com 简介 该指标和交易系统是金融市场的一种非凡方法。ENIGMERA 利用分形周期精确计算支撑位和阻力位。它能显示真实的累积阶段,并给出方向和目标。 该系统无论在趋势中还是在修正中都能发挥作用。 它是如何运行的? ENIGMERA 由三条线组成:支撑/阻力线、目标线和偏离线。与一般市场指标将过去的数据推断为现在和未来的情况不同,该系统能提供当前的完整情况。如果你处于支撑位,这意味着真正的支撑;如果你处于阻力位,这意味着真正的阻力。如果突破某一水平,则表示趋势发生变化。没有重绘。 由于市场在不断变化,ENIGMERA 不断调整其评估工具,定期修改策略。  这保证了每种情况都能得到全面评估。这一市场指标的独特性显而易见,其能力不言而喻。  ENIGMERA 为金融分析师和咨询师提供服务,他们需要可靠的见解与客户分享,也为投资者提供服务,他们需要最精确和最可靠的保证。 该系统能够达到最佳精度,使交易者能够自信、清晰地评估他们的选择。 ENIGMERA 将 20 年的交易专长和知识整合到一个综合软件
Gann Signal Scaner
Kirill Borovskii
This indicator is based on the Gann Signal indicator and acts as a market scanner. All you need to do is fill in the selected currency pairs in the settings and that’s it. Next, the indicator itself will view all these currency pairs and time frames from M5 to D1 simultaneously. When a new signal appears, the indicator will give you an Alert and also draw the letter N where this new signal will be.
PRO Renko System
Oleg Rodin
5 (25)
PRO Renko Arrow Based System for trading renko charts.  准确的信号交易任何外汇工具. 另外,我将免费提供系统的附加模块! PRO Renko系统是RENKO图表上高度准确的交易系统。该系统是通用的。 该交易系统可应用于各种交易工具。 该系统有效地中和了所谓的市场噪音,打开了获得准确反转信号的通道。 该指标易于使用,只有一个参数负责产生信号。 您可以很容易地使算法适应您感兴趣的交易工具和renko酒吧的大小。 我很乐意通过提供任何咨询支持来帮助所有客户有效地使用该指标。 祝您交易成功!购买后,立即写信给我! 我将与您分享我的建议和我的renko发电机。 另外,我将免费提供系统的附加模块!
Market Reversal Alerts
LEE SAMSON
4.19 (113)
成為突破者,隨著價格反轉,市場結構會改變利潤。 訂單突破者指示器可以識別趨勢或價格走勢何時接近枯竭並準備好逆轉。它會提醒您市場結構的變化,通常會在發生逆轉或重大回調時發生。 該指標使用專有計算來確定突破和價格動能。每當在可能的耗盡點附近形成新的高點時,指標就會繪製最後一個生成該高點的順序塊。然後,它將隨價格移動隨價格跟隨定單。然後,當價格轉向相反方向並突破該訂單塊時,它會提醒您,從而創建新的市場結構並開始趨勢或重大回調的可能逆轉。 訂單塊是在創建高/低之前的最後一個相反的彩色蠟燭,並且當價格跌破這些關鍵區域以下時,這表明趨勢可能會發生短期或長期反轉。 特徵 提醒您關鍵耗盡點的市場結構變化 價格接近耗盡水平時自動提取訂單塊 在一個方向繼續移動時,在價格後面跟踪定單,以提醒您最佳的反轉輸入 將顏色更改為純色塊,以顯示何時發生市場結構中斷。 適用於所有交易品種和時間範圍 內置集成的彈出窗口和電子郵件警報 策略和如何與定單破壞者指標進行交易 當斷路器塊發生時,您有兩個選擇。 看左邊!我們正在尋求供應/需求或支撐/阻力位嗎?市場結構轉變(逆轉)通常發生在價格重新測試舊水平或
Advanced Currency Strength28 Indicator
Bernhard Schweigert
4.9 (649)
目前26%的折扣 任何新手或专家交易者的最佳解决方案! 这个指标是一个独特的、高质量的、可负担得起的交易工具,因为我们纳入了一些专有的功能和一个新的公式。只需一个图表,你就可以读出28个外汇对的货币强度!想象一下,你的交易将如何得到改善,因为你的交易是在你的手中进行的。想象一下,你的交易将如何改善,因为你能够准确地确定新趋势或剥头皮机会的触发点? 用户手册:点击这里  https://www.mql5.com/en/blogs/post/697384 这是第一本,原版的! 不要买一个毫无价值的崇拜者的克隆品。 特别的 子窗口中的箭头显示强劲的货币势头GAP将指导你的交易! 当基础货币或报价货币处于超卖/超买区域(外盘斐波那契水平)时,在个人图表的主窗口中出现警告信号。 当货币力量从外围区间回落时,回撤/反转警报。 十字星模式的特别警报 可选择多个时间框架,以快速查看趋势! 货币强度线在所有的时间框架中都非常平稳,当使用较高的时间框架来识别总体趋势,然后使用较短的时间框架来确定精确的入口时,效果非常好。你可以根据自己的意愿选择任何时间框架。每个时间框架都由其自身进
Currency Strength Exotics
Bernhard Schweigert
4.87 (30)
目前8折优惠! 对任何新手或专家交易者来说都是最好的解决方案! 这个指标是专门用来显示任何符号的货币强度,如异国货币对、商品、指数或期货。它是同类产品中的第一个,任何符号都可以添加到第9行,以显示黄金、白银、石油、DAX、US30、MXN、TRY、CNH等的真实货币强度。这是一个独特的、高质量的、负担得起的交易工具,因为我们已经纳入了一些专有的功能和一个新的公式。想象一下,你的交易将如何改善,因为你能够准确地确定新趋势或剥头皮机会的触发点? 用户手册:点击这里   https://www.mql5.com/en/blogs/post/708876 它适用于所有时间框架。你将很快能够看到TREND! 根据新的基础算法设计,它使识别和确认潜在交易变得更加容易。这是因为它以图形方式显示了8种主要货币和一种符号的强弱。 该指标显示了8种主要货币(澳元加元瑞士法郎欧元英镑日元新西兰美元)的强弱线,再加上一个符号! 该指标显示了符号的真实价值。例如:对于XAUUSD(黄金):价格以美元报价。如果黄金在上涨,你怎么能知道是黄金的强势还是美元的弱势?只有当黄金走强时,我们才会进行
Currency Strength Wizard
Oleg Rodin
4.93 (44)
货币强度向导是一个非常强大的指标,为您提供成功交易的一体化解决方案。该指标使用多个时间范围内所有货币的数据来计算这个或那个外汇对的力量。此数据以易于使用的货币指数和货币电力线的形式表示,您可以使用它们来查看这种或那种货币的力量。 您所需要的只是将指标附加到您要交易的图表上,该指标将向您显示您交易的货币的真实强度。该指标还向您显示买卖量压力的极值,您可以在顺势交易时利用这些压力。该指标还显示了基于斐波那契的可能目标。该指标可用于各种交易时间范围。该指标支持各种货币对的交易。 该指标为您提供所有类型的警报,包括推送通知。 购买后请联系我。我将与您分享我的交易技巧,并免费为您提供丰厚的红利指标! 祝您交易愉快,获利丰厚!
TakePropips Donchian Trend Pro
Eric John Pajarillaga Aldana
4.44 (16)
TakePropips Donchian Trend Pro   (MT4) 是一款功能强大且有效的工具,可使用 Donchian 通道自动检测趋势方向,并为您提供进场和退场交易信号! 这个多功能指标包括趋势扫描器、交易信号、统计面板、筛选器、交易时段和警报历史仪表板。它旨在为您提供交易信号并节省您分析图表的时间! 您可以在我们的博文中下载用户手册和安装指南:   https   :// www.mql5.com/en/blogs/post/751368 今天立减 50%!价格从 98 美元降到 49 美元! 您可以在 Strategy Tester 上测试该指标(启用可视模式) 视频教程也可在说明下方获得更多详细信息。 如果您有任何问题或需要任何帮助,请与我联系。 TakePropips Donchian Trend Pro 指标适用于所有外汇对、金属、商品、指数和加密货币。 主要特点 交易信号 - 检测多个时间范围内所有货币对的买卖机会。它将为您提供警报并在图表上绘制交易信号,最多 3 个止盈价和一个止损价。 Trend Scanner   - 用于快速扫描和识别跨多个时间
自动在你的图表上画出支撑位和阻力位以及推动性蜡烛缺口,这样你就可以看到价格接下来可能会走向哪里和/或可能会逆转。 该指标旨在作为我的网站(The Market Structure Trader)上教授的头寸交易方法的一部分,并显示目标和潜在入场的关键信息。 该指标有两个核心功能和四个附加功能: 核心功能1 - 日线、周线和月线的自动支持和阻力线 该指标为你自动绘制过去2天以及6周和数月前的最新支撑和阻力水平。你可以完全自定义这些水平的外观以适合你,并显示多少个。这些关键水平通常作为主要的支持和阻力区,价格将从这里转向并回撤或逆转。它们也是价格将走向的目标,因此你可以迅速看到在价格可能转向之前交易的潜在距离。 核心特征2--推进型蜡烛缺口目标 推进性缺口蜡烛是银行和机构通过在任何市场上执行大额头寸而创造的强劲、快速的移动。这些大阳线一旦形成,有两个关键作用。 1. 1.它们作为一个方向性信号,因为大型市场参与者已经选择了一个方向,一旦发生,价格往往会在一段时间内继续移动。 2. 2.更重要的是,它们作为目标,因为这些区域往往会让其他大玩家的头寸 "越位",价格在绝大
Bomb Bank Signal
Igor Pereira Calil
5 (1)
炸彈銀行訊號:您對 MetaTrader 4 的信心指標 Bomb Bank Signal 是 MetaTrader 4 的一個強大指標,旨在識別金融市場中最相關的趨勢。如果您正在尋找一種能夠準確預測運動的工具,那麼炸彈庫就是您需要的盟友。 運作原理: 該指標結合了三種不同的方法——成交量分析、蠟燭收盤價和對稱趨勢——來偵測和發出買賣機會訊號。當炸彈銀行識別出買入機會時,它就像一顆「炸彈」;當它偵測到賣出訊號時,它就像一個「頭骨」。 為什麼炸彈銀行不一樣? 完全可靠性:炸彈庫訊號不會刪除訊號。訊號一旦發出,就會一直存在,確保您不會錯過任何機會。 極為準確:炸彈庫不會發出錯誤訊號。它會即時更新您的訊息,隨著市場的變化進行調整,但保持先前訊號的透明度。 即時更新:訊號被即時識別並在必要時更新,使您能夠快速響應市場變化。 最大化您的結果: 炸彈銀行訊號是識別趨勢持續走勢的理想選擇。例如,如果您已經做空並且指標在 M15 發出買入訊號,那麼現在就是平倉或部分下單的最佳時機,反之亦然。 此外,經過仔細分析,我們建議您遵循M30、H1和H4上的訊號,停損僅50點。這使
Trend Cutter
Oleg Rodin
5 (2)
Trend Cutter 是一种趋势指标,可用于任何时间范围,包括 M1 和 M5 等较低时间范围。该指标对于喜欢日内交易的交易者来说是理想的选择,并且对那些喜欢长期交易的交易者也有帮助。您可以使用该指标作为您的交易系统的基础或作为独立的交易解决方案。 该指标提供所有类型的警报,包括推送通知。 指标中有一个易于使用的输入参数,可让您按照您希望的方式调整信号。此选项将为您提供交易的灵活性。 您也可以在任何您想要的市场进行交易。 该指标非常容易使用。您只需遵循信号即可。我还将免费向该指标的所有用户提供附加指标,这将帮助您尽可能高效地使用该方法。 购买后请联系我以获得我的交易提示和丰厚奖金! 感谢您的关注! 祝您交易顺利、盈利!
ADR Reversal Indicator
LEE SAMSON
4.15 (13)
ADR 反轉指標一目了然地顯示當前價格相對於其正常平均每日範圍的交易位置。當價格超過您選擇的平均範圍和高於它的水平時,您將通過彈出窗口、電子郵件或推送獲得即時警報,以便您可以快速跳入回調和反轉。該指標在圖表上在平均每日範圍極值處繪製水平線,並在這些水平之上延伸,這些水平附加了價格超過它們的數學概率。下面的更多細節...... ADR 警報儀表板補充指標並監控所有配對也可在此處獲得: https://www.mql5.com/en/market/product/62756 MT5 版本也可在此處獲得: https://www.mql5.com/en/market/product/64477/ 大約 60% 的時間價格在其正常的平均每日範圍 (ADR) 內交易並推高這些水平通常是價格急劇波動的指標,通常會出現回調(獲利了結)走勢。您可以通過交易從每日範圍的頂部或底部回落到最近的支撐位或阻力位來利用這些急劇波動。 收集了超過 20 年的歷史數據,以找出主要外匯對和一系列交叉盤的價格超出特定 ADR 水平的平均百分比。該數據表明價格僅在 3% 的時間內超過其 ADR 的 20
IX Power MT4
Daniel Stein
5 (5)
IX Power 终于将 FX Power 的无与伦比的精确性带到了非外汇交易符号中。 它能准确判断您喜爱的指数、股票、商品、ETF 甚至加密货币的短期、中期和长期趋势强度。 您可以 分析 终端提供的 一切 。试试吧,体验一下您在交易时如何把握 时机 。 IX Power 主要功能 100% 精确的非重绘计算结果 - 适用于您终端中的所有交易符号 下拉式选择预配置以及可单独配置的强度分析周期 通过电子邮件、消息和手机通知的无数种通知选项 可访问的 EA 请求缓冲区 可自定义计算限制,以获得更好的性能 为希望查看更多信息的用户提供特殊的多实例设置 无尽的图形设置,让您在每个图表中都能找到最喜欢的颜色 采用 Windows 11 和 macOS 风格的圆角新面板设计 神奇的移动指标面板,可在子窗口和主图表之间无缝移动 适用于高分辨率 QHD、UHD 和 4K 显示器,并针对平板电脑和触摸屏进行了优化 IX Power 参数 最重要的参数不言自明,但我们很快会在另一篇文章中为您提供所有 IX Power 参数的完整说明。 使用别名 "参数可为技术交易
Trend Pulse
Mohamed Hassan
5 (4)
Please contact me after purchase to immediately get your PDF strategy + documentation for Trend Pulse !  Introducing Trend Pulse , a unique and robust indicator capable of detecting bullish, bearish, and even ranging trends! Trend Pulse uses a special algorithm to filter out market noise with real precision. If the current symbol is moving sideways, Trend Pulse will send you a ranging signal, letting you know that it's not a good time to enter a trade. This excellent system makes Trend Pulse
Order Block Hunter
Noha Mohamed Fathy Younes Badr
5 (4)
Order block hunter indicator is the best indicator for  hunt the order blocks that area where there has been a large concentration of limit orders waiting to be executed Order blocks are identified on a chart by observing previous price action and looking for areas where the price experienced significant movement or sudden changes in direction .This indicator does that for you by using very complicated codes and helps you to take the best areas To buy and sell because it make marks at the best a
Stratos Pali
Michela Russo
Stratos Pali Indicator   is a revolutionary tool designed to enhance your trading strategy by accurately identifying market trends. This sophisticated indicator uses a unique algorithm to generate a complete histogram, which records when the trend is Long or Short. When a trend reversal occurs, an arrow appears, indicating the new direction of the trend. Important Information Revealed Leave a review and contact me via mql5 message to receive My Top 5 set files for Stratos Pali at no cost! D
RSI / TDI 警报仪表板允许您一次监控您交易的每个主要货币对的 RSI(由您选择)。 您可以通过两种方式使用它: 1. 选择多个时间框架,当有多个时间框架超出正常交易条件时,破折号会显示给您。一个很好的指标表明价格最近在推高,因为它在多个时间范围内达到了超买或超卖水平,因此很快就会出现回调或逆转。 2. 使用一个时间框架(您最喜欢的交易)和多个 RSI 水平向您展示该时间框架内 RSI 扩展的强度。当价格在一个方向上非常猛烈地推动太长时间并且市场应该出现获利了结时,这是一种进行均值回归交易的好策略。在示例屏幕截图中,您可以看到 H4 RSI 在 25 水平之上扩展了 2 对,这比典型的价格走势要远得多,因此是做多的好机会。 当蜡烛在所选时间范围内收盘时,仪表板将提醒您选择水平的扩展条件(超买和​​超卖)。您可以同时监控 6 个单独的 RSI。您可以独立选择每个时间范围、类型以及超买和超卖水平。 此处提供 MT5 版本: https://www.mql5.com/en/market/product/66307 您可以立即查看任何货币对的状况,并选择那些
作者的更多信息
Never miss when a pair is being oversold or overbought again!! This RSI dashboard allows you to monitor RSI levels on 6 different time frames for up to 30 different currency pairs. This dashboard is packed with features including: 1. Monitoring of 6 customizable time frames (M1, M5, M15, M30, H1, H4, D1, W1, M1) 2. You can set the overbought/oversold levels you want for EACH time frame and they will be highlighted in the dashboard when a pair gets to that level 3. You can also set the RSI perio
筛选:
无评论
回复评论