Gap Indicator 123 Gap
- Indicators
- Matthew Thomas Paranac
- Version: 1.0
- Activations: 10
Fair Value Gap Indicator (123 Gap): Precision Tool for Identifying Potential Price Targets
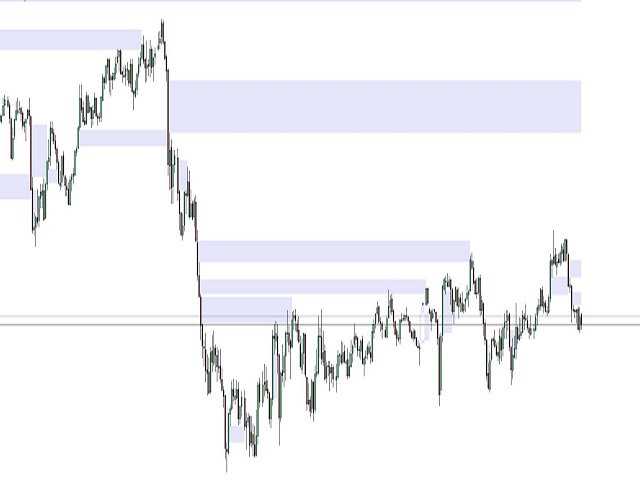
The Fair Value Gap Indicator (123 Gap) is a powerful tool designed to identify high-probability price targets based on market structure. By analyzing sets of three consecutive candles, this indicator pinpoints crucial gaps that often serve as magnets for price action.How It Works
- Continuous Analysis: The indicator scans every set of three consecutive candles on your chart.
- Gap Identification: It calculates the gap between the first and third candles in each set.
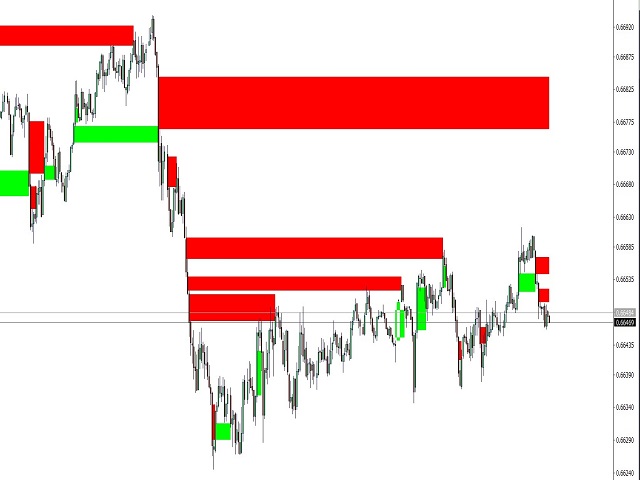
- Visual Representation: Identified gaps are displayed on the chart, color-coded for easy interpretation.
Key Benefits
- Predict Potential Reversals: Highlights areas where price may return after a trend reversal.
- Identify Pullback Targets: Pinpoints levels where price might pause during a pullback.
- Enhance Trade Entries and Exits: Use gap levels to refine your entry and exit points.
Real-World Example
In a downtrend scenario:- First candle's low: 1.0000
- Third candle's high: 0.9950
- The indicator will highlight the gap between 0.9950 and 1.0000 as a potential upside target.
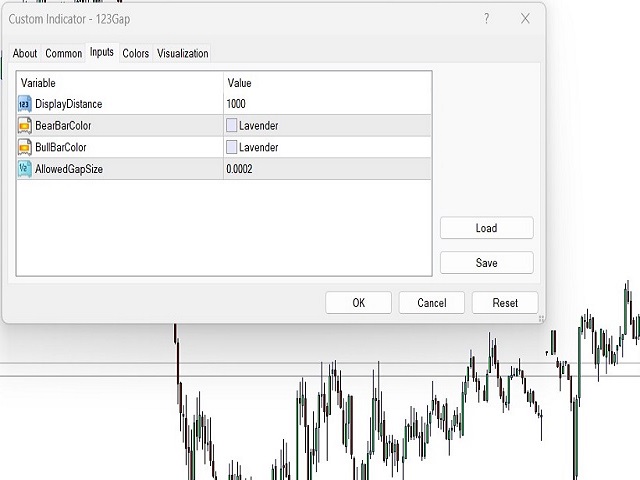
Customizable Settings
- Display Distance: Adjust how far back the indicator looks for gaps.
- BearBarColor: Customize the color for gaps in downtrends.
- BullBarColor: Set the color for gaps in uptrends.
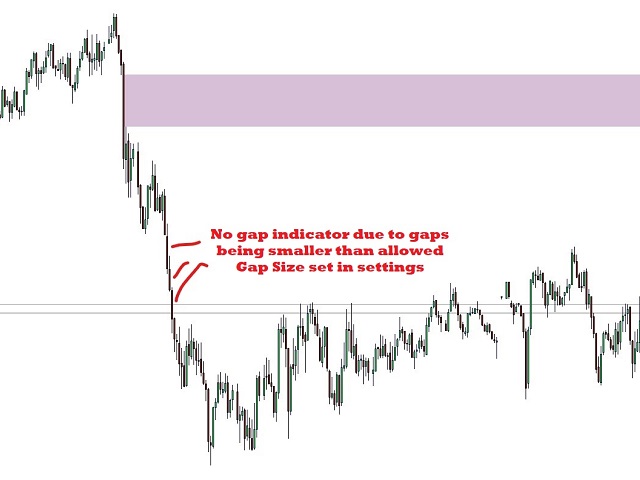
- AllowedGapSize: Define the minimum gap size to be highlighted.
Perfect For
- Swing traders looking for precise entry and exit points
- Day traders seeking to identify intraday reversal levels
- Trend traders wanting to spot potential pullback targets