HowTradeFractalZFS
- 指标
- Vasiliy Smirnov
- 版本: 1.0
- 激活: 20
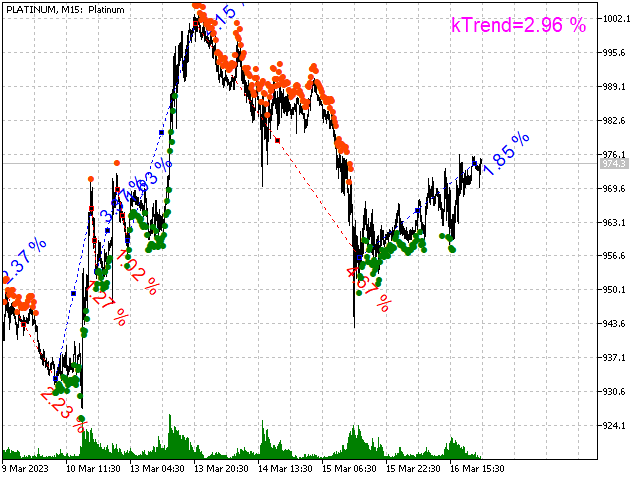
用于分析交易结果的图形指标,箭头指标,顾问的工作,交易策略的开发。
一个主要参数是利润的最小百分比。
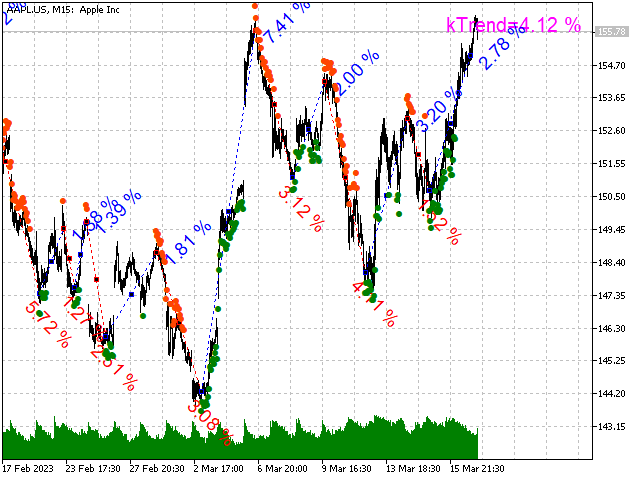
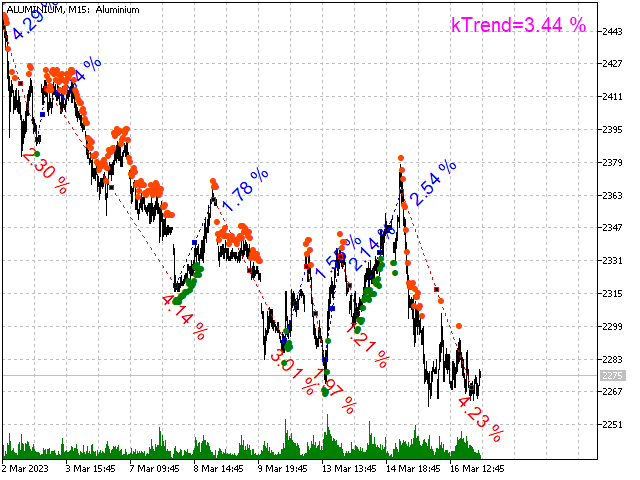
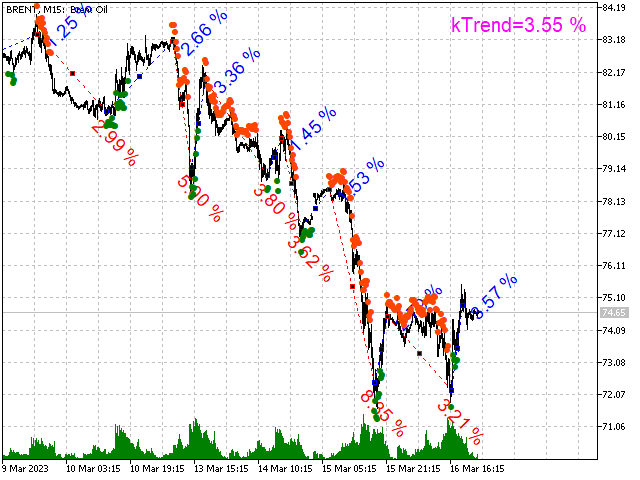
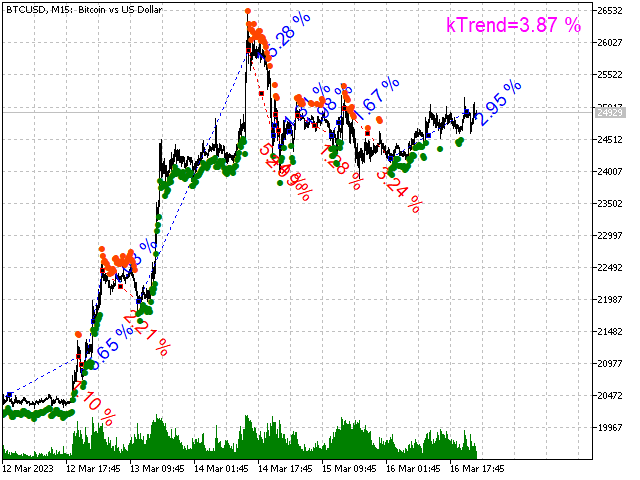
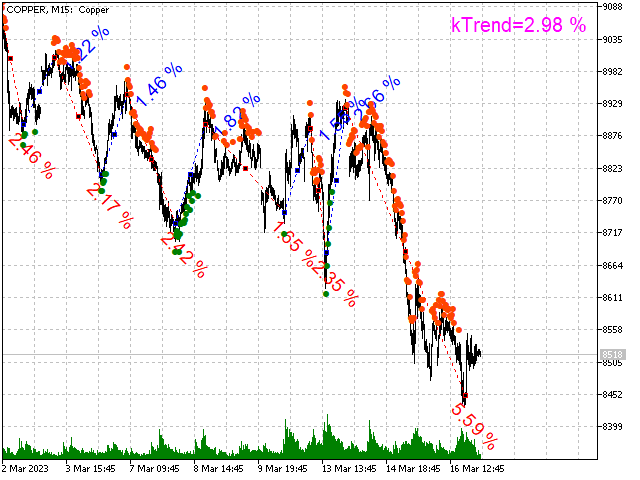
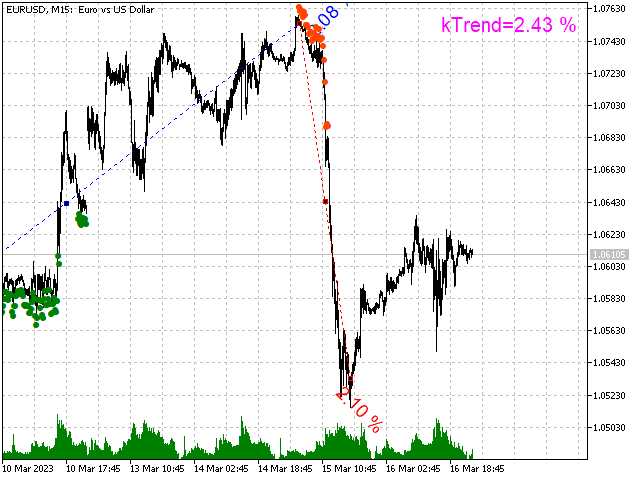
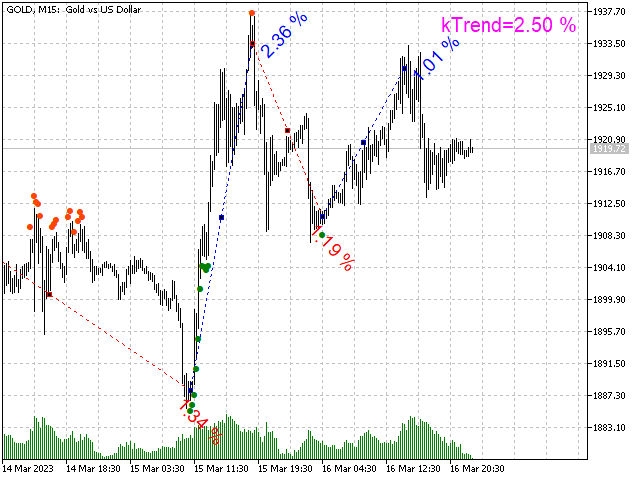
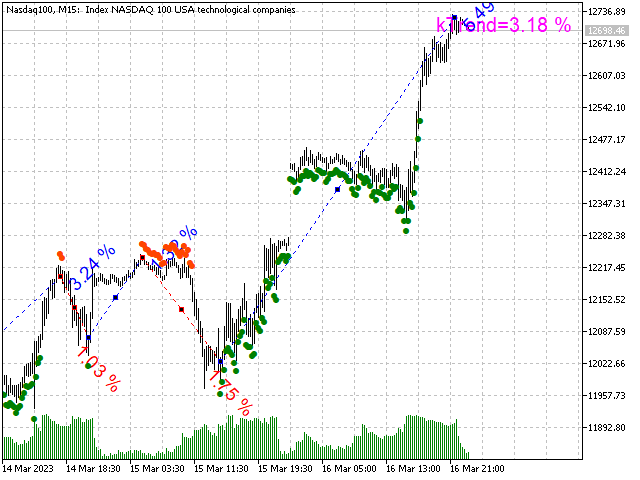
该指标显示任何图表上的所有趋势,考虑到封闭柱和分形,计算每个趋势中利润的最大百分比。
另外计算仪器的平均利润百分比。 这些工具中较大的百分比表明这种工具对投机的历史吸引力。
要加快指标速度,请使用较小的计算间隔。
用于分析交易结果的图形指标,箭头指标,顾问的工作,交易策略的开发。
一个主要参数是利润的最小百分比。
该指标显示任何图表上的所有趋势,考虑到封闭柱和分形,计算每个趋势中利润的最大百分比。
另外计算仪器的平均利润百分比。 这些工具中较大的百分比表明这种工具对投机的历史吸引力。
要加快指标速度,请使用较小的计算间隔。