Vasiliy Smirnov / 卖家
已发布的产品
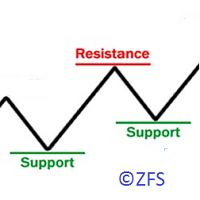
The indicator displays the resistance/support levels based on the history data of price action. It requires a depth of history to calculate the levels. The tool has been developed using an original proprietary technique. The resistance and support levels indicate the accumulations of orders.
Indicator Parameters Start Data/Time - initial date/time of the history data for calculation of levels Width of Lines Resistance/Support in Points - thickness (density) of lines in points, it is recommended
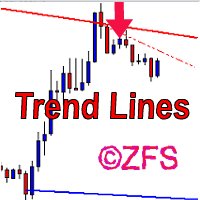
The indicator draws channels. The estimated movement of the price within the channel is shown with a dotted line. The lines of the channel are the support and resistance lines. This allows using them in both rebound and breakout trading. The inclination of the channel allows determining the direction of the current trend, the channel width and angle allow estimating the current volatility. The channels are based on fractal bars, determined using the author's original method, 4 dimensions from th

The main function of the indicator is to draw the target lines (support and resistance lines). The lines are plotted according to a special fractal algorithm. The lines are calculated with consideration of the zero bar. A different, more complicated calculation algorithm is used on the zero bar, in contrast to the other bars. This allows reacting to the market situation in real time, but on the other hand, redrawing is possible on the zero bar. If necessary, the zero bar can be omitted from calc

Пинбар — это лишь 1 свечка или бар, представляющая собой цену, что отскочила от максимального или минимального ценового уровня. Свечка открылась, цена пошла в одном направлении и затем резко развернулась за период свечи — так формируется пинбар. Пинбар легко заметить — длинная тень (хвост), маленькое тело. Запомните: не все свечи с длинным хвостом являются пинбарами. Только когда хвост намного больше тела свечи, формируется пинбар. Как правило, рынок при этом закрывается там, где открылся или по

A regression channel based on roughened fractals.
Parameters:
Period ReCalculate - indicator calculation period
switch Zero (Last) Bar-count the last open bar?
switch Push notifications when changing the position of the rounded price relative to the channel
Line Risk-displaying the risk line
Coeff Risk,% - the maximum percentage in the transaction as a percentage
The channel allows you to evaluate the trend and its strength in the market and correctly place a request for a transaction with the r

用于分析交易结果的图形指标,箭头指标,顾问的工作,交易策略的开发。
一个主要参数是利润的最小百分比。
该指标显示任何图表上的所有趋势,考虑到封闭柱和分形,计算每个趋势中利润的最大百分比。
另外计算仪器的平均利润百分比。 这些工具中较大的百分比表明这种工具对投机的历史吸引力。
要加快指标速度,请使用较小的计算间隔。 用于分析交易结果的图形指标,箭头指标,顾问的工作,交易策略的开发。
一个主要参数是利润的最小百分比。
该指标显示任何图表上的所有趋势,考虑到封闭柱和分形,计算每个趋势中利润的最大百分比。
另外计算仪器的平均利润百分比。 这些工具中较大的百分比表明这种工具对投机的历史吸引力。
要加快指标速度,请使用较小的计算间隔。