Visual Bollinger Bands Divergence
- 指标
- Luiz Felipe De Oliveira Caldas
- 版本: 1.0
- 激活: 20
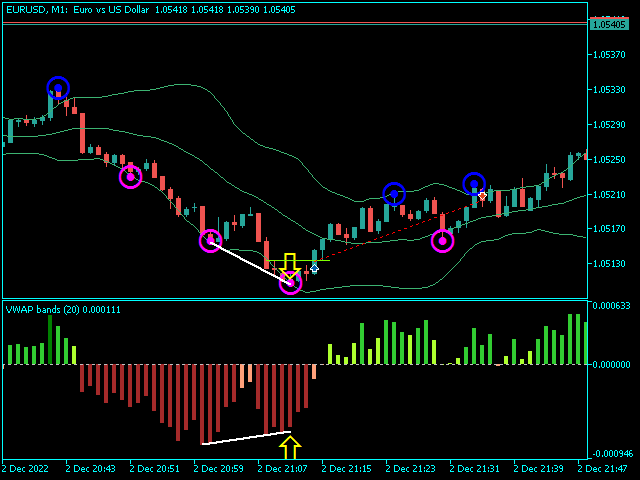
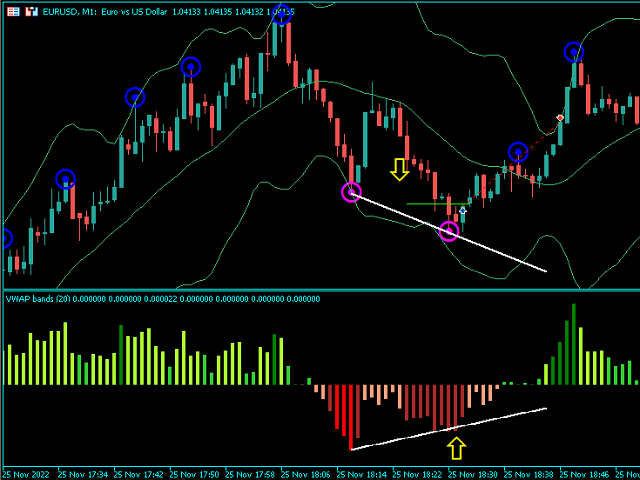
VWAP 波段视觉样式 1.0
金融市场指标是交易者和投资者用来分析金融市场和做出决策的重要工具。 VWAP 和布林带是交易者用来衡量市场趋势和价格波动的两种流行技术分析工具。在此产品中,我们建议结合这两个指标来创建一个独特的产品,提供对市场趋势和波动性的全面分析。该产品非常适合希望根据数据驱动分析做出明智决策的交易者和投资者。
背离策略是一种流行的技术分析技术,交易者使用它来识别市场中潜在的趋势逆转。该策略依赖于识别价格走势和技术指标之间的差异。在本节中,我们将使用视觉风格和布林带描述背离策略。
例如,使用 Visual Style 和 Bollinger Bands 的背离策略是一种流行的技术分析技术,交易者使用它来识别市场中潜在的趋势逆转。该策略依赖于识别 RSI 和证券价格行为之间的差异。通过使用此策略,交易者可以根据数据驱动的分析做出明智的决策,从而实现更有利可图的交易和投资。


用户没有留下任何评级信息