Long Short Pro
- 指标
- Thalles Nascimento De Carvalho
- 版本: 2.0
- 激活: 5
Long & Short 指标 - Pro 版:解锁无限市场分析潜力! 📈🚀
🌟 适用于任何资产的无限制
Long & Short 指标的 Pro 版允许您在任何金融资产上使用,无需再受限 - 将同一指标应用于您所有的首选资产!
🔓 无任何限制
享受指标的所有功能,不受任何限制。Pro 版提供完整且无限制的体验,确保您能够最大化每一个市场机会。
💡 Pro 版特点
- 无限访问:在所有金融资产上使用指标,探索其全部潜力。
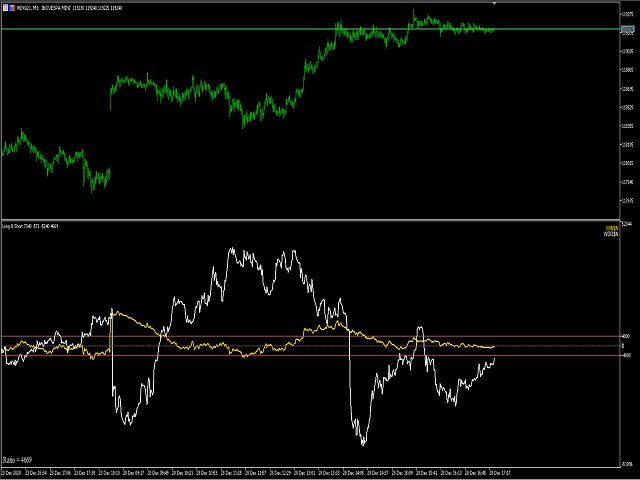
- 高级精确度:受益于详细的分析和清晰的信号,以做出明智且安全的决策。
- 完全灵活:根据您的具体交易需求调整指标,无论是资产还是策略。
🔔 接收关键机会的提醒
启用提醒,密切监控重要水平,确保您始终领先于市场机会。
EA 构建的缓冲区参数
构建 Expert Advisors (EAs) 时,请使用以下缓冲区:
- 缓冲区符号 1 = 0
- 缓冲区符号 2 = 2
为什么选择 Pro 版?
🔹 完全自由:将指标应用于任何资产,无限制使用。 🔹 完整体验:享受所有功能和详细分析。 🔹 全面分析:适合那些希望在各种市场中最大化其潜力的交易者。
🌟 立即获取 Pro 版! 🌟
不要错过通过 Long & Short 指标 Pro 版提升您的市场分析能力的机会。解锁所有功能,提升您的交易水平: 购买 Pro 版
将您的市场分析提升到新的水平!