Long Short Pro
- Göstergeler
- Thalles Nascimento De Carvalho
- Sürüm: 2.0
- Etkinleştirmeler: 5
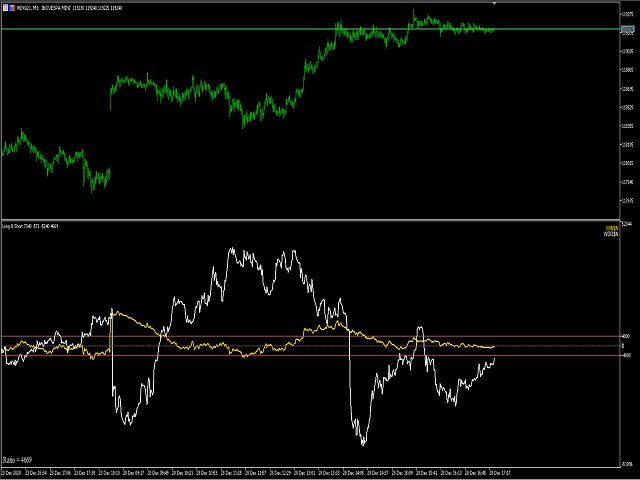
Long & Short Göstergesi - Pro Versiyon: Pazar Analizinizi Sınırsız Olanaklarla Güçlendirin! 📈🚀
🌟 Tüm Varlıklar İçin Sınırsız Kullanım
Long & Short göstergesinin Pro versiyonu, herhangi bir finansal varlık üzerinde tam özgürlük sunar. Artık sınırlama olmadan aynı göstergiyi tüm tercih ettiğiniz varlıklara uygulayabilirsiniz!
🔓 Sınırsız Erişim
Göstergeyi hiçbir kısıtlama olmadan kullanmanın tadını çıkarın. Pro versiyonu, size tam ve sınırsız bir deneyim sunarak her piyasa fırsatını en üst düzeyde değerlendirmenizi sağlar.
💡 Pro Versiyonun Özellikleri
- Sınırsız Erişim: Göstergeyi tüm finansal varlıklarda kullanın ve potansiyelini tam anlamıyla keşfedin.
- Gelişmiş Hassasiyet: Detaylı analizler ve net sinyaller ile bilinçli ve güvenli kararlar alın.
- Tam Esneklik: Göstergeyi, varlık veya stratejiden bağımsız olarak, özel ticaret ihtiyaçlarınıza göre ayarlayın.
🔔 Önemli Fırsatlar İçin Bildirimler Alın
Bildirimleri etkinleştirin ve önemli seviyeleri yakından takip ederek piyasa fırsatlarında her zaman bir adım önde olun.
EA Oluşturma İçin Buffer Parametreleri
Expert Advisors (EA) oluştururken aşağıdaki buffer'ları kullanın:
- Buffer Sembol 1 = 0
- Buffer Sembol 2 = 2
Neden Pro Versiyonunu Tercih Etmelisiniz?
🔹 Tam Özgürlük: Göstergeyi herhangi bir varlıkta sınırsız şekilde uygulayın. 🔹 Tam Deneyim: Tüm özelliklere ve detaylı analizlere erişin. 🔹 Kapsamlı Analiz: Çeşitli piyasalarda potansiyelinizi en üst düzeye çıkarmak isteyen yatırımcılar için ideal.
🌟 Şimdi Pro Versiyonu Edinin! 🌟
Long & Short göstergesinin Pro versiyonu ile piyasa analizlerinizi geliştirme fırsatını kaçırmayın. Sınırsız özellikleri açın ve ticaretinizi bir sonraki seviyeye taşıyın: Pro Versiyonunu Satın Alın
Pazar analizlerinizi bir üst seviyeye taşıyın!