• 概述
  • 评论 (39)
  • 评论 (83)
  • 新特性

Trading box Technical analysis

5

Summer 40% discount ($149 -> $88)

Everything for chart Technical Analysis indicator mt4 in one tool

Draw your supply demand zone with rectangle and support resistance with trendline and get alerts to mobile phone or email alert - Risk reward indicator

Video tutorials, manuals, DEMO download hereFind contacts on my profile.


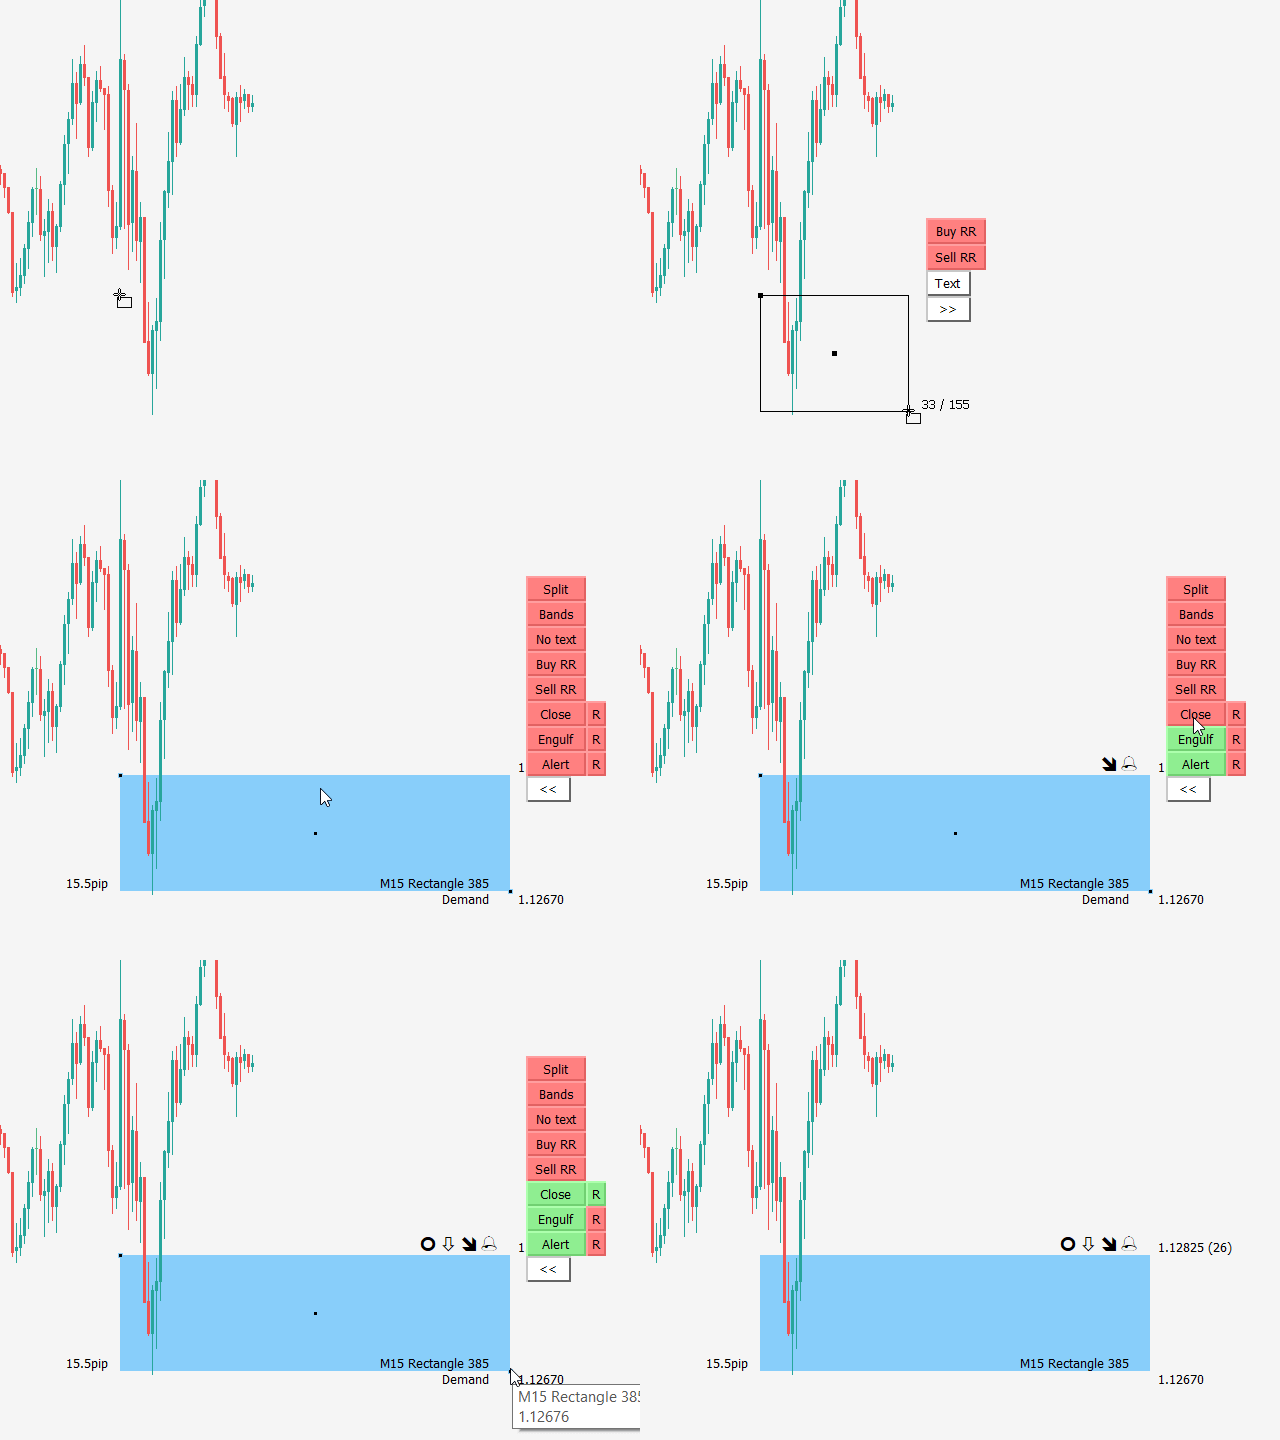
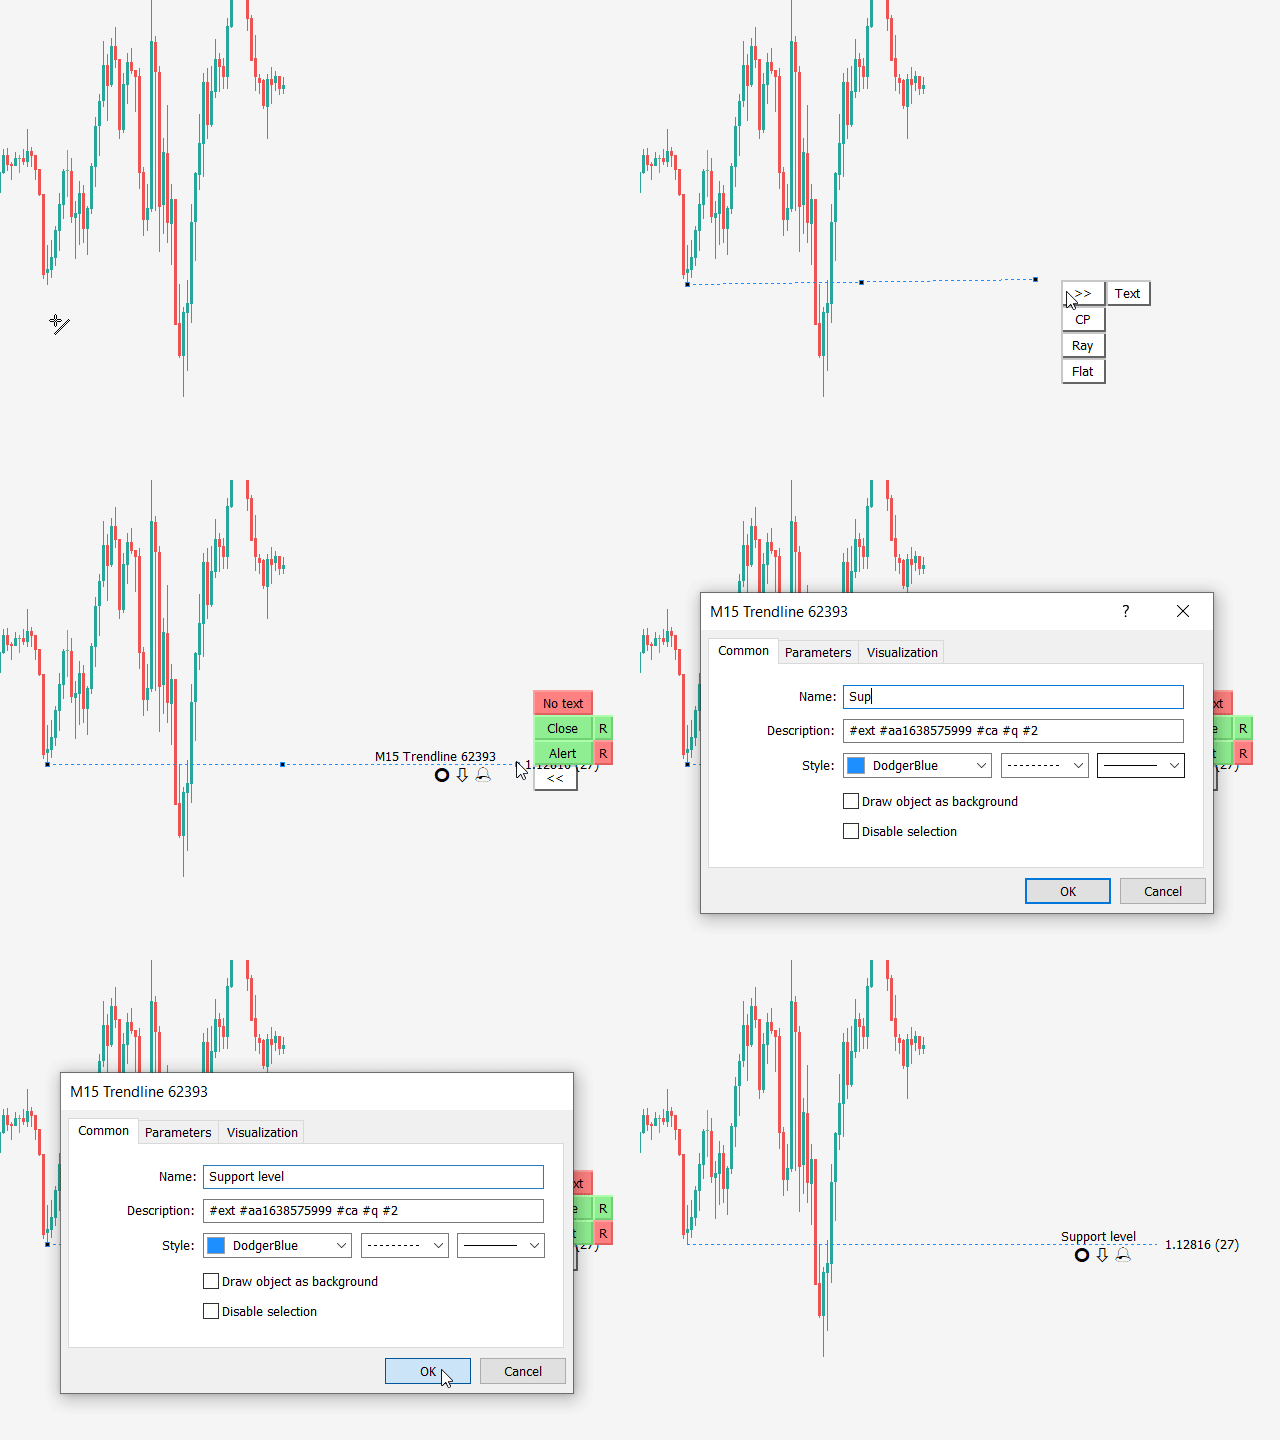
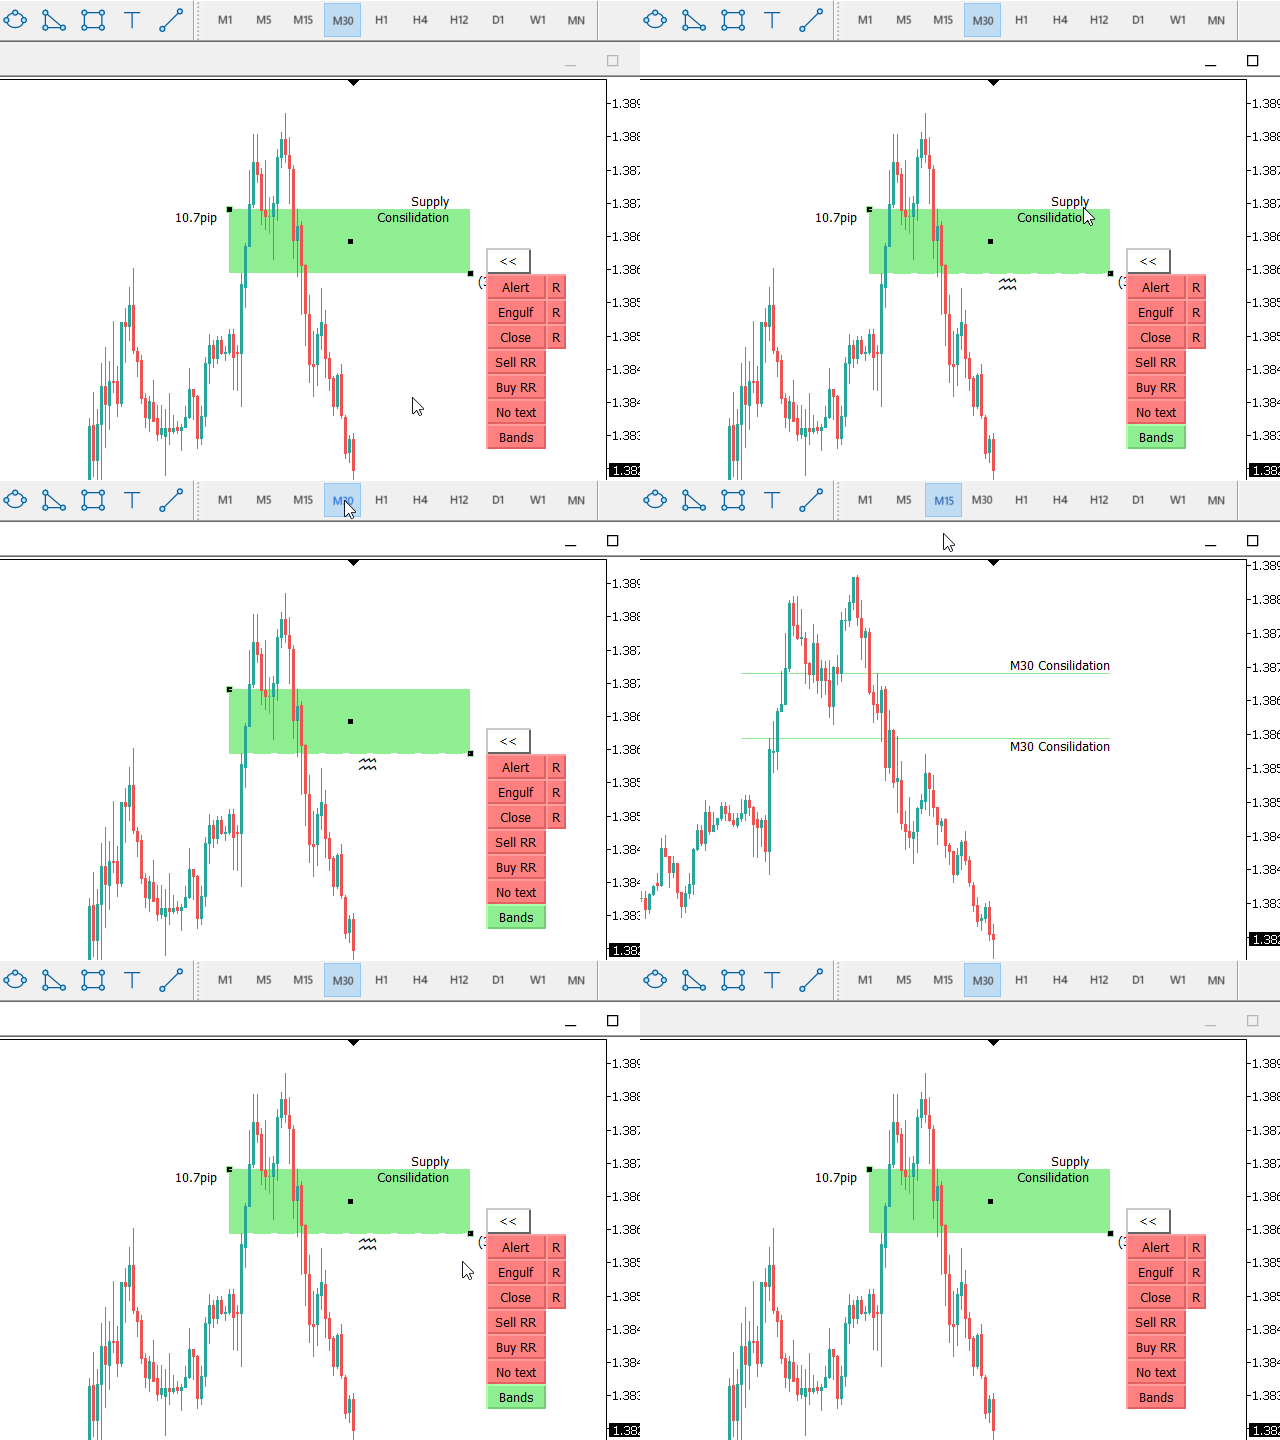
1. Extended rectangles and trendlines

Object will be extended to the right edge of the chart when price will draw new candles on chart. This is rectangle extender or trendline extender.

2. Price touch alert

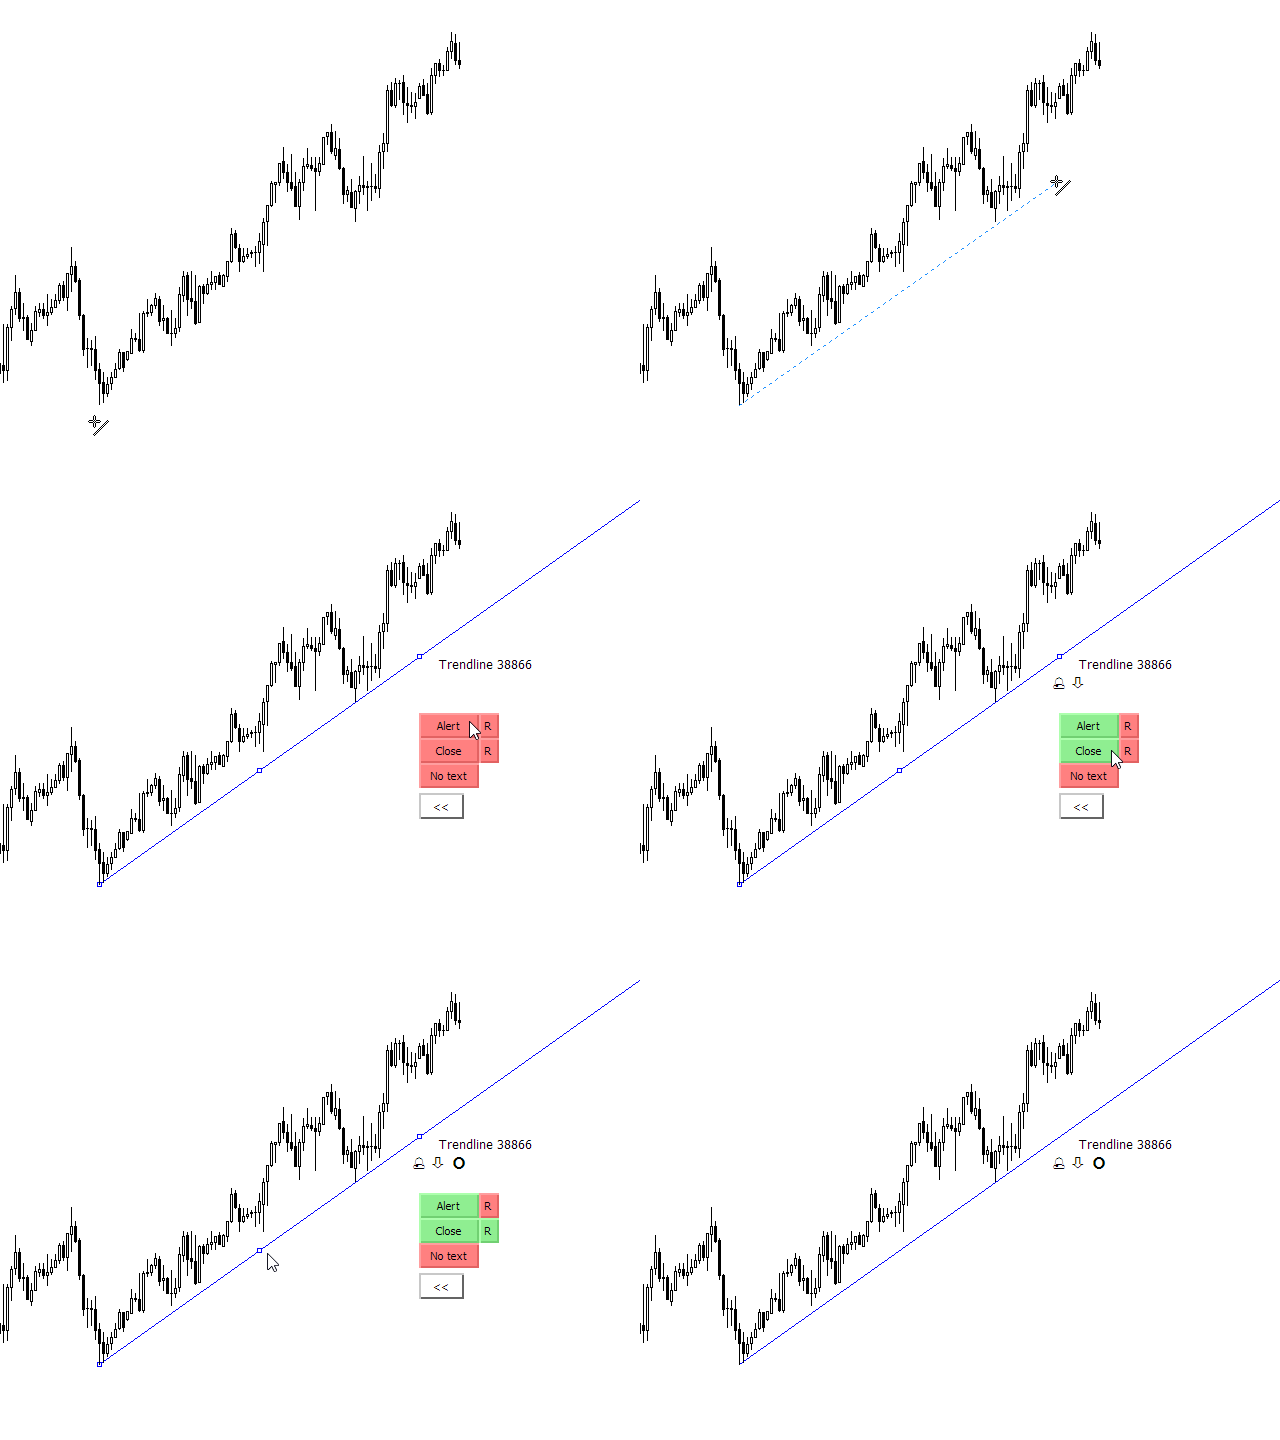
  1. Alert will be triggered when price will touch extended rectangle or extended trendline
  2. Trendline alert is also available for rayed angled trendline
  3. Alerts can be sent to mobile push notification, email and MetaTrader popup alert

3. Engulf alert

Alert will be triggered when price will break rectangle supply demand zone

4. Candle Close alert
Alert will be triggered when candle will close outside of the rectangle or trendline
    5. Trendline Retest alert

    Button "Retest" is used for breakout and retest strategy. Breakout Retest triggers an alert if the candle closes beyond trendline and then price touches trendline for retest

    6. Fakeout alert indicator

    Detect candle pin bar or candle engulfing pattern created. We use false breakout indicator alert for fakeout trading.

    7. Sound repeat after Alert, Engulf, Close, Retest, Fakeout

    R button will enable you repeat alert sound every few seconds. Audible alert, text alert

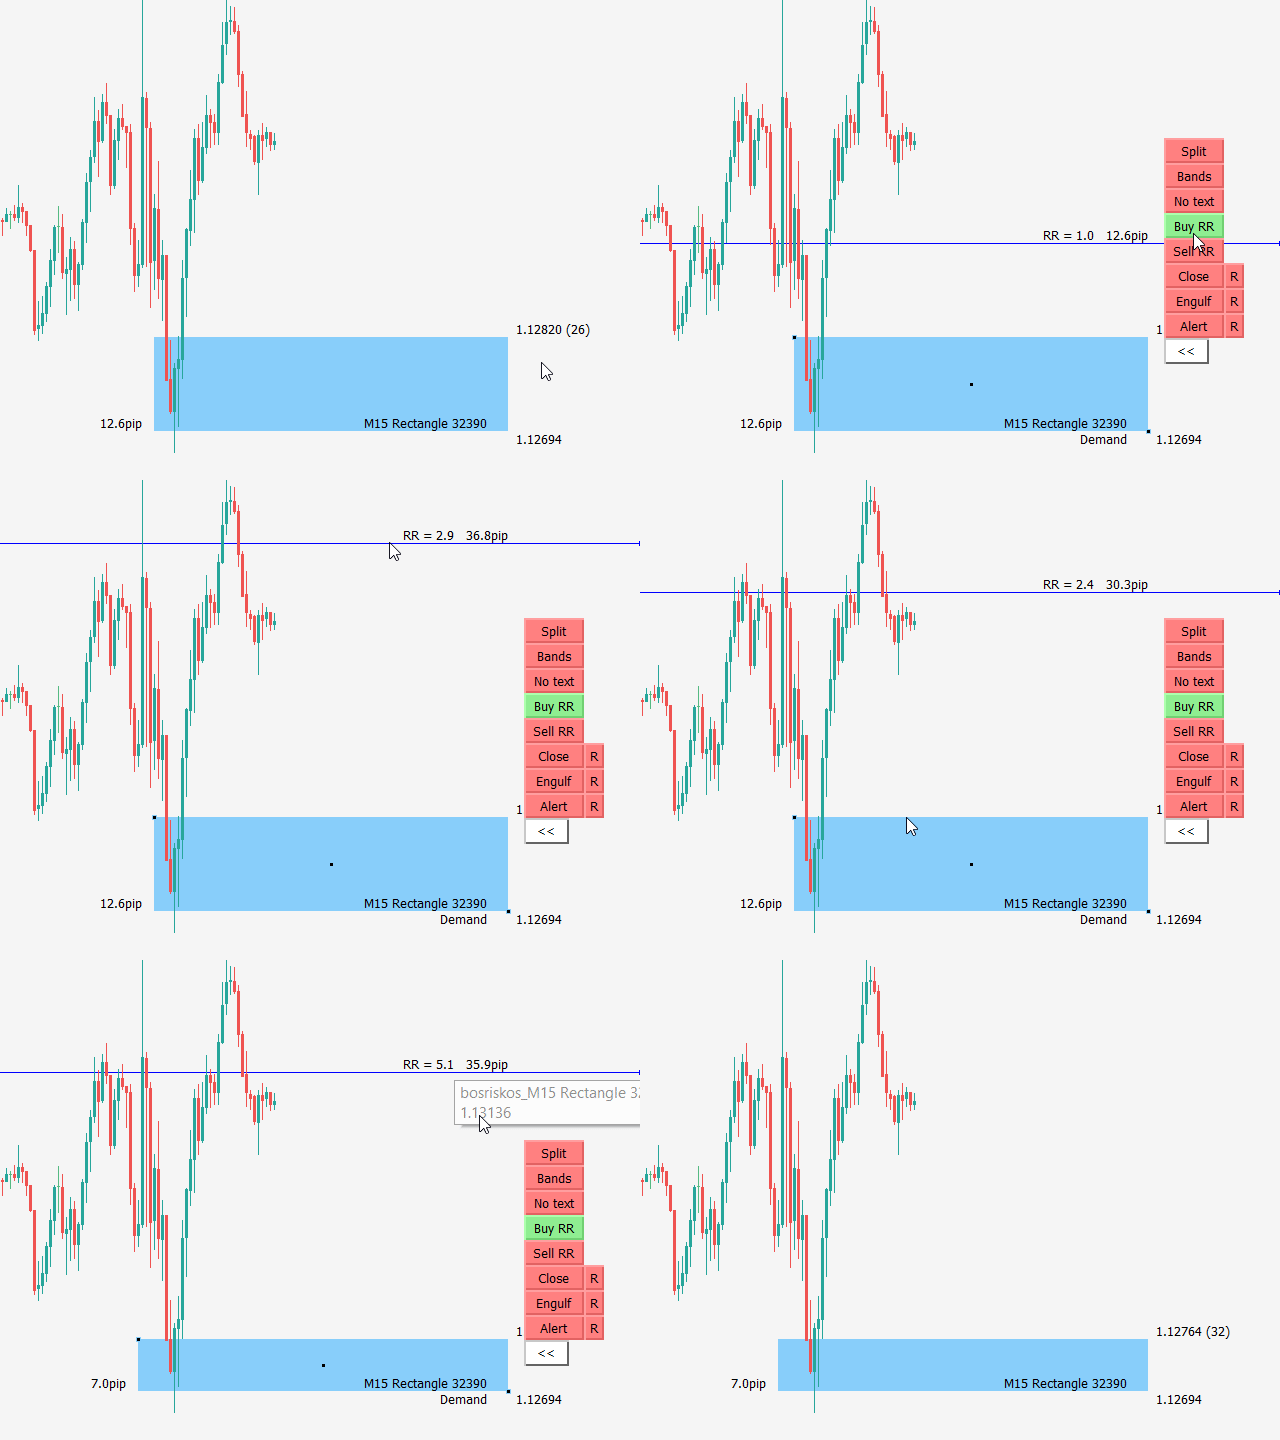
    8. Risk reward ratio calculation tool

    Risk reward ratio calculation for rectangles

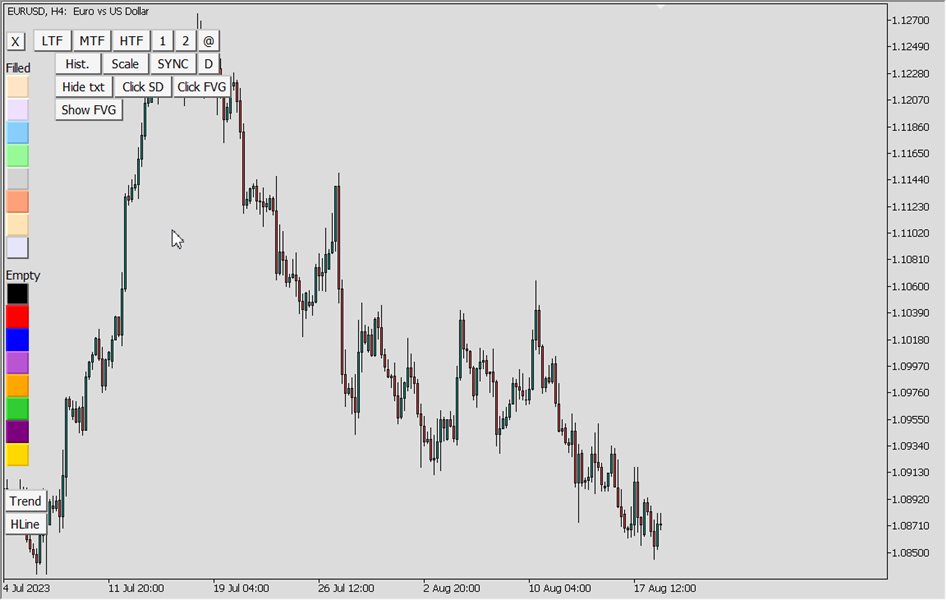
    9. Color change buttons

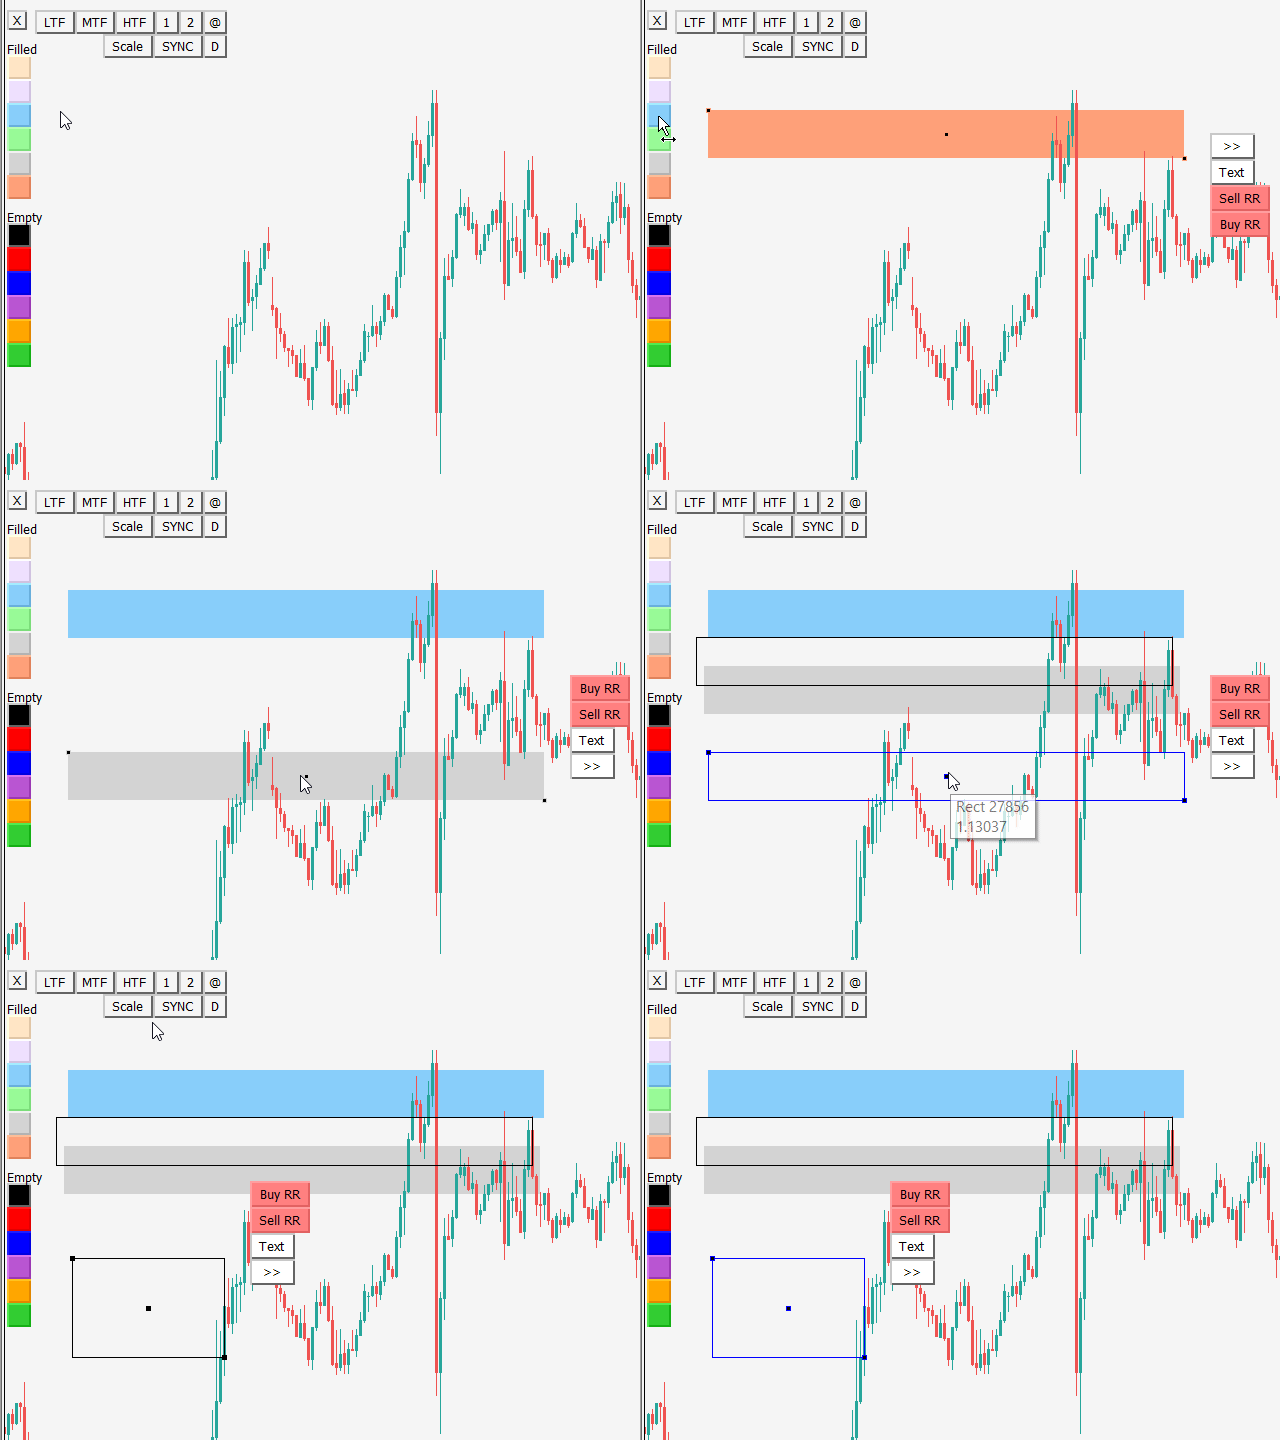
    Quickly change color for selected object with color button click. If no object is selected then color buttons will create a new rectangle

    10. Text button - object name text position

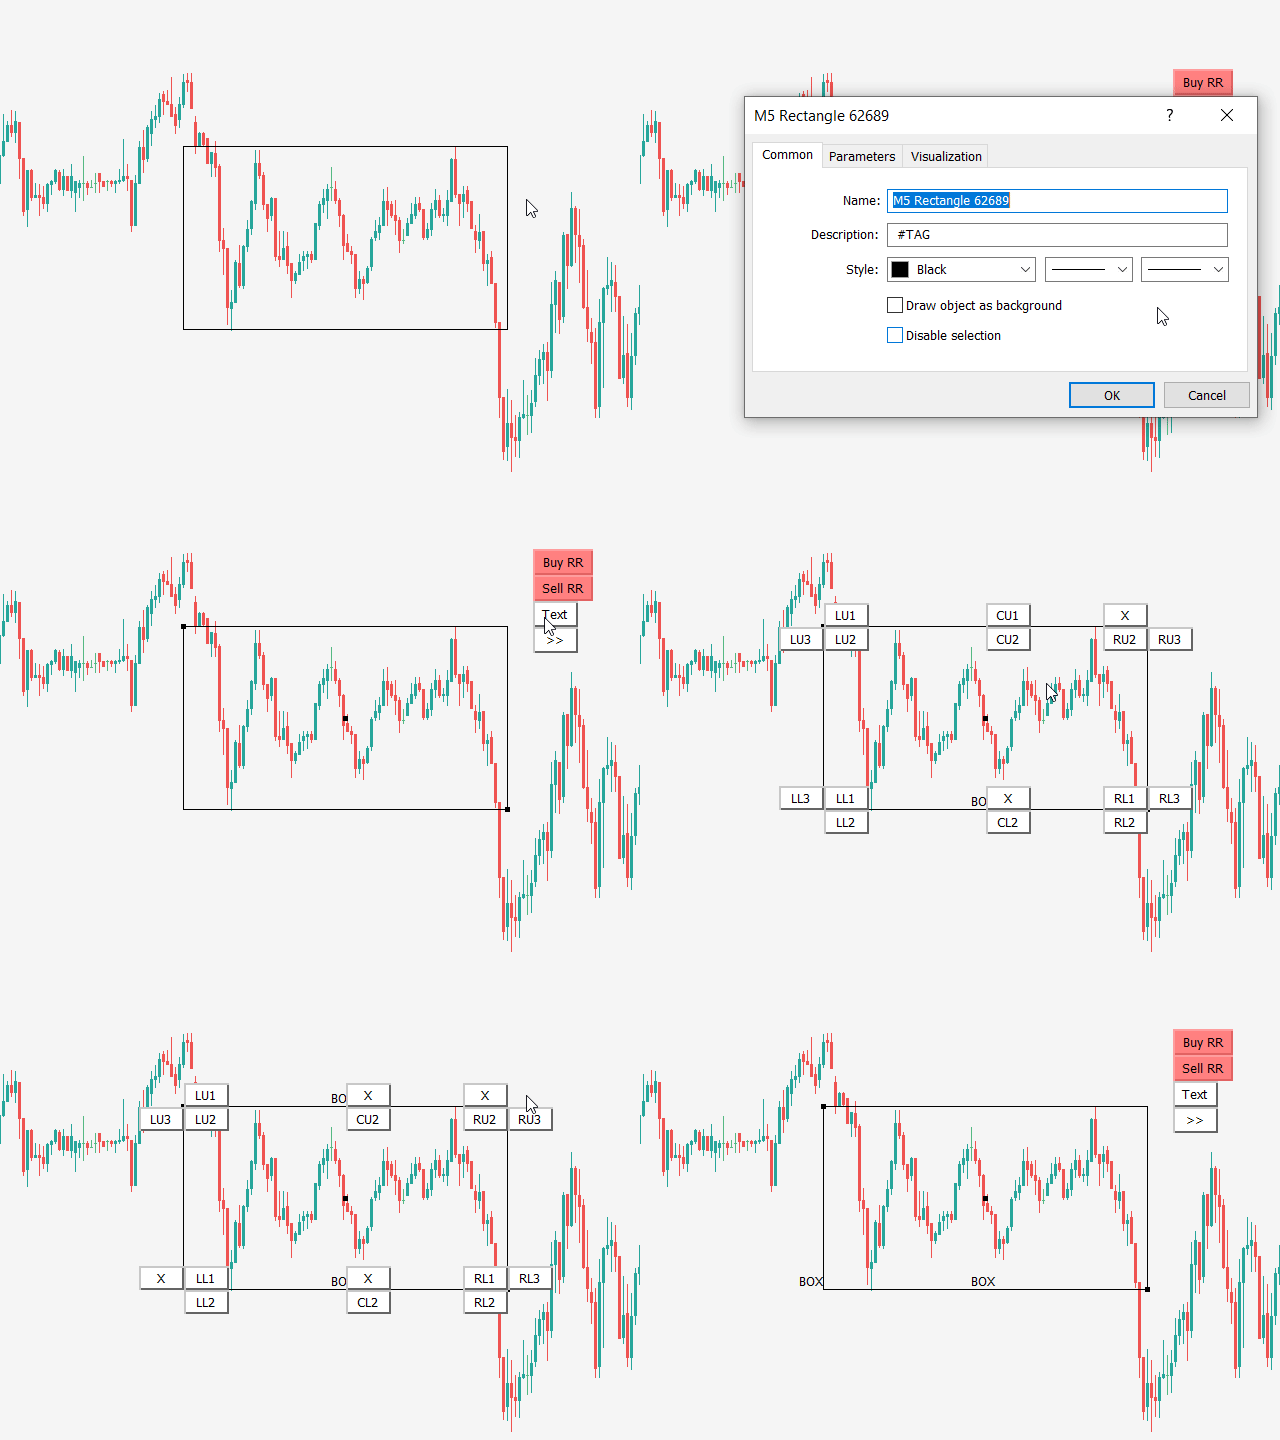
    Display rectangle or trendline text in all possible spots around or inside object. This works for non-extended rectangles and trendlines

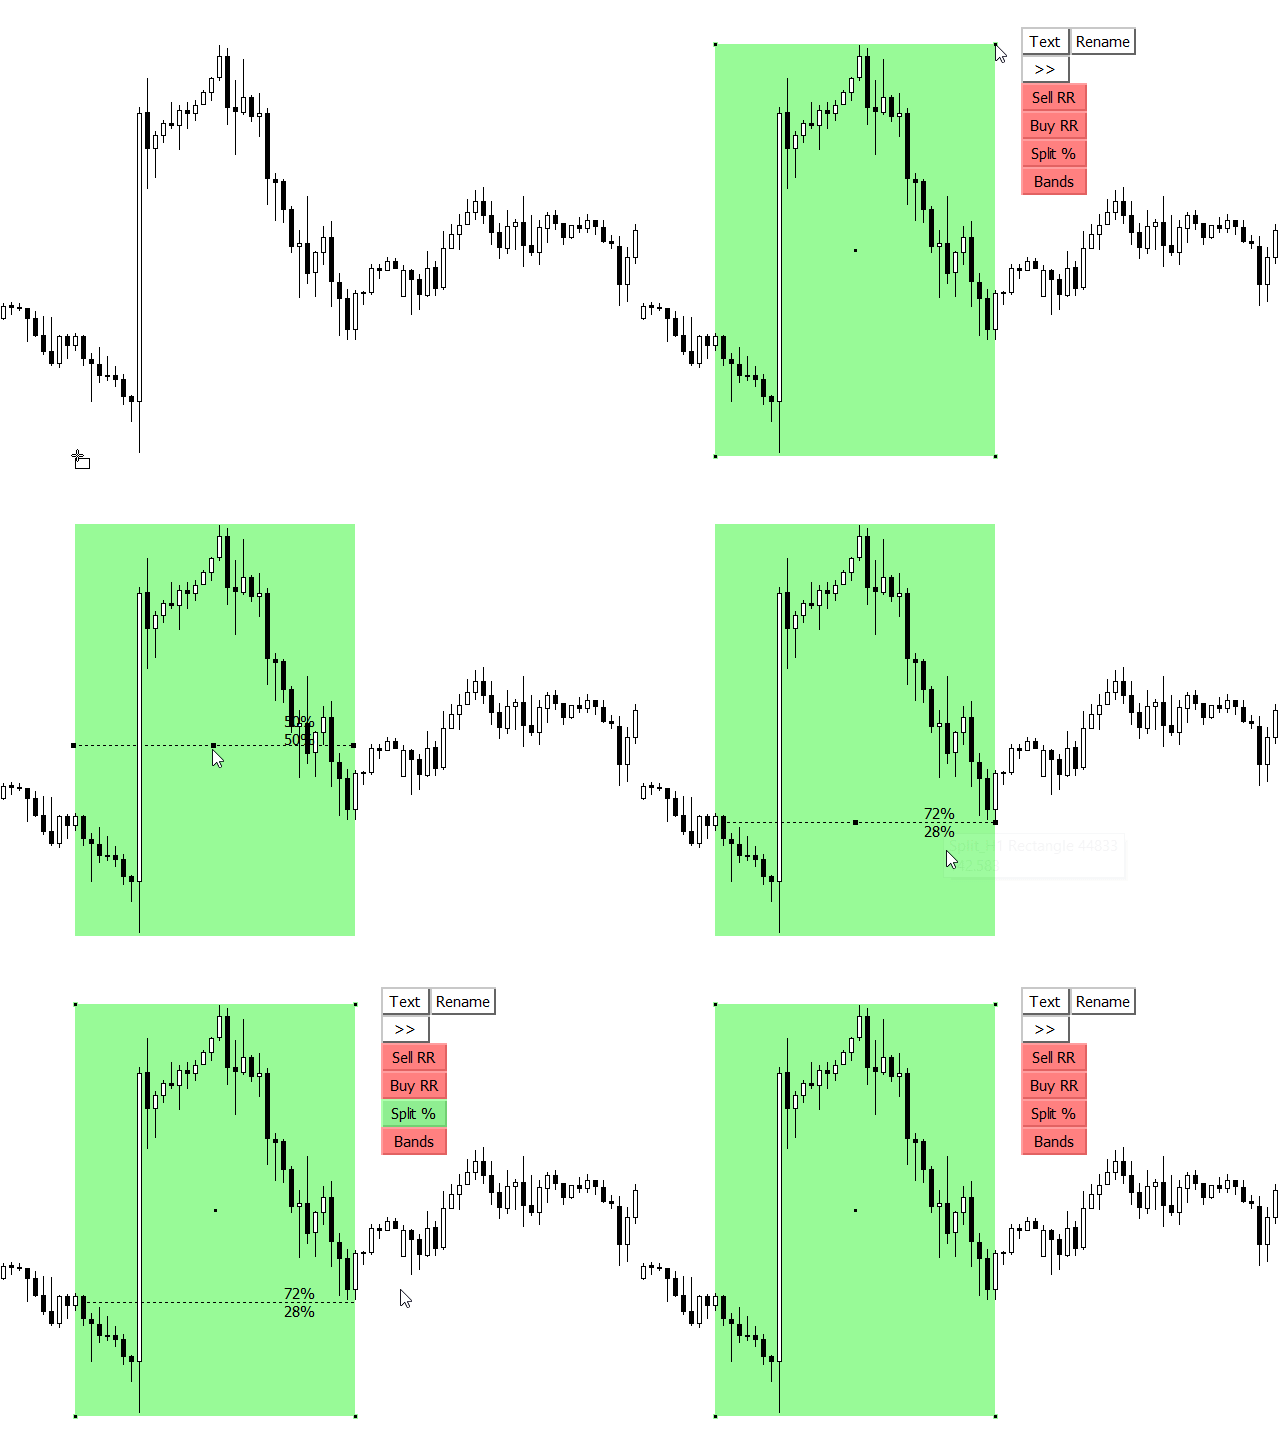
    11. Rectangle Split with % trendline

    Rectangle will be split with extended trendline by 50% of rectangle height. When you move split trendline, then % (percentage) will recalculate

    12. Rectangle Fibonacci retracement tool

    Non-extended rectangle have option to split by % and give option to see discount or premium price of the rectangle

    13. Trendline compression tool and Flat trendline button

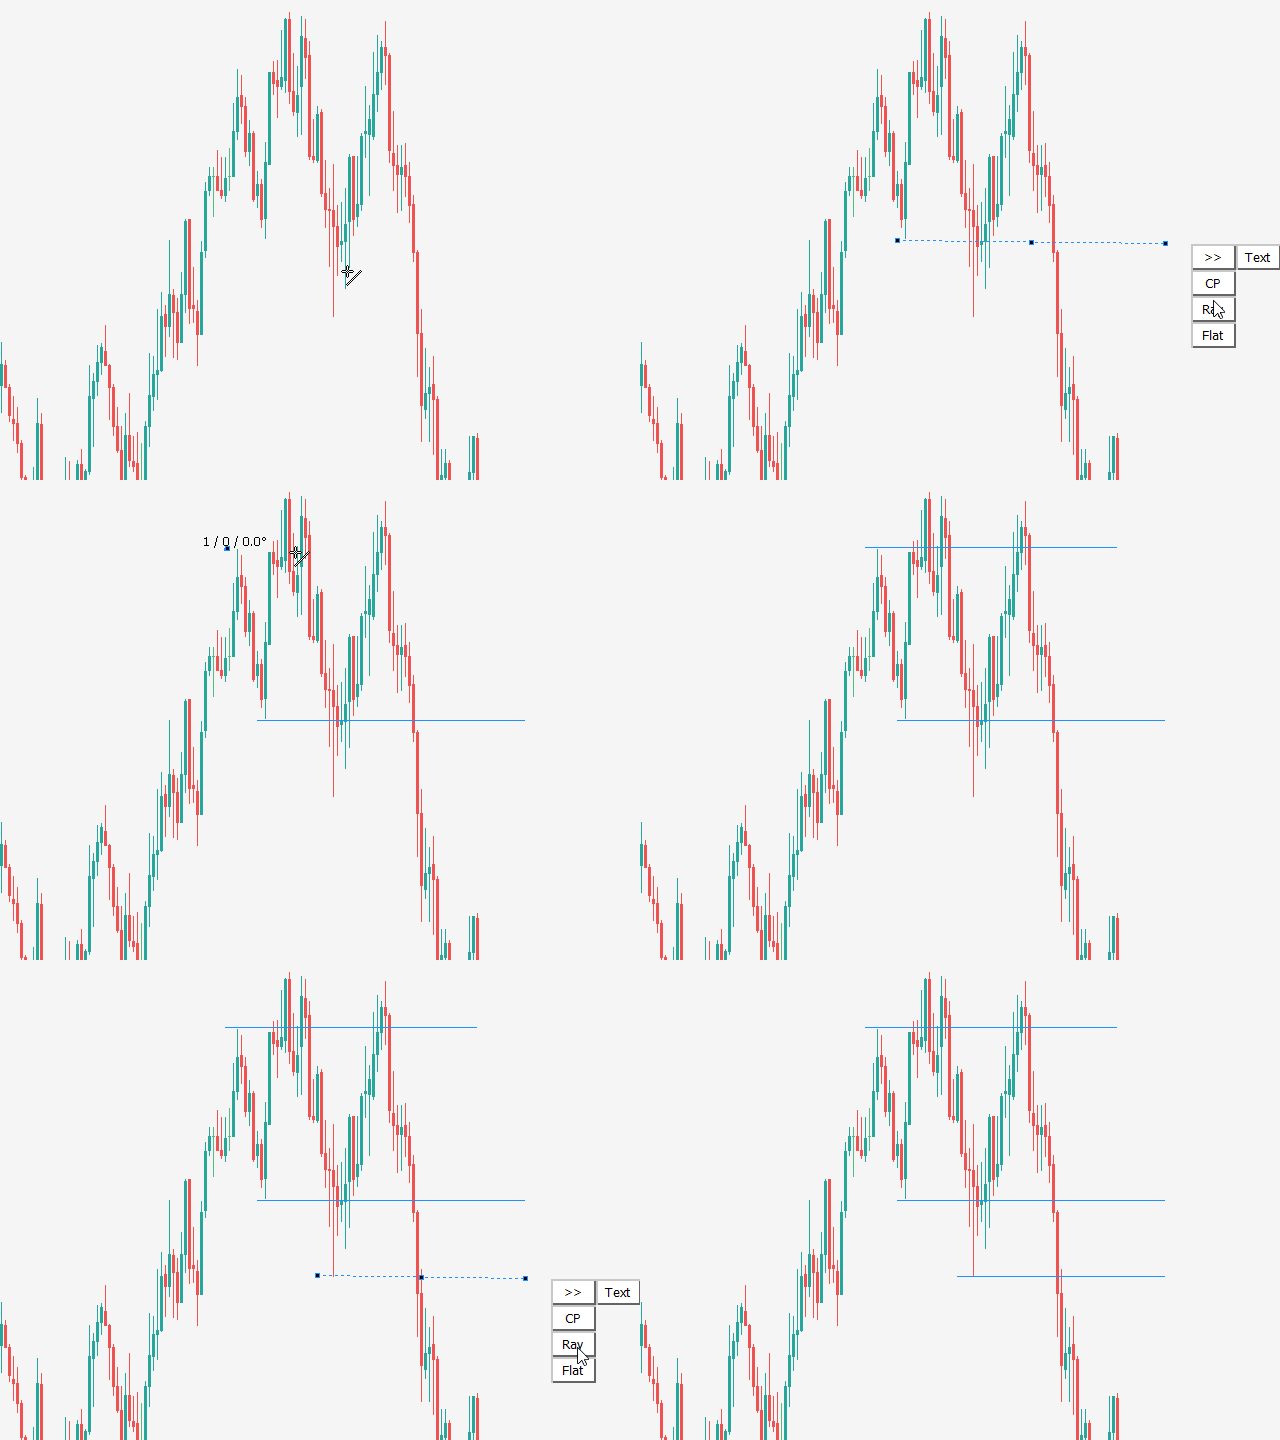
    Mark compression zone on the chart, like price action zone. If you click on Flat button then trendline will become horizontal flat

    14. Chart synchronization - chart sync object

    "SYNC" button function for rectangle, trendline, horizontal line, vertical line and Fibonacci retracement of the same symbol

    15. Multiple timeframes analysis with nested zones  

    Bands button will create top and bottom rectangle lines visible on all TF but filled rectangle will be visible only on current TF. This will help you to see HTF levels on lower timeframes

    16. Auto scale TF visibility for newly created rectangle & trendline 

    This function will set timeframe visibility for current and lower timeframes. This will give bigger importance to objects on higher timeframes

    17. Object timeframe visibility buttons

    Set object timeframe visibility with LTF, MTF and HTF buttons

    18. Navigate chart to Rectangle origin position focus

    Function that will show origin of selected rectangle in the middle of the chart when button @ is clicked

    19. Horizontal break line price

    Function will search first horizontal line break in chart history on the left

    20. Hist. button

    History button that will show the time of last alert in the label. Information is transferred to Technical analysis dashboard where you can see last alerts of all charts in one list

    21. Rename the rectangle and trendline from the suggested list

    Button Rename gives options to rename the rectangles and trendlines from the suggested list

    22. Time Frame colors for new created objects

    User can define special color for each standard time frame

    23. Candle click to create SD zone

    Button Click SD with ON//OFF logic for extended rectangle creation when user click on candle. Zone is based on candle High and Low price

    24. Fair Value Gaps (ICT FVG indicator)

    Button Click FVG with ON//OFF logic for extended rectangle creation when user click on Fair Value Gap zone candle

    25. Button to show ALL Fair Value Gaps

    Show all fair value gaps on chart with Show FVG button

    Input settings:

    • Show FVG - Search bars in history (0 = default)
    • Show FVG rectangle color - Untouched/Untested
    • Show FVG rectangle color - Touched/Tested

    26. Hotkeys for drawing Support Resistance levels and Supply Demand zones

    Last clicked candle Hotkeys for Support and Resistance levels (extended trendline):

    • H - High
    • L - Low
    • O - Open
    • C - Close

    Last clicked candle Hotkeys for Supply and Demand zones (extended rectangle):

    • S - Supply zone
    • D - Demand zone
    • F - Fair Value Gap
    X - Show/hide TBTA buttons
    W - Show FVG
    Q - Chart Scale
    1 - Line thickness
    2 - Line thickness
    3 - LTF
    4 - MTF
    5 - HTF
    A - @ (Move chart to selected object Time1)
    E - Extend/unextend selected trendline or rectangle


    评论 39
    Kris
    60
    Kris 2024.11.11 22:51 
     

    Best thing since slice bread! I never really liked the idea of using both Trading View and MT4 to trade. Thanks to this indicator I can finally ditch Trading View. Huge thanks!

    ionut_34
    169
    ionut_34 2023.12.01 20:55 
     

    since i have this tool i don't use tradingview anymore, it has everything you need.

    riad mansee
    25
    riad mansee 2023.10.16 22:58 
     

    I purchased this product and when I changed the platform it no longer worked why ?

    推荐产品
    Demark mtf
    Sergey Fionin
    該指標顯示德馬克模式並以箭頭和警報的形式給出交易信號。 在報價歷史上顯示 De Mark 行。 具有多幀。可以在較低的時間範圍內顯示較高時間範圍的 DeMark 模式。 具有顯示分形的可切換功能。 交易信號伴隨著聲音警報,並將它們發送到郵件和移動設備。 /////////////////////////////////////////////////////////////////////////////////////////////////////////// /////////////////////////////////////////////////////////////////////////////////////////////////////////// /////////////////////////////////////////////////////////////////////////////////////////////////////////////
    WhaleFinder MT4
    Kazuya Yamaoka
    Considering the main theories of Forex (Dow Theory, support lines, chart patterns, and Fibonacci retracements), It tells you the price range where whales (large investors) are likely to appear. You can trade at the price points that professionals also aim for. You no longer have to warry about where to aim next. We are live-streaming the actual operation of the system. Please check for yourself if it is usable. Please check it out for yourself. https://www.youtube.com/@ganesha_forex We do no
    The Find Levels utility scans the range of prices and bars indicated by you on the chart, finds the levels most often related to High and Low prices and provides a full report. The color of the level line depends on the number of touches and changes in the program settings. The level is drawn in the event that if the shadow of the High or Low candle was at least two touches during the period specified in the parameters. The characteristics of the candle, namely, what should be its parameters for
    Description  Fibo Retracement  is an indicator that automatically plots  Fibonacci  levels in the main chart based on Close prices , which distinguishes it from the Fibo Levels indicator that plots levels based on High/Low prices. Thus, using both indicators provides the trader with the opportunity of determining support and resistance zones by Fibonacci! The levels are calculated and plotted over a certain interval using the number of bars specified by the user. The user can display Fibonacci l
    Fibo Linear Channel
    Igor Semyonov
    4 (1)
    Colored indicator of the linear channel based on the Fibonacci sequence. It is used for making trading decisions and analyzing market sentiment. The channel boundaries represent strong support/resistance levels, as they are the Fibonacci proportion levels. Users can select the number of displayed lines of channel boundaries on the chart by means of the input parameters. Attaching multiple instances of the indicator to the chart with different calculation periods leads to displaying a system of c
    About: A Fibonacci indicator is best used with other indicators like Pivots, Support/Resistance etc. Price tends to use Fibo levels as Support or Resistance lines. So, this indicator is very useful to know when price might reverse or if a level is crossed, price might continue the trend. Also, to find the best Take Profit and StopLoss lines. Don't use Fibo Indicator alone for trading as it might not always be accurate. Use it to make your strategies better as a supporting indicator. Settings:
    FREE
    Pisces TheProfitZone
    Nuttawut Khiawkiri
    Pisces TheProfitZone "Pisces TheProfitZone MT4 Indicator Powered byFxGangster" This indicator will calculate new support and resistant zone everyday, and that give us a trading zone such as thats telling us TP and SL, So it still telling us for where should the price will go reach? Fore Example. Uptrend : If Price can stay upper a Line and price close higher above a Line, then the price will continue go up to reach next Line. Downtrend : If Price can't pass to stay upper a Line and the pr
    Moving pivot Average Fibonacci The  indicator compares the selected period with its counterpart from the previous period. The indicator determines the moving Fibonacci levels for the day or any time interval to assess the price movement range from the time average. The indicator helps predict the expected high or low for the day based on historical time data. The pivot line can be considered an average trend line and use it in a variety of trading strategies. If you have any question about t
    Golden Range 2
    Damian Mateusz Wojtowicz
    Golden Range 2 is one of the top entry indicators securing its future with its results.  Indicator settings: Points = how precise pattern detection is AlertConfirmation = turn on(true) off(false) alert CalculatedBars = how many bars will be calculated Please leave Positive comments, reviews. Buffer 0 Buy Arrow, Buffer 1 Sell Arrow, Buffer2 Buy Signal(Value:1/0), Buffer3 Sell Signal(Value:1/0)  Buy Green, Sell Red
    The indicator draws trend lines based on Thomas Demark algorithm. It draws lines from different timeframes on one chart. The timeframes can be higher than or equal to the timeframe of the chart, on which the indicator is used. The indicator considers breakthrough qualifiers (if the conditions are met, an additional symbol appears in the place of the breakthrough) and draws approximate targets (target line above/below the current prices) according to Demark algorithm. Recommended timeframes for t
    标题:BBMA 结构指南 - BBMA 结构指南 描述: BBMA 结构指南是一款专业的 MQL4 指标,旨在帮助交易者更轻松、更高效地理解 BBMA 结构的演变。BBMA,即“布林带移动平均”,以“领先一步”的口号而闻名,强调了深入理解市场结构的重要性。 通过 BBMA 结构指南,您可以快速识别驱动价格波动的基本市场结构模式。这将帮助您做出更准确、更有效的交易决策。该指标清晰直观地呈现信息,使您能够更自信地迈出交易中的下一步。 主要特点: - **深入理解:** BBMA 结构指南提供清晰的市场结构视图,让您更好地理解市场动态。 - **易于使用:** 设计有直观界面,所有经验水平的交易者都能轻松使用该指标。 - **强有力的信号:** 该指标提供 BBMA 系统中的重要信号,如**CSAK**(蜡烛强劲方向)和 **MHV**(市场失去交易量)。 **CSAK** 信号指示存在方向强劲的蜡烛,而 **MHV** 信号指示市场正在失去交易量。 交易设置: BBMA 结构指南还介绍了两个重要的交易设置,即**MHV 设置**(市场失去交易量)和 **再次进入**。MH
    F ully automated Expert Advisor using the  advanced   algorithm for trading the EURUSD Designed for profit in a short period of time and big profit in a long run. Prefers EURUSD 1H. Principle of operation The SELL and BUY orders are opened (depending on the parameters set), guided by signals and the market situation.     Recommended parameter: Use an ECN broker account. minimum deposit of 100$ USD. use it in H1 time frame recommended symbol is EURUSD input parameter: TrendType               
    Chart Projection
    Lorentzos Roussos
    4.64 (44)
    图表投影指标 加入频道 ,撰写评论,在 YouTube 上订阅 ,为视频点赞。谢谢 图表投影最初是一个小指标,它使用内置的之字形技术指标来预测未来的价格走势(您可以在评论中找到旧算法) 这个想法很简单,过去的价格行为不会转化为未来,但也许如果我们没有过于具体,或者过于笼统,我们可以提取关于可能发生的事情的指导方针。 图表投影的“论文”是这样的: 交易者会查看图表来做出决定,因此,算法也可以查看图表。不读指标值,不读价格,但看图表 寻找某物就是找到一个重复的熟悉模式,并且,为了找到那个熟悉的模式,您需要存储它。 Zig zag 是不够的,需要一种新的算法来做到这一点,并保留有关图表视觉方面的数据,因此需要光学算法。 Chart Projection 配备了 3 种光学算法,用于对价格行为进行低、中和高范围扫描。每个光学器件都会收集与兴趣点图表​​直接相关的历史数据。 兴趣点是高点或低点,但这不是我们的分析应该停止的地方。每一个高点和低点都有一个领先的势头和一个结果,以及它在整体趋势中的位置。光学算法将其与引导和引导至感兴趣点的时间一起收集。随着价格的发展,来自每个光
    FREE
    The Nihilist 5.0 Indicator includes Forexalien and Nihilist Easy Trend trading strategies and systems. It is composed of an MTF Dashboard where you can analyze the different input possibilities of each strategy at a glance. It has an alert system with different types of configurable filters. You can also configure which TF you want to be notified on your Metatrader 4 platform and Mobile application The indicator has the option to view how could be a TP and SL by using ATR or fixed points, even
    Hello Guys! I want to share with you a very useful tools. Anyone of us who has used MT4 for some time knows how impractical this platform can be for discretionary trading. That's why I created this graphical interface!  Interface is very simple, all the info that you need are in the video and in the screenshot. NB: Before to run the EA Interface, remember to copy the file in the comment in your MT4 folder "Controls". PATH: .../MQL4/INCLUDE/CONTROLS NB: unfortunately the interface can't be t
    CMI - Profit from trending and ranging markets. The CMI indicator is a two-part system used to trigger both trend and counter-trend trades, that has been introduced by Daniel Fernandez in an article published in Currency Trading Magazine (August 2011 issue). It is a simple, yet effective indicator, which gauges whether the market has behaved in a choppy (non-directional) manner or trending (directional) manner. CMI calculates the difference between the most recent bar's close and the close n bar
    Bermaui Channel
    Muhammad Elbermawi
    5 (19)
    这是一个价格通道,在图表上显示五个重要的价格水平。这些级别是: 1. 前 x 根柱线的最高价 (HH)。 2. 前 x 根柱线的最高低点 (HL)。 3. 中线。 4. 前 x 根柱线的最低最高价 (LH)。 5. 前 x 根柱线的最低价 (LL)。 如何Bermaui通道捕获 超买 区域 将 HH 和 HL 水平之间的距离视为超买区域。 当价格蜡烛或柱线穿过 HL 向上时,这表明价格正在进入其超买区域。 当价格蜡烛或柱线穿过 HL 向下时,这表明价格正在超出其超买区域。 当价格蜡烛穿过 HH 时,它会创造一个新的高点。这可能表明一个新的上升趋势的开始,该趋势将继续进行,直到价格再次反转下跌方向。 Bermaui Channels 如何捕捉 超卖 区域 将 LL 和 LH 之间的距离视为超卖区域。 当价格蜡烛或柱线穿过 LH 向下时,这表明价格正在进入超卖区域。 当价格蜡烛或柱线穿过 LH 向上时,这表明价格正在超出其超卖区域。 当价格蜡烛穿过 LL 时,它会创造一个新的低点。这可能表明新的下跌趋势的开始,该趋势将继续进行,直到价格反转其方向再次回到上行。
    Moving Pivot Average    The pivot indicator compares the selected period with its counterpart from the previous period. The indicator uses very flexible algorithm for pivot value calculating. It allows you to allocate in days a certain time intervals (custom bars) and calculate the average pivot value based on High, Low and Close prices of these bars. How many custom bars will be taken into account is determined by the "Days" setting. The pivot line can be considered an average trend line and us
    Breakout Sniper
    Elmira Memish
    5 (3)
    Breakout Sniper draw trendlines by using improved fractals and plots the breakout and reversal points. NO REPAINT AUTOMATED TRENDLINES MULTI TIMEFRAME *** SINCE THE STRATEGY TESTER OF MT4 PALTFORM DOES NOR SUPPORT, YOU NEED TO TEST "CURRENT TIMEFRAME" INPUTS ONLY.***       A trendline is   a line drawn over pivot highs or under pivot lows to show the prevailing direction of price . Trend lines are a visual representation of support and resistance in any time frame. They show direction and sp
    The PUA MultiType Pivot indicator is built on the daily chart of the previous day. The PUA MultiType Pivot indicator is one of the most popular tools in technical analysis, used by traders to identify potential reversal points in financial markets. This indicator constructs three types of Pivot points: Classic, Fibonacci, and Camarilla, each offering its unique approach to market analysis. The advantages of this indicator include: Simplicity and Clarity PUA MultiType Pivot provides clearly defi
    Flat finder MT4
    Yuriy Lyachshenko
    该指标检测平仓,并在发现的区域画上一个彩色的矩形。 该指标的主要思想是,当价格填满图表上的某个区域时,检测出一个平盘。 输入参数: Color rectangle - 要着色的矩形的颜色。 Bars in rectangle - 矩形中允许的最小条数。 Density in % - 扁平的密度,设置为矩形区域的百分比。 __________________________________________________________________ __________________________________________________________________ ________________________
    Success comes from knowledge – this is true for most things in life and especially Forex trading. To become successful, a trader needs to learn technical analysis. Technical indicators are a big part of technical analysis. The problem is that, at first sight, names of technical indicators can sound unpleasantly complicated, for example, MACD, RSI or Stochastic. However, we recommend you not to judge a book by its cover. We will provide you with a fair and simple explanation of the most popular t
    Master Phi
    Chantal Sala
    Master Phi is an indicator based on Fibonacci numbers. It analyzes the percentage values returning the proportion of the Golden Section. You can customize values and set custom levels so you will create your personal Trading. The attention on the minimums and the maximums of timeframes allows accurate analysis in order to intercept very precisely the trading levels after the various impulse movements. Input Values Time_Frame to analyze LEVELS SETTINGS 9 levels (in percentage) 9 colors LINE SET
    FIBO Price Calculator 功能简介 1. 自动绘制斐波那契回调线 本指标可自动在MT4图表上绘制斐波那契回调线,助您快速识别潜在支撑和阻力位。 2. 自定义斐波那契数列 用户可自定义斐波那契数列的数值,指标会根据当前市场价格自动换算成相应价格水平。 3. 灵活调整指标窗位置 指标窗可放置在图表的四个角中的任意位置,方便用户根据个人喜好和交易习惯调整布局。 综上所述,本指标不仅能够帮助交易者自动绘制斐波那契回调线,还提供了自定义输入斐波那契黄金数列换算成价格以及自定义指标窗位置的功能,为交易者提供了更便捷、更灵活的技术分析工具。无论是初学者还是经验丰富的交易者,都能够通过本指标更好地把握市场趋势,提高交易成功率。
    RSI Global
    Igor Semyonov
    Description A universal indicator RSI together with moving averages based on it. Depending on the need, moving averages can be disabled. You can color the indicator lines and levels: lines of RSI, moving average lines and thresholds of overbought and oversold levels.   The indicator can be calculated as the standard one on the basis of a price or as a derivative on the basis of the following eighteen other indicators included in the standard package of the MT4 terminal: AD - an indicator of accu
    Cycle Sniper
    Elmira Memish
    4.39 (36)
    NEW YEAR SALE PRICE FOR LIMITED TIME!!! Please contact us after your purchase and we will send you the complimentary indicators to complete the system Cycle Sniper is not a holy grail but when you use it in a system which is explained in the videos, you will feel the difference. If you are not willing to focus on the charts designed with Cycle Sniper and other free tools we provide, we recommend not buying this indicator. We recommend watching the videos about the indiactor and system before pu
    为您介绍MQL4的Donchian通道指标,这是一个强大的技术分析工具,旨在提升您的交易成功率。该指标由四条线组成,代表了在指定时期内价格运动的上限和下限。 通过Donchian通道指标,您可以轻松识别市场潜在的突破和反转。上线显示指定时期内的最高点,而下线代表最低点。这两条线之间的空间形成一个通道,为您提供了有关资产交易价格范围的有价值见解。 但这还不是全部 - 我们进一步改进了这个令人难以置信的指标。我们的修改允许您按照一定百分比(表示为'shadowTop'和'shadowBottom')减小通道宽度。通过缩小通道,您可以更敏锐地感知价格波动,并准确定位入场和出场点。 无论您是经验丰富的交易者还是初学者,带有减小通道宽度的Donchian通道指标都是您交易工具箱中必备的工具。它能够让您基于市场波动和价格行为做出明智的决策。 不要错过将您的交易推向新高度的机会。体验带有减小通道宽度的Donchian通道指标的强大功能,释放您的交易潜力吧。
    RatioLotajeJAHG
    Jhon Alexander Herrera Gomez
    Asesor experto desarrollado para MT4   con el objetivo de ingresar ratios de utilidad y %   de riesgo, adicional los Pips de SL para el cálculo del lotaje para dicho riesgo. Estos se calculan sobre el balance actual. El usuario tomaría como dato ingresar el lotaje que se calculó y arrastrar el SL manualmente a la cantidad de Pips que ingreso (15,20,25 Pips) el cual daría como perdida en $ el % de riesgo ingresado y arrastar el TP a la cantidad de pips indicado como TP.    A la vez que se va in
    FREE
    Trading Signal: AutoMM1000:  Soon      AutoMM2000:  Soon      AutoMM3000:  Soon The Omnia Intelligence System (OIS) is a powerful trading EA designed to detect patterns and identify key support and resistance levels in the market. Combining technical indicators with semi-AI, OIS automates trading decisions based on in-depth market analysis. It employs a controlled Martingale strategy to handle high market volatility while maintaining effective risk management . Key Features Pattern
    PowerXXX
    Marco Fornero Monia
    PowerXXX measures the power of the current candlestick and displays it in numerical format and colors. The indicator can cover multiple timeframes and can be placed on the main chart or on the charts of the underlying indicators. The number of timeframes is selectable, as well as the color levels according to the power expressed. In the latest version, the power can be expressed as a function of the opening of the candle itself or as a function of the opening of the total candles before. There
    该产品的买家也购买
    Trade Assistant MT4
    Evgeniy Kravchenko
    4.44 (179)
    它有助于计算每笔交易的风险,容易安装新的订单,具有部分关闭功能的订单管理, 7 种类型的追踪止损和其他有用的功能。 注意,该应用程序在策略测试器中不起作用。 Manual, Description, Download demo 线条功能  - 在图表上显示开仓线、止损线、止盈线。 有了这个功能,就可以很容易地设置一个新的订单,并在开仓前看到它的附加特性。   风险管理  - 风险计算功能在考虑到设定的风险和止损单的大小的情况下,计算新订单的成交量。它允许你设置任何大小的止损,同时观察设定的风险。 批量计算按钮 - 启用 / 禁用风险计算。 在 " 风险 " 一栏中设置必要的风险值,从 0 到 100 的百分比或存款的货币。 在 " 设置 " 选项卡上选择风险计算的变量: $ 货币, % 余额, % 资产, % 自由保证金, % 自定义, %AB 前一天, %AB 前一周, %AB 前一个月。   R/TP 和 R/SL - 设置止盈和止损的关系。 这允许你设置相对于损失的利润大小。 例如, 1 : 1 - 这决定了 TP = SL 的大小。 2 : 1 - 这意味着 TP 是
    欢迎来到 Trade Manager EA——这是一个终极风险管理工具,旨在使交易变得更直观、精准和高效。它不仅仅是一个下单工具,而是一个用于无缝交易计划、仓位管理和风险控制的全面解决方案。不论您是新手交易员、资深交易员,还是需要快速执行的剥头皮交易员,Trade Manager EA 都可以满足您的需求,适用于外汇、指数、大宗商品、加密货币等各种市场。 借助 Trade Manager EA,复杂的计算已成过去。只需分析市场,在图表上用水平线标记入场、止损和止盈,设置您的风险水平,Trade Manager 就会立即计算出理想的头寸规模,并实时显示以点、账户货币计价的止损和止盈。每笔交易都得以轻松管理。 主要功能: 头寸规模计算器 :根据定义的风险瞬间确定交易规模。 简单的交易计划 :在图表上用可拖动的水平线直接计划交易,设置入场、止损和止盈。 实时显示 SL 和 TP :以账户货币、点或分显示止损和止盈,便于分析。 高级保护工具 盈亏平衡选项 : 基本盈亏平衡 :当您的交易达到设定水平时自动保护利润。 多级盈亏平衡 :设置多达 4 个级别以逐步保护利润。 尾随止损选项 : 基本尾随
    The product will copy all telegram signal to MT4   ( which you are member  ) , also it can work as remote copier.  Easy to set up, copy order instant, can work with almost signal formats, image signal, s upport to translate other language to English Work with all type of channel or group, even channel have "Restrict Saving Content", work with  multi channel, multi MT5 Work as remote copier: with signal have ticket number, it will copy exactly via ticket number. Support to backtest signal. How to
    Custom Alerts 是一款多功能的多市场监控工具,可识别所有八种主要货币(美元、加元、英镑、欧元、瑞士法郎、日元、澳元和新西兰元)、黄金 (XAU)、基于这些货币的所有 28 种外汇和黄金货币对以及 US30、UK100、WTI、比特币等多达七种指数中的有前景的设置。该工具可完全自定义。该工具从我们的 FX Power、FX Volume 和 IX Power 指标中收集数据,并在发生重大事件时通知您。  开始使用前,您必须在终端上安装好使用过的指标,以便从多市场扫描仪提供的所有选项中获益。 有关功能和各种警报选项的更多详情,请参阅 ->   自定义警报常见问题                                                                                                        Custom Alerts 是一款多功能的多市场监控工具,可识别所有八种主要货币(美元、加元、英镑、欧元、瑞士法郎、日元、澳元和新西兰元)、黄金 (XAU)、基于这些货币的所有 28 种外汇和黄金货币对以及
    Telegram To MT4 Receiver
    Levi Dane Benjamin
    5 (3)
    将信号从您所属的任何渠道(包括私人和受限渠道)直接复制到您的 MT4。 该工具在设计时充分考虑了用户的需求,同时提供了管理和监控交易所需的许多功能。 该产品采用易于使用且具有视觉吸引力的图形界面。 自定义您的设置并在几分钟内开始使用该产品! 用户指南 + 演示  |     MT5版本  |     不和谐版本 如果您想尝试演示,请参阅用户指南。 Telegram To MT4 接收器在策略测试器中不起作用! Telegram 至 MT4 功能 一次复制多个通道的信号 从私人和受限频道复制信号 不需要机器人令牌或聊天 ID(如果出于某种原因需要,您仍然可以使用这些) 使用风险百分比或固定手数进行交易 排除特定符号 选择复制所有信号或自定义要复制的信号 配置单词和短语以识别所有信号(默认值应适用于 99% 的信号提供商) 配置时间和日期设置以仅在需要时复制信号 设置一次打开的最大交易量 交易和头寸管理 使用信号或自动设置的管理 通过设置每月、每周、每天、每小时或每分钟的最大交易次数,停止过度交易和报复性交易。 支持市价订单和挂单 每日最大利润目标(以美元为单位)以确保头寸并停止
    Telegram Signal pro
    Sara Sabaghi
    4.88 (8)
    What is it? Think about it, you can send all the orders/positions info to your telegram channel or group to create your community or VIP signals on telegram. Position info means this EA forward all of your new positions open details (Open price, Open time, Position Type, position Symbol and volume), positions changes ( SL or TP modifying or pending price changes) and position close (Close price, profit or loss, position duration time) and also EA Send NEWS alert (Economic calendar event) on y
    TakePropips TradePad Pro
    Eric John Pajarillaga Aldana
    5 (4)
    TakePropips TradePad Pro 包括一个强大的交易管理器、货币强度计、账户报告工具、风险管理工具等等! 它是您将遇到的最先进的外汇交易经理和交易助手之一!对于想要更有效地管理贸易交易的交易者来说,它是完美的解决方案。 您可以在我们的博文中下载用户手册: User Manual 您可以在 Strategy Tester 上测试此交易系统(启用可视模式)。如果您喜欢在实时图表上进行测试,也可以给我发消息以获取 7 天试用版。 视频教程也可在说明下方获得更多详细信息。 如果您有任何疑问或需要帮助,请随时与我联系,我很乐意提供帮助。 TradePad Pro 适用于所有外汇对、金属、商品、指数和加密货币。 主要特点 订单管理 - 公开市场或挂单,轻松调整止盈、止损和手数大小。 获利计算 - 手动点数、ATR 乘数和风险回报率。 止损计算- 手动点,   ATR 乘数和供应/需求。 批量计算 - 手动点,   每笔交易的风险百分比和风险金额。 账户保护 - 回撤保护允许您设置账户回撤的最大限额以避免进一步损失。利润保护为您的账户设置最大利润限额以避免过度交易。 编辑订
    TradePanel MT4
    Alfiya Fazylova
    4.9 (86)
    交易面板是一个多功能的交易助手。 该应用程序包含 50 多个手动交易功能,并允许您自动执行大多数交易操作。 购买之前,您可以在模拟帐户上测试演示版本。 演示 此处 。 完整说明 此处 。 贸易。 让您一键执行基本交易操作: 开立挂单和开仓。 打开订单网格。 平仓挂单和持仓。 仓位反转(平仓买入并开仓卖出,或平仓卖出并开仓买入)。 锁定仓位(通过开立相反仓位使卖出和买入仓位的交易量相等)。 对所有仓位进行部分平仓。 将所有头寸的止盈和/或止损设置为同一水平。 将所有仓位的止损设置为盈亏平衡水平。 开仓订单和仓位时,您可以: 根据既定风险自动计算订单量。 一键打开多个订单。 将计算出的交易量分配给多个订单。 使用面板创建的线条和标记在图表上可视化未来订单的交易水平位置。 开仓时,设置最大点差限制。 使用止盈规模与止损规模的自动比率。 使用虚拟止损和止盈。 将当前点差添加到止损和止盈。 使用 ATR 指标计算止盈和止损。 设置待处理订单的到期日期。 使用挂单跟踪(挂单自动移动到价格后面指定的距离)。 平仓订单和平仓时,您可以: 一键按订单或仓位类型关闭。 只需点击一下,即可仅平仓盈利或无利可
    Riskless Pyramid
    Snapdragon Systems Ltd
    5 (1)
    Introduction This powerful MT4 trade mangement EA offers a way potentially to aggressively multiply trade profits in a riskfree manner. Once a trade has been entered with a defined stoploss and take profit target then the EA will add three pyramid add-on trades in order to increase the overall level of profit. The user sets the total combined profit target to be gained if everything works out. This can be specified either as a multiple of the original trade profit or as a total dollar amount. Fo
    The product will copy all  Discord  signal   to MT4   ( which you are member  ) , also it can work as remote copier.  Easy to set up. Work with almost signal formats, support to translate other language to English Work with multi channel, multi MT4. Work with Image signal. Copy order instant, auto detect symbol. Work as remote copier: with signal have ticket number, it will copy exactly via ticket number. How to setup and guide: Let read all details about setup and download Discord To MetaTrade
    Mentfx Mmanage
    Anton Jere Calmes
    5 (15)
    The added video will show you the full functionality, effectiveness, and simplicity of this trade manager. Drag and Drop Trade Manager. Draw your entry and have the tool calculate the rest. Advanced targeting and close portions of a trade directly available in tool (manage trades while you sleep). Market order or limit order on either side with factored spread. Just draw the entry, the tool does the rest. Hotkey setup to make it simple. Draw where you want to enter, and the stop loss, the tool c
    RedFox Copier Pro
    Rui Manh Tien
    4.73 (11)
    Time saving and fast execution Whether you’re traveling or sleeping, always know that Telegram To Mt4 performs the trades for you. In other words, Our   Telegram MT4 Signal Trader  will analyze the trading signals you receive on your selected Telegram channels and execute them to your Telegram to MT4 account. Reduce The Risk Telegram To Mt4   defines the whole experience of copying signals from   Telegram signal copier to mt4 platforms. Users not only can follow all instructions from the sign
    The Expert Advisor will help you forward all pop-up alert with screenshot from  MetaTrader 4 to Telegram channel/ group, also forward all notifications to Telegram. Parameters  -  Telegram Bot Token - create bot on Telegram and get token.  -  Telegram Chat ID  - input your Telegram user ID,  group / channel ID  -  Forward Alert - default true, to forward alert.  -  Send message as caption of Screenshot - default false, set true to send message below Screenshot  How to setup and guide  - Telegram
    News Trapper EA
    Noha Mohamed Fathy Younes Badr
    5 (9)
    Hi, all.  News trapper EA It is an expert for trading news very safe expert  Automated Trading on the news of the economic calendar. It shows stable trading during last 10  years. EA doesn't use dangerous technologies like martingale, grid. The Expert is very simple to use.      sale will end after 48 h how to install it     and set files     read the blog         after purchase contact me to add you to   VIP   channel  The program contains flexible settings for trading on the news of the econ
    Ultimate Trailing Stop EA
    BLAKE STEVEN RODGER
    4.33 (15)
    This EA Utility allows you to manage (with advanced filtering) unlimited open orders (manual or EA) with 16 trailing stop methods: fixed, percent, ATR Exit, Chandelier Exit, Moving Average, Candle High Low Exit, Bollinger Bands, Parabolic, Envelope, Fractal, Ichimoku Kijun-Sen, Alligator, Exit After X Minutes or Bars, RSI and Stochastic. The trailing stop can be either real or virtual, and you can exit fully or with a partial close percent on touch or bar close.  Moreover, you can add (overr
    Strategy Builder offers an incredible amount of functionality. It combines a trade panel with configurable automation (covert indicators into an EA), real-time statistics (profit & draw down) plus automatic optimization of SL, TP/exit, trading hours, indicator inputs. Multiple indicators can be combined into an single alert/trade signal and can include custom indicators, even if just have ex4 file or purchased from Market. The system is easily configured via a CONFIG button and associated pop-up
    TPSpro Trade PRO
    Roman Podpora
    5 (4)
    下载演示版本 说明 -   https://www.mql5.com/ru/blogs/post/758419 处于测试模式     (在测试器中)面板功能   未激活 。我们仅提供了面板本身的视觉显示。 一款能够根据给定的止损水平即时计算头寸规模或风险的工具对于专业交易员和新手交易员来说都至关重要。TRADE PRO 交易实用程序提供快速准确的计算,帮助您在时间敏感且波动的市场中做出决策。 主要功能: 原创。简单。有效。 原始、方便地打开主交易面板:将鼠标移到图表右侧,然后单击适当的方向即可下达未来订单。 快速安装市价单 使用 TRADE PRO 设置您的余额或资本的风险百分比,或指定具体的风险金额。在图表上直观地定义止损水平,让该工具自动计算每种货币对的最佳头寸规模。该工具还可以根据指定的风险/回报率自动设置利润目标(止盈)。 下达多个限价订单以分担总风险     (网格模式)。 无论您进行多笔买入或卖出交易还是遵循网格策略,交易面板都提供了下达多笔限价订单的功能,让您可以将主要风险分散到各个部分,并可进行调整。 在现有的市价单上添加额外的限价单。 为了您的方便,如果您已经有
    将信号从任何您是会员的渠道(无需机器人令牌或管理员权限)直接复制到您的 MT4。 它的设计以用户为中心,同时提供您需要的许多功能 该产品采用易于使用且具有视觉吸引力的图形界面。 自定义您的设置并在几分钟内开始使用该产品! 用户指南 + 演示  | MT5版本 | 电报版本 如果您想尝试演示,请参阅用户指南。 Discord To MT4 在策略测试器中不起作用。 Discord MT4 功能 从您是会员的任何频道复制。 无需机器人令牌或聊天 ID 使用风险百分比或固定手数进行交易 排除特定符号 选择复制所有信号或自定义要复制的信号 配置单词和短语以识别所有信号(默认值应适用于 99% 的信号提供商) 配置时间和日期设置以仅在需要时复制信号 设置一次打开的最大交易量 交易和头寸管理 使用信号或自动设置的管理 通过设置每月、每周、每天、每小时或每分钟的最大交易次数,停止过度交易和报复性交易。 支持市价订单和挂单 每日最大利润目标(以美元为单位)以确保头寸并停止过度交易 确保仓位的每日最大利润目标(%) 最大开放交易以限制风险和敞口。 使用 RR、点数或价格自动获取部分内容 使用固
    Comprehensive on chart trade panel with the unique ability to be controllable from mobile as well. Plus has a library of downloadable configuration, e.g. exit rules, extra panel buttons, pending order setup and more. Please see our product video. Works with all symbols not just currency pairs. Features On chart panel plus controllable from free app for Windows, iPhone and Android Built-in script engine with library of downloadable configuration, e.g. add 'Close All Trades in Profit' button, exit
    Equity Protection EA
    CARLOS ALBERTO VALLOGGIA
    5 (3)
    Equity Protection EA 一般特徵: 完全控制交易時段的結果。 控制所有外匯交易品種,指數,金屬,股票等的整體結果。對全球股票進行控制。 達到盈虧率時,關閉所有交易品種上的所有交易。- 數量和百分比均可更改的配置。 通過全局跟踪止損來保護結果- 本屆會議取得的成果記錄(更高的權益和更低的權益)。 登錄時,所有計算始終在資產負債表上執行,因此不會影響交易的平倉或平倉。 在Metatrader 4中,您可以用一定比例的賬戶損益來平倉單個交易。 觸發獲利或止損時自動關閉平台的選項。- 通知功能:觸發TP / SL級別時,將報告發送到電話(按通知)或電子郵件的選項。- 觸發TP / SL時可以選擇刪除掛單- 觸發TP / SL時可以選擇截屏並保存在文件中。- 更改字體大小的選項。- 選擇在“獲利百分比”和“止損百分比”中默認設置值 停用自动交易:达到全球止损或止盈水平时,股票保护将停用自动交易,以防止其他EA开立新交易。重要提示:对于Metaquotes市场的规则,“关闭自动交易”功能不可用,如果您需要使用该功能,请通过电子邮件与我联系:tradingxbots@gmail
    这是一款自动化辅助交易系统,包括风险限制、开仓、批量修改止损止盈、批量平仓,同时显示当日波动、开仓量、实时盈利,如果你希望控制自己的交易习惯,这就是适合你的交易系统。 风险管理: 最大开仓量设置 最大保证金占比设置 止损、止盈设置 面板包括三个区域: 区域 1: 当天波动百分比 实时点差 区域 2: 买入,卖出 批量修改止损止盈 区域 3: 批量平仓 显示买入、卖出数量 显示实时盈利 输入参数: lots_order_times:每次开仓的数量,即最小开仓量的倍数 max_margin_ratio:当前账户最大开仓金额的占比 max_open_lot_times:当前品种的最大开仓量 button_xsize:按钮宽度 button_ysize:按钮高度 button_xdistance:按钮距离屏幕左边界距离 button_fontsize:按钮文字大小 button_gapdistance:按钮之间的间隔 region_1_button_ydistance:区域1距离屏幕上边界的初始距离 region_2_button_ydistance:区域2距离屏幕上边界的初始距离 参数及使用
    On the occasion of the first days of publishing and attracting first customers, a 50% discount $120 for first 10 user (3 license left) Next price is $160 > $200 > $240 Don't forget to send a message after buying (not renting) to add you to our VIP group for free. Live OrderBoook, Another high-level tool by Ziwox Order Book An order book is an electronic list of buy and sell orders for a specific asset, organized by price level. It provides real-time data on market depth, showing the amount o
    BBMA Oma Ally Signals Scanner (BBMA Oma Ally Analyzer Dashboard EA) This is a multi-pair and multi scanner dashboard to find the key signal of BBMA Oma Ally Strategy BBMA consists of the use of 2 indicators: Moving Averages Bollinger Bands BBMA consists of many types of entries: Reentry Extreme Rejection EMA50 GAP (EMA50 to Upper/Lower BB) MHV Full Setup (CSE>TPW>MHV>Direction>Reentry) There are many multi timeframe signals based on this strategy. RRE (Reentry - Reentry - Extreme) REE (Reentry
    G Labs Trade Manager
    Garry James Goodchild
    Trade manager  Auto calculates % risk per trade  Manual lot size input  $ Risk amount  Displays profit to loss ratio  Shows value of stop loss and take profit in pips and dollars  Shows Balance equity and open profit and loss  On screen trade entry lines with entry stop loss and take profit . All with lots size , pip value dollar value and  price level of line  The value of these lines is also displayed in the panel  Buttons on panel for  Close Winners, Close all, Execute .  Trade panel has func
    Click and Go Trade Manager
    Victor Christiaanse
    5 (8)
    Click and Go Trade Manager, the ultimate solution for seamless trading execution. With a simple click on the chart, you can effortlessly define your stop loss, entry price, and target levels. No more hassle of inputting values manually - it's made incredibly intuitive and easy. Embedded risk management is a key feature of our Trade Manager. We understand the importance of protecting your investments, which is why the Click and Go Trade Manager incorporates risk management. When placing orders,
    Ultimate Trade Copier
    BLAKE STEVEN RODGER
    5 (1)
    This trade copy utility allows you to instantly and seamlessly replicate and synchronize unlimited orders from multiple master accounts to multiple slave accounts on your local machine. You can create custom channels (or portfolios) with advanced filtering capabilities to copy from multiple master accounts to multiple slave accounts. Moreover, you can tailor these channels with a range of lot sizing and trade condition options to ensure that copied trades outperform the original source. You can
    2024 50% discount ($199 -> $99) Advanced trading tool: One click smart orders that execute under your conditions Developed by trader for trading community:  position size calculator (lot size), open position after price action, strategy builder, set and forget trading, mobile notifications... Risk Management -  Risk percentage position size calculator, gain percentage, target risk reward ratio, spread and commissions are included in calculations 7 Advanced order types   - Set and forget tradi

    Trade Assistant Pro 36 in 1
    Makarii Gubaydullin
    4.95 (19)
    多功能工具:超过65个功能,其中包括:手数计算,价格行为,盈亏比,交易管理,供需区域。 演示版   |   用户手册   |  MT5版 该实用程序在策略测试器中不起作用:您可以在此处下载 演示版来测 试产品。 任何问题 / 改进意见 / 如果发生了故障或错误  都可以联系我 Trading functions require permitted auto trading (including on the broker's side) 简化,加快并且自动化你的交易过程。利用这款工具的控制功能就能增强普通交易端的执行力。 建立一笔新的交易:手数 / 风险 / 盈亏计算 1. 手数计算工具 (基于风险规模的交易量计算) 2. 风险计算工具 (基于手数大小的风险额计算) 3. 盈亏比 4. 订单的激活和触发,买入或卖出限价/买入或卖出止损:MT4也适用 5. 虚拟的止损/止盈 (隐藏的止损,止盈:交易商不可见) 6.  智能的止损/入场点:当价格柱在收盘时已超越了才入场 (避免无效触发) 7. 隐藏掉挂单 (虚拟的订单) 8. 预订挂单:在市场关闭的时候你也可以下挂单 (适
    Live Bot Maker
    Nabeel Zafar
    5 (4)
    Let Your Ideas Earn For You. Convert your Ideas and Strategies in to automated trading bots directly on MT4. Visual Strategy Builder with Instant Results on the chart. This One of a kind strategy builder, allows you to specify rules and visually see the signals based on those rule as you create them. Visit the link for Group, User Manual, Video Examples Why Use LBM LBM is an essential tool for traders of all levels. It allows traders to create strategies quickly and easily, and to test th
    FX28 Trader
    Tsvetan Tsvetanov
    5 (1)
    介绍FX28 Trader Dashboard – 您的终极交易管理工具 通过FX28 Trader Dashboard,解锁您交易体验的全部潜力,这是一款全面而直观的交易管理工具,旨在将您的外汇交易提升到新的水平。无论您是经验丰富的交易员还是刚刚开始您的金融之旅,这个强大的工具旨在简化您的交易活动并提高您的决策过程。 主要特点: 用户友好界面: FX28 Trader Dashboard拥有用户友好的界面,适应各个层次的交易员。通过几次点击轻松导航各种功能和工具,确保您只需轻松几下就完全掌控了交易。 实时市场数据: 利用实时市场数据源,始终保持领先地位,为您提供有关货币对、趋势和市场波动的最新信息。做出明智的决策,充满信心地执行交易。 高级交易分析: 通过高级分析深入了解您的交易绩效。跟踪交易历史,分析趋势,并识别模式,以优化您的策略和改善您的结果。 风险管理工具: 用我们强大的风险管理工具保护您的投资。轻松设置止损和获利订单,自定义仓位大小,并轻松实施风险收益比,确保自律和受控的交易方法。 多时间框架分析: FX28 Trader Dashboard允许您同时分析不同时间框架的市
    作者的更多信息
    -25% discount ($149 -> $111) Everything for chart Technical Analysis indicator mt5 in one tool Draw your supply demand zone with rectangle and support resistance with trendline and get alerts to mobile phone or email alert -  Risk reward indicator mt5 Video tutorials, manuals, DEMO download   here .   Find contacts on my   profile . 1.   Extended rectangles and trendlines Object will be extended to the right edge of the chart when price will draw new candles on chart. This is rectangle extend
    -25% discount ($199 -> $149) Advanced trading tool: One click smart orders that execute under your conditions Developed by trader for trading community:  position size calculator (lot size), open position after price action, strategy builder, set and forget trading, mobile notifications... Risk Management -  Risk percentage position size calculator, gain percentage, target risk reward ratio, spread and commissions are included in calculations 7 Advanced order types  - Set and forget trading w
    Place price Alerts   on  extended  Rectangles   and   Trendlines -  Risk reward indicator mt5 Extend Rectangles & Trendlines to the right edge Mark your supply demand zones with extended rectangle and draw support resistance lines with extended trendline. Find detailed manuals   here .  Find contacts on my   profile . MT4 Rectangle extender indicator will simplify and make it easier for you to analyze markets and stay notified about important events. When you extend rectangle or trendline the a
    Place price Alerts on extended  Rectangles and Trendlines -  Risk reward indicator mt4 Extend Rectangles & Trendlines to the right edge Mark your supply demand zones with extended rectangle and draw support resistance lines with extended trendline. Find detailed manuals   here . Find contacts on my   profile . MT4 Rectangle extender indicator will simplify and make it easier for you to analyze markets and stay notified about important events. When you extend rectangle or trendline the action bu
    2024 50% discount ($199 -> $99) Advanced trading tool: One click smart orders that execute under your conditions Developed by trader for trading community:  position size calculator (lot size), open position after price action, strategy builder, set and forget trading, mobile notifications... Risk Management -  Risk percentage position size calculator, gain percentage, target risk reward ratio, spread and commissions are included in calculations 7 Advanced order types   - Set and forget tradi
    Display rectangles and trendlines list  from Trading box  Technical analysis tool. Objects are ordered in the list by   pip distance   that is difference between object price and Bid price. With this tool you will know which chart to look for next trading opportunity. No more switching between charts and searching for trades where price is close to rectangle zone or trendline support resistance level. Sorted Rectangles and Trendlines by pip distance -  If you are trading on multiple charts, the
    FREE
    Rectangle position changer   tool is used for precise/accurate rectangle positioning by time or price only.   You can move each side of rectangle separately with lines created around selected rectangle. This tool will replace classical grid because it is like dynamical chart grid for rectangle grid. This tool allows you to adjust your rectangles, from all 4 sides, with ease and makes your technical analysis that much faster. This tool is handy when corner points for changing rectangle position a
    FREE
    Display Order box list from  Trading box  Order Management tool. Find contacts and manual links on my   profile . This dashboard gives you an edge in forex trading because in few seconds you can decide which pair and timeframe is worth to watch more closely. This is how you will not be distracted by all other forex pairs that you trade, and you will not miss great opportunities to trade the best price. Trading Dashboard  (order box overview panel and Trading box Order management extension) Tr
    FREE
    Display rectangles and trendlines list from  Trading box  Technical analysis tool. Objects are ordered in the list by pip distance that is difference between object price and Bid price. With this tool you will know which chart to look for next trading opportunity. No more switching between charts and searching for trades where price is close to rectangle zone or trendline support resistance level. Sorted Rectangles and Trendlines by pip distance -  If you are trading on multiple charts, then th
    FREE
    Rectangle position changer  tool ( rectangle indicator) is used for precise/accurate rectangle positioning by time or price only. You can move each side of rectangle separately with lines created around selected rectangle. This tool will replace classical grid because it is like dynamical chart grid for rectangle grid. This tool allows you to adjust your rectangles, from all 4 sides, with ease and makes your technical analysis that much faster. This tool is handy when corner points for changi
    FREE
    This tool will remove buttons and text labels from the chart, after you remove Trading box Order management or Trading box Technical analysis . You just need to drag this tool to your chart and after cleanup of objects is finished, the tool will remove itself from the chart. Please check images below that present Before and After using the Removal tool. There is also a short YouTube video at the bottom to show how easy it is to clean your chart after using Trading box tools. - input var
    FREE
    Display Order box list from  Trading box  Order Management tool. Find contacts and  manual   links on my   profile . This dashboard gives you an edge in forex trading because in few seconds you can decide which pair and timeframe is worth to watch more closely. This is how you will not be distracted by all other forex pairs that you trade, and you will not miss great opportunities to trade the best price. Trading Dashboard  (order box overview panel and Trading box Order management extension)
    FREE
    This tool will remove buttons and text labels from the chart, after you remove Trading box Order management or Trading box Technical analysis. You just need to drag this tool to your chart and after cleanup of objects is finished, the tool will remove itself from the chart. Please check images below that present Before and After using the Removal tool. There is also a short YouTube video at the bottom to show how easy it is to clean your chart after using Trading box tools. - input variable "
    FREE
    筛选:
    Kris
    60
    Kris 2024.11.11 22:51 
     

    Best thing since slice bread! I never really liked the idea of using both Trading View and MT4 to trade. Thanks to this indicator I can finally ditch Trading View. Huge thanks!

    ionut_34
    169
    ionut_34 2023.12.01 20:55 
     

    since i have this tool i don't use tradingview anymore, it has everything you need.

    riad mansee
    25
    riad mansee 2023.10.16 22:58 
     

    I purchased this product and when I changed the platform it no longer worked why ?

    01.dcalantes
    76
    01.dcalantes 2023.09.20 22:12 
     

    This indicator being an MT4 add on that provides it almost a TradingView level of power isn't just hype. A rectangle with a built in Fib level (Split %), RR tool, adding in text, text placement, alerts (for both rectangle and lines)... I was in search of a tool for MT4 to do JUST EVERY SINGLE THING I DO ON TRADINGVIEW. And this delivered all I needed. This tool almost instantly made me fall in love with my MT4 mark ups once again. There's a lot of moving parts, sure, and it might take a while to get used to it, but good thing is the author made a tutorial video to walk me through each function. Amazing. I can see myself using this indicator for as long as I trade. Thank you for creating this masterpiece.

    mmsrect
    63
    mmsrect 2023.08.19 11:31 
     

    This is one indicator that adds everything that is missing from mt4. You may need a day get used to it, but once you do it is amazing. I don't need tradingview anymore. The best part of this tool is its dashboard. Unlike other tools, it does not show you precalculated entries, or setups or other useless stuff. Instead it shows you your own analysis. That is so powerful. Amazing job developers. You nailed it!

    livinglife44
    45
    livinglife44 2023.08.01 18:07 
     

    Game Changer, Using Mt4 all these years now not having to you Tradingview is awesome. A++ Tools here

    RvdHo
    226
    RvdHo 2023.06.11 08:00 
     

    This tool lifts Metatrader to an entirely different level. Seriously good software for the self-directed trader of levels, patterns, trend lines and more. Love the active development and support vids, too.

    dip_
    35
    dip_ 2023.05.11 16:45 
     

    Trading Box technical Analysis is an amazing product! It allows really fast chart annotation and greatly facilitates chart navigation. It practically turns Mt4/5 into TradingView! Here are my favourite functions: The “Scale” function allows you to navigate charts at a set scale. The “@“ function allows you to locate specific areas on the chart (from high timeframes to low timeframes) The “Sync” function allows you to sync your chart annotations on multiple charts. Since the last update, you can very quickly annotate the Open, Close, Low, High and Candle Bodies (Supply or Demand) with simple keyboard shortcuts! I am very happy that I purchased Trading Box Technical Analysis, my charts look great and my analysis is greatly accelerated. One last thing, Igor, the creator of Trading Box Technical Analysis is amazing and very helpful, he answers emails and offers regular updates. In my opinion, Trading Box Technical Analysis is a MUST HAVE if you use Mt4 or Mt5.

    18104
    344
    18104 2023.04.18 12:49 
     

    Great indicator, but I would like it to also be able to synchronize the Fibonacci retracement.

    ako to
    90
    ako to 2023.01.08 14:32 
     

    I TRIED IT. One of the best tools I used. it made things much easier. must give it a try. it's all you need in your trading.

    RNP
    44
    RNP 2022.10.10 03:52 
     

    Truly the closest MT4/5 indicator you can have to match the features of TradingView. With alerts, ability to sync between charts, label and much more, Igor (the developer) continues to expand the features with time. He is also very responsive to questions and has an extensive website that explains in detail all the features. Great indicator from a great developer.

    netguru007
    31
    netguru007 2022.08.25 06:49 
     

    Trading Box Technical Analysis tool is one of the most comprehensive tool available on MetaTrader. I have been using it for a month now and been totally loving all its features. Its an ultimate tool if you are price action trader/Supply and demand trader or a SMC based trader. The alerts & recurring alerts and the Sync option for MTF analysis are some of my favorite functionalities of this tool. Great one time investment for setting up alerts for your charts & MTF analysis and a much cheaper alternative for Tradingview for which you would end up paying close to $300 annually (black friday offer else double the price at $600) for 400 alerts

    Timothy Charlton
    75
    Timothy Charlton 2022.08.17 18:01 
     

    用户没有留下任何评级信息

    Martin Tuke
    270
    Martin Tuke 2022.07.10 21:19 
     

    Great tool, would not be without it now.

    goncalo009
    140
    goncalo009 2022.04.26 23:39 
     

    Hi guys. Really love this indicator. Everything you need on one click. The only thing i think you need add it's auto split rectangle. If i pick rect from color pick will become already split. If this happen i will give you 10 stars

    Retroool
    38
    Retroool 2022.04.26 02:00 
     

    Great indicator, great functionality, ease of access, chart simplicity, supportive creator, etc... What more could one ask? But really, if you are looking to make your charting faster and more efficient, look no further. Just try the demo! (I mean, REALLY test it out), you'll be hooked:)

    fxcommentary
    1903
    fxcommentary 2022.04.12 02:26 
     

    For people using lines/rectangles to alert them - a very good tool. Its main advantage is - it is user friendly to operate. It is highly probable you will be able to incorporate this tool in your routines and it then indeed makes description of your routine faster. Good job, thank you.

    UPDATE: 21.05.2022

    this tool has few exceptional features which are not manifested clearly.

    One of them is the ability to cut support/resistanve line at the point of its breaking by a candle. Example - if you find at 1:05 that the support is broken, and you will cut the support line at 1:07, than your supoort line will no longer extend to the last bar. after 1:07. Your chart on the right is clean and on the left you still have got history of breaking the line. Of course you can do it manually but this tool makes it as easy as possible. This feature alone is worth at least 1/3 or rather 1/2 of the price of the this great tool if you wanted it created to you by any developer. And this is just a tiny little feature, one of many. The cutting is made with [>>>] button.

    azim61
    44
    azim61 2022.03.28 01:55 
     

    This indicator saves my time doing analysis on the chart and be more efficient. Thanks Igor for creating this indicator!

    Devonish
    3078
    Devonish 2022.02.08 11:46 
     

    Very happy with this product. I have my own method of identifying S&R, using this tool is very helpful.

    August 2023. Great update with the FVG feature.

    CasiousD
    814
    CasiousD 2021.12.02 19:04 
     

    Absolutely amazing tool. I was only interested for one function that I couldn't find implemented in a good way in any other indicator. Once I started using it, I realized all the other great functionality that is available, and now this has replaced the job of 4, yes FOUR other indicators I no longer need because of this. Makes my charts cleaner and less cluttered, and I am much, much more efficient and effective with my analysis and decision making. It may seem a bit daunting, but it's so simple to learn and use, and you can quickly find use for things that you didn't even realize you needed. Also love that it has a check for compatibilty, or rather incompatibility with other indicators...I'm not sure how it works because I don't have many other indicators on my chart anymore since I started using this, so I haven't run into any conflicts. But I'm sure there is a video or documentation that explains it somewhere among the many instructional videos provided by the author, which is an absolute plus! Finally, author is very responsive and helpful! Thank you Igor!

    12
    回复评论
    版本 10.35 2024.11.07
    - new hotkey Y for SYNC function
    版本 10.34 2024.10.25
    - new input variable "SYNC: Show Master/Slave box"
    版本 10.33 2024.09.30
    - recompile with new Metatrader client
    版本 10.32 2024.08.30
    - rectangle Split function copy TF visibility
    版本 10.31 2024.08.01
    Fakeout alert indicator - false breakout indicator alert
    https://www.youtube.com/watch?v=7Og2dMjH3Ck

    https://www.mt4tradingbox.com/technical-analysis/#fakeout
    版本 10.30 2024.06.26
    - font color fix for Alert History label
    版本 10.29 2024.06.24
    hotkey update: "E" - Extend/unextend selected trendline or rectangle
    版本 10.28 2024.06.20
    - NEW hotkey E to Extend selected trendline or rectangle
    版本 10.27 2024.03.22
    - object name change bug fix
    版本 10.26 2024.03.16
    - reported bug fix
    版本 10.25 2024.03.12
    - bug fix: text objects deleted on object property change
    版本 10.24 2024.03.03
    - bug fix
    版本 10.23 2024.02.29
    - performance upgrade
    版本 10.22 2024.02.24
    - NEW dropdown option "Name & Price (Trendline)" for input "Extended trendline name position"
    版本 10.21 2024.02.17
    - update
    版本 10.20 2024.01.07
    - hotkeys S D settings via input "Click SD and S D hotkeys rectangle drawing"
    版本 10.19 2024.01.02
    - new "Pr" button to show rectangle and trendline Price tag

    - button "No text" renamed to button "Name"

    Link: https://www.mt4tradingbox.com/technical-analysis/#nameprice
    版本 10.18 2023.12.30
    - NEW input "Click SD rectangle drawing options"
    1. High & Low (Whole candle))
    2. Open & Close (Candle body)
    3. Body & Tail
    4. Candle Tail,Wick,Shadow

    - NEW "X" button to delete selected rectangle or trendline
    版本 10.17 2023.12.29
    - Hotkey remapping for LTF, MTF, HTF:

    X - Show/hide TBTA buttons
    W - Show FVG
    Q - Chart Scale
    1 - Line thickness
    2 - Line thickness
    3 - LTF
    4 - MTF
    5 - HTF
    A - @ (Move chart to selected object Time1)
    版本 10.16 2023.12.28
    New Hotkeys:
    X - Show/hide TBTA buttons
    W - Show FVG
    Q - Chart Scale
    1 - Line thickness
    2 - Line thickness
    L - LTF
    M - MTF
    H - HTF
    A - @ (Move chart to selected object Time1)
    版本 10.15 2023.12.14
    - NEW input "Show name text after un-extend <<"
    版本 10.14 2023.12.10
    - display bug fix for "Flat TL" button
    版本 10.13 2023.12.05
    - performance upgrade
    版本 10.12 2023.12.03
    - split line % display fixed based on trendline TF
    版本 10.11 2023.12.02
    - NEW hotkey "X" to show/hide TBTA buttons

    - NEW input variables:
    "Un-extend Rectangle after Close, Engulf"
    "Un-extend Trendline after Alert, Close, Retest"

    - NEW input variable "Unfill rectangle after Engulf, Close"
    版本 10.1 2023.11.30
    - NEW hotkeys input variables:
    H - High hotkey trendline name
    L - Low hotkey trendline name
    O - Open hotkey trendline name
    C - Close hotkey trendline name

    - NEW input variable "Extended trendline style after Alert, Close, Retest"

    - NEW input variable "Ray trendline style after Alert, Close, Retest"
    版本 10.0 2023.11.06
    - LTF/MTF/HTF button bug solved
    版本 9.99 2023.11.01
    - when unsync Master also unsync all Slaves
    - NEW input variable "SYNC: Unsync master - Delete slave objects"
    - NEW input variable "SYNC: Synced master - Visible for CURRENT and selected HTF/MTF/LTF"
    版本 9.98 2023.10.08
    - NEW input "Extended object location"
    - Right edge of the chart
    - Current chart time/bar

    - NEW button "Flat TL" to enable drawing flat trendlines by default
    Manuals: https://www.mt4tradingbox.com/technical-analysis/#flatTL
    版本 9.97 2023.08.12
    - new button "Show FVG" - Button to show ALL Fair Value Gaps (FVG indicator mt5 mt4)

    Video: https://www.youtube.com/watch?v=oiHHztd1dzI

    - new inputs:
    Show FVG - Search bars in history (0 = default)
    Show FVG rectangle color - Untouched/Untested
    Show FVG rectangle color - Touched/Tested
    版本 9.96 2023.08.05
    - bug fix for SYNC extended rectangle
    版本 9.95 2023.08.04
    - added Hotkey F for FVG - Fair Value Gap
    版本 9.94 2023.08.03
    - update for Rectangle position changer indicator
    版本 9.93 2023.07.28
    - bug fix TF colors for: new created objects, Click SD, Click FVG
    版本 9.92 2023.07.24
    - new button "Click FVG". When click on candle with FVG - Fair Value Gaps, then draws the price imbalance rectangle (FVG; ICT Fair Value Gaps Imbalances)
    VIDEO: https://www.youtube.com/watch?v=pBRXTKNIMAk
    版本 9.91 2023.07.16
    - NEW input variable "SYNC: Copy object Time Frame settings from Master to Slave"
    VIDEO: https://www.youtube.com/watch?v=j1JFTERPWXo
    版本 9.90 2023.06.30
    - big fixes
    版本 9.89 2023.06.10
    - bug fixes for Rectangle Split function
    VIDEO: https://www.youtube.com/watch?v=r9p1HhjVMhg
    版本 9.88 2023.05.28
    - NEW trendline button "Retest" used for breakout and retest strategy. Breakout Retest function triggers an alert if the candle closes beyond trendline and then price touches trendline for retest in trading.
    VIDEO: https://www.youtube.com/watch?v=A_JOXfpo2Eg
    版本 9.87 2023.05.27
    - NEW trendline button "Retest" used for breakout and retest strategy. Breakout Retest function triggers an alert if the candle closes beyond trendline and then price touches trendline for retest in trading.
    VIDEO: https://www.youtube.com/watch?v=A_JOXfpo2Eg
    版本 9.85 2023.05.24
    - Fibonacci retracement indicator Multi chart SYNC
    VIDEO: https://www.youtube.com/watch?v=QgvL1lcOigY

    - NEW input "Show hotkeys S,D,H,L,O,C"
    版本 9.84 2023.05.24
    - Fibonacci retracement indicator Multi chart SYNC
    VIDEO: https://www.youtube.com/watch?v=QgvL1lcOigY
    版本 9.83 2023.05.19
    - input variable "TimeFrame colors for created Rectangle, Trend, HLine, VLine" will change color only for objects created with Trading box Technical analysis indicator
    版本 9.82 2023.05.12
    - NEW input variables:
    Extended trendline width - Hotkeys High, Low
    Extended trendline width - Hotkeys Open, Close
    版本 9.81 2023.05.06
    - Separate TimeFrame colors for created Rectangles and Lines(Trend, Horizontal, Vertical)
    版本 9.8 2023.05.05
    Hotkeys for drawing Support Resistance levels and Supply Demand zones
    Last clicked candle Hotkeys:
    S - Supply
    D - Demand
    H - High
    L - Low
    O - Open
    C - Close

    VIDEO: https://www.youtube.com/watch?v=DAldGe6hO24
    版本 9.7 2023.05.01
    - NEW input "Use TimeFrame colors for new created objects" and color selection for each standard timeframe
    VIDEO: https://www.youtube.com/watch?v=OFLsZOWXDhM

    - NEW button "Click SD" with ON//OFF logic for extended rectangle creation when user click on candle. Zone is based on candle High and Low price
    VIDEO: https://www.youtube.com/watch?v=nPRR-_yHfCg

    - Horizontal line "<< Break line" button display optimization for faster history search
    VIDEO: https://www.youtube.com/watch?v=ZxxxSy5bwMc
    版本 9.6 2023.04.09
    - button display optimization for non extended rectangles and trendlines
    版本 9.5 2023.04.01
    - bug fix for hiding buttons on selected rectangle when using "Rectangle position changer" indicator on same chart

    - input "Extended object text position" replaced by 2 NEW inputs: "Extended rectangle name position" and "Extended trendline name position"
    版本 9.4 2023.02.08
    - NEW option "Shift to rectangle & trendline engulf" for input variable "Rectangle << button function"
    - NEW input "Button text color"
    版本 9.3 2023.02.05
    - NEW input variable "Rectangle << button function" with option "Shift to rectangle engulf"
    VIDEO: https://www.youtube.com/watch?v=tyAEXGoAyYE
    版本 9.2 2023.01.15
    - Vertical Line added to Chart SYNC function
    版本 9.1 2022.12.26
    - new input variable "Engulf alert un-fill rectangle"
    版本 9.0 2022.12.10
    - SYNC rectangle function now works with Rectangle position changer indicator
    版本 8.9 2022.11.19
    - rectangle and trendline alert buttons visible within chart when scrolling left
    版本 8.8 2022.11.07
    - bug fixed after renaming object
    版本 8.7 2022.11.05
    - CPU usage reduced and chart freeze bug fixed
    版本 8.6 2022.11.03
    - performance upgrade that will lower CPU usage on MetaTrader terminal
    版本 8.4 2022.10.07
    - NEW option "Right outside" for input variable "Extended object text position"
    版本 8.3 2022.10.02
    - NEW input variable "Show 5 additional rename buttons"
    版本 8.2 2022.09.26
    - NEW input "Empty rectangle width"

    VIDEO: https://www.youtube.com/watch?v=P8eME8csQZY
    版本 8.1 2022.09.17
    - new input variable "Extended object text position" with options (Right, Left)
    版本 8.0 2022.09.15
    - new Split % button for rectangles to show premium or discount price like Fibonacci retracement
    - Bands button added for non-extended rectangles

    VIDEO: https://www.youtube.com/watch?v=VNPYUSUUdaA
    版本 7.9 2022.09.12
    - object extension bug fix when MetaTrader opens
    版本 7.8 2022.09.09
    - NEW inputs added:
    Unfilled extended rectangle style
    Unfilled extended rectangle width

    - 4 NEW color buttons for filled and empty rectangles
    版本 7.7 2022.09.02
    - bug fix for Rename button and Timeframe visibility
    版本 7.6 2022.08.21
    - new input variable "Chart, alerts and drawings refresh speed"
    版本 7.5 2022.08.12
    - new button "Hide text" that hides all texts and alerts on chart
    - "Rename" button now works with SYNC
    - Text position is copied when SYNC button is used for non-extended rectangle or trendline
    版本 7.4 2022.08.04
    - "Bands" rectangle function upgraded with (Upper) and (Lower) tag for rectangle Upper and Lower edge
    版本 7.3 2022.08.03
    - Rename button added for extended rectangle and trendline
    版本 7.1 2022.08.01
    - bug fix for "Trend" and "Hline" button with input variable "TF visibility for newly created rectangle & trendline"
    版本 7.0 2022.07.30
    NEW button Rename gives option to rename the zones from the suggested list

    VIDEO: https://www.youtube.com/watch?v=-_5njoa0etk
    版本 6.7 2022.05.28
    - update to sync with TBOM tool new functions
    See the new function added to Trading box Order management that allow automation price action within a trading scale:
    VIDEO: https://www.youtube.com/watch?v=Mdw211-Y9b0
    版本 6.6 2022.05.09
    - performance upgrade
    版本 6.4 2022.04.28
    - NEW button "Trend" and "HLine" that will create trendline and horizontal line in the middle of the chart

    - NEW input variables:
    Show Trend and HLine button (object create)
    Create trendline color - Trend button
    Create trendline style - Trend button
    Create trendline width - Trend button
    Create horizontal line color - HLine button
    Create horizontal line style - HLine button
    Create horizontal line width - HLine button

    Upgrade VIDEO: https://www.youtube.com/watch?v=ScEICIIEEKI
    版本 6.2 2022.04.09
    - bug fix and recompile for new Metatrader terminal version
    版本 6.1 2022.01.30
    - NEW input variable "Show Filled color buttons"

    - NEW History button that will show the time of last alert in the label. This information is transferred to Technical analysis dashboard where you can see last alerts of all charts in one list

    ***UPGRADE VIDEO: https://www.youtube.com/watch?v=LsTozwEajpk
    版本 6.0 2022.01.02
    - NEW input variable "Candle close alert settings" with 2 options:
    1. Current chart TF alert
    2. Alert in TF when Close is clicked
    版本 5.9 2021.12.23
    - compliance upgrade for the NEW tool "Rectangle position changer"

    Download: https://www.mql5.com/en/market/product/75865

    VIDEO: https://www.youtube.com/watch?v=IYW1dgOWwRg
    版本 5.8 2021.12.06
    - bug fix for input variable "TF visibility for newly created rectangle & trendline" when rectangle is created with click on color button
    版本 5.7 2021.11.28
    - Color button rectangle creation improved, after extended color will stay the same
    版本 5.6 2021.11.27
    - bug fix for creating rectangles with color buttons when market is closed
    版本 5.5 2021.11.27
    - CPU usage reduced that will allow more charts with TBTA in MetaTrader terminal
    版本 5.4 2021.11.16
    - bug fix for non extended rectangle Risk Reward tool
    - bug fix when rectangle name is changed and Split function is ON
    - CPU performance improvement when using TBTA on multiple charts
    版本 5.3 2021.11.01
    - risk reward tool for non-extended rectangles
    - adding more texts positions (object names) to rectangle and trendline. With button "X" you remove current text
    - if no object is selected then color buttons will create a new rectangle, otherwise the selected object color will be changed

    - NEW "Split" button added that will split extended rectangle with alert trendline (default 50% rectangle size)
    - NEW input "Default rectangle split % (0-100)"
    - NEW input "Split line color"
    - NEW input "Split line style"
    版本 5.2 2021.10.22
    - selecting object bug fixed
    版本 5.1 2021.10.07
    - upgrade for link with new BACK button on Dashboard tool
    版本 5.0 2021.10.07
    - NEW "D" button is added that will show chart with "Technical analysis Dashboard" tool

    FREE Dashboard: https://www.mql5.com/en/market/product/72876

    VIDEO: https://www.youtube.com/watch?v=qzC9jpNshw4
    版本 4.8 2021.08.29
    - SYNC button will copy Bands function (if enabled) from Master to Slave rectangle

    - SYNC function in combination with LTF, MTF, HTF buttons will copy timeframe visibility from Master to Slave object when LTF, MTF, HTF button will be assigned to Master object

    - bug fix for SYNC function with combination of input "Visibility for current and lower timeframes"
    版本 4.7 2021.08.22
    - NEW "Bands" button will create top and bottom rectangle lines visible on all TF but filled rectangle will be visible only on current TF. This will help you to see HTF levels on lower timeframes.
    Rectangle top and bottom lines will be dashed for higher timeframes and solid for lower timerames.
    When you disable "Bands" button it will restore rectangle TF visibility.

    - NEW "Scale" button that will switch chart to "Fixed scale mode" that gives you option to move freely around the chart vertical and horizontal. It also gives you opportunity to get feeling for price movements

    VIDEO: https://www.youtube.com/watch?v=OwfjWmBzPG8
    版本 4.6 2021.08.01
    - improved performance between Trading box tools (Order management, Technical analysis, Rectangle extender, Order box Dashboard)
    版本 4.5 2021.08.01
    - bug fix for "X" button display when TBTA is loaded on new chart
    - extended rectangle and trendline buttons display correction for high resolution displays
    版本 4.3 2021.07.31
    - bug fix for chart clean up after indicator is removed
    版本 4.2 2021.07.29
    - removed input variable "Set larger button text"

    - NEW input variable "Button font size"
    - NEW input variable "Button size scale


    - NEW input "TF visibility for newly created rectangle & trendline"
    1. No automatic timeframe visibility
    2. Visibility for current and lower timeframes

    - SYNC button bug solved: Timeframe visibility was not copied from Master to Slave at object creation
    版本 4.1 2021.07.20
    - NEW input variable "Show pip distance in brackets"

    - button click lagging solved
    版本 4.0 2021.07.17
    - bug fix when Trading box Order management and Technical analysis are used on the same chart
    版本 3.9 2021.07.10
    - NEW input variable "Extended trendline width"
    - NEW input variable "Compression line width"
    - NEW input variable "Ray trendline width"
    版本 3.8 2021.07.07
    - larger color and line width buttons when input variable "Set larger button text" is set to TRUE
    版本 3.7 2021.07.06
    - NEW input variable "Set larger button text" that will create a little bigger buttons and font size +2
    - NEW input variable "Flat trendline width"
    - NEW input variable "Line width button 1"
    - NEW input variable "Line width button 2"
    版本 3.5 2021.06.20
    - NEW input variable "Bring Alerted chart to the top"

    - NEW input variable "Extend new created rectangle"
    - NEW input variable "Extend new created trendline"
    版本 3.4 2021.05.25
    - bug fix for button display
    版本 3.3 2021.05.16
    - NEW "Text" button that gives options to display rectangle or trendline text in all possible spots around or inside object. This works for non-extended rectangles and trendlines where we would like to have object name displayed in suitable place around or inside object. This is custom show object name function.

    - NEW "SYNC" button (sync chart object or chart sync object) function for selected rectangle, trendline and horizontal line object chart synchronization on the same symbol (charts synchronizer, object sync)
    The selected master object is copied to other charts of the same symbol.
    Object position location and color style is updated from master to slave object and vice versa.
    When you delete master object then slave objects will be deleted and NOT vice versa.
    If you rename master object then you broke connection with slave objects. If you rename slave object then is no longer synced with master object.
    "SYNC" button can also remove synchronization from selected master or slave object.

    - NEW input "Show extra color buttons" that will display 6 "Filled" color and 6 "Empty" color buttons

    - Bug fix: if you click on tickness buton "1" or "2", it will change object from filled to unfilled

    - Safety check warning for too many objects on chart (performance issues) + warning for incompatible indicators

    UPGRADE VIDEO: https://www.youtube.com/watch?v=asGmONlI4EY
    版本 3.2 2021.03.27
    - better sync with Trading box Order management v3.0 objects
    版本 3.1 2021.03.01
    New input variables added and used when you extend rectangle or trendline:
    - Alert enabled by default
    - Engulf enabled by default
    - Close enabled by default
    - No text enabled by default
    版本 2.9 2021.02.17
    - bug fix reported by users
    版本 2.8 2021.02.04
    - bug fix for full zoom chart label positions
    版本 2.7 2021.02.01
    - input variables description added

    - new input variables:
    - Selected object buttons position
    - Rectangle pip size position
    版本 2.6 2021.01.16
    - switching between timeframes bug solved
    版本 2.5 2020.12.27
    Important MAJOR performance upgrade and bug fix:
    - CPU load problems solved (better chart and object refresh logic)
    - Ignoring Trading box Order management objects
    - All user bug reports solved
    - Works better with other indicators
    版本 2.4 2020.12.09
    MAJOR UPGRADE:
    - added email alert option
    - added 3 new variables to manage alerts and notifications (send_mobile_push_notification, send_email_alert, show_popup_alert)
    - optimized chart refresh rate that will reduce CPU load from 30% up to 500%
    - minor bugs solved and added some additional safe checkups for drawing rectangles and trendlines
    版本 2.3 2020.11.06
    - minor bug fix for >> button when used on rectangle
    版本 2.2 2020.11.02
    - another bug solved when clicking << button
    版本 2.1 2020.11.02
    - bug fix for << button and when rename trendline
    版本 2.0 2020.10.30
    - added new input variable extend_if_auto_scroll_off that will give you option to have fixed extended object size if you have auto scroll option diabled
    版本 1.9 2020.10.29
    - minor bug fixed when Auto scroll is OFF. Objects are extended to the right side of the chart
    版本 1.8 2020.10.14
    - bug fix for Close button, when used on chart with no previusly loaded data on new switched timeframe
    版本 1.7 2020.10.04
    - minor bug fix for alert arrows timeframe visibility
    版本 1.6 2020.10.03
    - minor bug fix for @ button when search for trendline origin history
    版本 1.5 2020.09.27
    MAJOR upgrade
    - new Flat button for trendline (creates horizontal flat trendline)
    - new Close button for rectangle, trendline and ray (alert when current candle closes beyond object price)
    - new R button to enable you repeat alert sound every few seconds (you can set repeat interval in seconds with sound_repeat_seconds_interval)
    - new input parameters for sound repeat alerts for supply, demand, resistance and support (The file must be located in terminal_directory\Sounds. Only WAV files are played)
    - when you click on extended rectangle it shows you Demand or Supply type of rectangle
    - if you extend rectangle around price then you have option to decide if this rectangle is supply or demand
    版本 1.4 2020.09.07
    - minor preformance upgrades
    版本 1.3 2020.08.12
    - new input parameter button_position is added for placing buttons in different corner positions
    版本 1.2 2020.08.08
    - button fix for Demand extended rectangle
    版本 1.1 2020.08.04
    - Rectangle and trendline function buttons are now aligned on right side of charts, so they not overlay with other trendlines and rectangles
    - Button positions corrections