バージョン 10.35
2024.11.07
- new hotkey Y for SYNC function
バージョン 10.34
2024.10.25
- new input variable "SYNC: Show Master/Slave box"
バージョン 10.33
2024.09.30
- recompile with new Metatrader client
バージョン 10.32
2024.08.30
- rectangle Split function copy TF visibility
バージョン 10.31
2024.08.01
Fakeout alert indicator - false breakout indicator alert
https://www.youtube.com/watch?v=7Og2dMjH3Ck
https://www.mt4tradingbox.com/technical-analysis/#fakeout
バージョン 10.30
2024.06.26
- font color fix for Alert History label
バージョン 10.29
2024.06.24
hotkey update: "E" - Extend/unextend selected trendline or rectangle
バージョン 10.28
2024.06.20
- NEW hotkey E to Extend selected trendline or rectangle
バージョン 10.27
2024.03.22
- object name change bug fix
バージョン 10.26
2024.03.16
- reported bug fix
バージョン 10.25
2024.03.12
- bug fix: text objects deleted on object property change
バージョン 10.24
2024.03.03
- bug fix
バージョン 10.23
2024.02.29
- performance upgrade
バージョン 10.22
2024.02.24
- NEW dropdown option "Name & Price (Trendline)" for input "Extended trendline name position"
バージョン 10.21
2024.02.17
- update
バージョン 10.20
2024.01.07
- hotkeys S D settings via input "Click SD and S D hotkeys rectangle drawing"
バージョン 10.19
2024.01.02
- new "Pr" button to show rectangle and trendline Price tag
- button "No text" renamed to button "Name"
Link: https://www.mt4tradingbox.com/technical-analysis/#nameprice
バージョン 10.18
2023.12.30
- NEW input "Click SD rectangle drawing options"
1. High & Low (Whole candle))
2. Open & Close (Candle body)
3. Body & Tail
4. Candle Tail,Wick,Shadow
- NEW "X" button to delete selected rectangle or trendline
バージョン 10.17
2023.12.29
- Hotkey remapping for LTF, MTF, HTF:
X - Show/hide TBTA buttons
W - Show FVG
Q - Chart Scale
1 - Line thickness
2 - Line thickness
3 - LTF
4 - MTF
5 - HTF
A - @ (Move chart to selected object Time1)
バージョン 10.16
2023.12.28
New Hotkeys:
X - Show/hide TBTA buttons
W - Show FVG
Q - Chart Scale
1 - Line thickness
2 - Line thickness
L - LTF
M - MTF
H - HTF
A - @ (Move chart to selected object Time1)
バージョン 10.15
2023.12.14
- NEW input "Show name text after un-extend <<"
バージョン 10.14
2023.12.10
- display bug fix for "Flat TL" button
バージョン 10.13
2023.12.05
- performance upgrade
バージョン 10.12
2023.12.03
- split line % display fixed based on trendline TF
バージョン 10.11
2023.12.02
- NEW hotkey "X" to show/hide TBTA buttons
- NEW input variables:
"Un-extend Rectangle after Close, Engulf"
"Un-extend Trendline after Alert, Close, Retest"
- NEW input variable "Unfill rectangle after Engulf, Close"
バージョン 10.1
2023.11.30
- NEW hotkeys input variables:
H - High hotkey trendline name
L - Low hotkey trendline name
O - Open hotkey trendline name
C - Close hotkey trendline name
- NEW input variable "Extended trendline style after Alert, Close, Retest"
- NEW input variable "Ray trendline style after Alert, Close, Retest"
バージョン 10.0
2023.11.06
- LTF/MTF/HTF button bug solved
バージョン 9.99
2023.11.01
- when unsync Master also unsync all Slaves
- NEW input variable "SYNC: Unsync master - Delete slave objects"
- NEW input variable "SYNC: Synced master - Visible for CURRENT and selected HTF/MTF/LTF"
バージョン 9.98
2023.10.08
- NEW input "Extended object location"
- Right edge of the chart
- Current chart time/bar
- NEW button "Flat TL" to enable drawing flat trendlines by default
Manuals: https://www.mt4tradingbox.com/technical-analysis/#flatTL
バージョン 9.97
2023.08.12
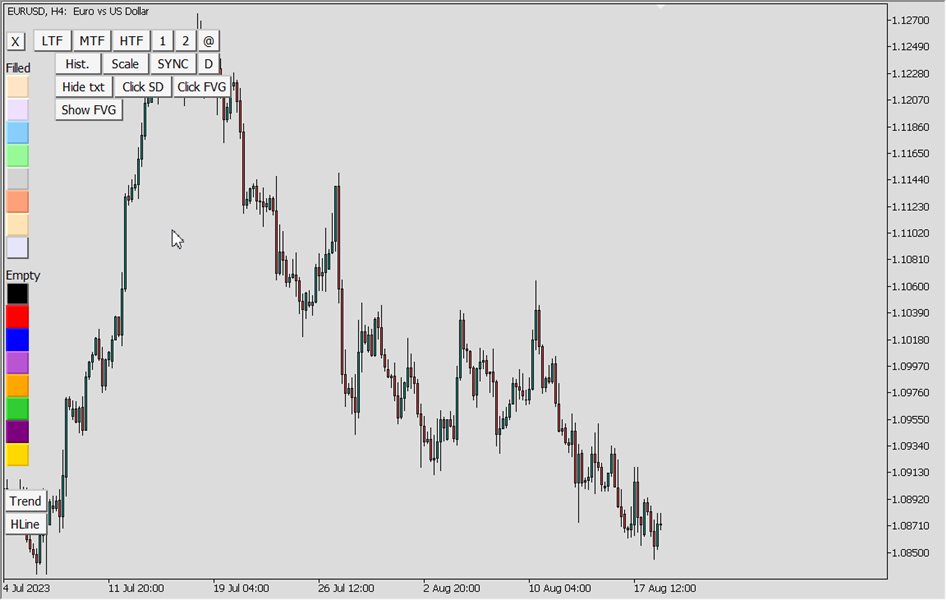
- new button "Show FVG" - Button to show ALL Fair Value Gaps (FVG indicator mt5 mt4)
Video: https://www.youtube.com/watch?v=oiHHztd1dzI
- new inputs:
Show FVG - Search bars in history (0 = default)
Show FVG rectangle color - Untouched/Untested
Show FVG rectangle color - Touched/Tested
バージョン 9.96
2023.08.05
- bug fix for SYNC extended rectangle
バージョン 9.95
2023.08.04
- added Hotkey F for FVG - Fair Value Gap
バージョン 9.94
2023.08.03
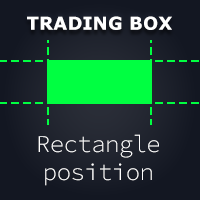
- update for Rectangle position changer indicator
バージョン 9.93
2023.07.28
- bug fix TF colors for: new created objects, Click SD, Click FVG
バージョン 9.92
2023.07.24
- new button "Click FVG". When click on candle with FVG - Fair Value Gaps, then draws the price imbalance rectangle (FVG; ICT Fair Value Gaps Imbalances)
VIDEO: https://www.youtube.com/watch?v=pBRXTKNIMAk
バージョン 9.91
2023.07.16
- NEW input variable "SYNC: Copy object Time Frame settings from Master to Slave"
VIDEO: https://www.youtube.com/watch?v=j1JFTERPWXo
バージョン 9.90
2023.06.30
- big fixes
バージョン 9.89
2023.06.10
- bug fixes for Rectangle Split function
VIDEO: https://www.youtube.com/watch?v=r9p1HhjVMhg
バージョン 9.88
2023.05.28
- NEW trendline button "Retest" used for breakout and retest strategy. Breakout Retest function triggers an alert if the candle closes beyond trendline and then price touches trendline for retest in trading.
VIDEO: https://www.youtube.com/watch?v=A_JOXfpo2Eg
バージョン 9.87
2023.05.27
- NEW trendline button "Retest" used for breakout and retest strategy. Breakout Retest function triggers an alert if the candle closes beyond trendline and then price touches trendline for retest in trading.
VIDEO: https://www.youtube.com/watch?v=A_JOXfpo2Eg
バージョン 9.85
2023.05.24
- Fibonacci retracement indicator Multi chart SYNC
VIDEO: https://www.youtube.com/watch?v=QgvL1lcOigY
- NEW input "Show hotkeys S,D,H,L,O,C"
バージョン 9.84
2023.05.24
- Fibonacci retracement indicator Multi chart SYNC
VIDEO: https://www.youtube.com/watch?v=QgvL1lcOigY
バージョン 9.83
2023.05.19
- input variable "TimeFrame colors for created Rectangle, Trend, HLine, VLine" will change color only for objects created with Trading box Technical analysis indicator
バージョン 9.82
2023.05.12
- NEW input variables:
Extended trendline width - Hotkeys High, Low
Extended trendline width - Hotkeys Open, Close
バージョン 9.81
2023.05.06
- Separate TimeFrame colors for created Rectangles and Lines(Trend, Horizontal, Vertical)
バージョン 9.8
2023.05.05
Hotkeys for drawing Support Resistance levels and Supply Demand zones
Last clicked candle Hotkeys:
S - Supply
D - Demand
H - High
L - Low
O - Open
C - Close
VIDEO: https://www.youtube.com/watch?v=DAldGe6hO24
バージョン 9.7
2023.05.01
- NEW input "Use TimeFrame colors for new created objects" and color selection for each standard timeframe
VIDEO: https://www.youtube.com/watch?v=OFLsZOWXDhM
- NEW button "Click SD" with ON//OFF logic for extended rectangle creation when user click on candle. Zone is based on candle High and Low price
VIDEO: https://www.youtube.com/watch?v=nPRR-_yHfCg
- Horizontal line "<< Break line" button display optimization for faster history search
VIDEO: https://www.youtube.com/watch?v=ZxxxSy5bwMc
バージョン 9.6
2023.04.09
- button display optimization for non extended rectangles and trendlines
バージョン 9.5
2023.04.01
- bug fix for hiding buttons on selected rectangle when using "Rectangle position changer" indicator on same chart
- input "Extended object text position" replaced by 2 NEW inputs: "Extended rectangle name position" and "Extended trendline name position"
バージョン 9.4
2023.02.08
- NEW option "Shift to rectangle & trendline engulf" for input variable "Rectangle << button function"
- NEW input "Button text color"
バージョン 9.3
2023.02.05
- NEW input variable "Rectangle << button function" with option "Shift to rectangle engulf"
VIDEO: https://www.youtube.com/watch?v=tyAEXGoAyYE
バージョン 9.2
2023.01.15
- Vertical Line added to Chart SYNC function
バージョン 9.1
2022.12.26
- new input variable "Engulf alert un-fill rectangle"
バージョン 9.0
2022.12.10
- SYNC rectangle function now works with Rectangle position changer indicator
バージョン 8.9
2022.11.19
- rectangle and trendline alert buttons visible within chart when scrolling left
バージョン 8.8
2022.11.07
- bug fixed after renaming object
バージョン 8.7
2022.11.05
- CPU usage reduced and chart freeze bug fixed
バージョン 8.6
2022.11.03
- performance upgrade that will lower CPU usage on MetaTrader terminal
バージョン 8.4
2022.10.07
- NEW option "Right outside" for input variable "Extended object text position"
バージョン 8.3
2022.10.02
- NEW input variable "Show 5 additional rename buttons"
バージョン 8.2
2022.09.26
- NEW input "Empty rectangle width"
VIDEO: https://www.youtube.com/watch?v=P8eME8csQZY
バージョン 8.1
2022.09.17
- new input variable "Extended object text position" with options (Right, Left)
バージョン 8.0
2022.09.15
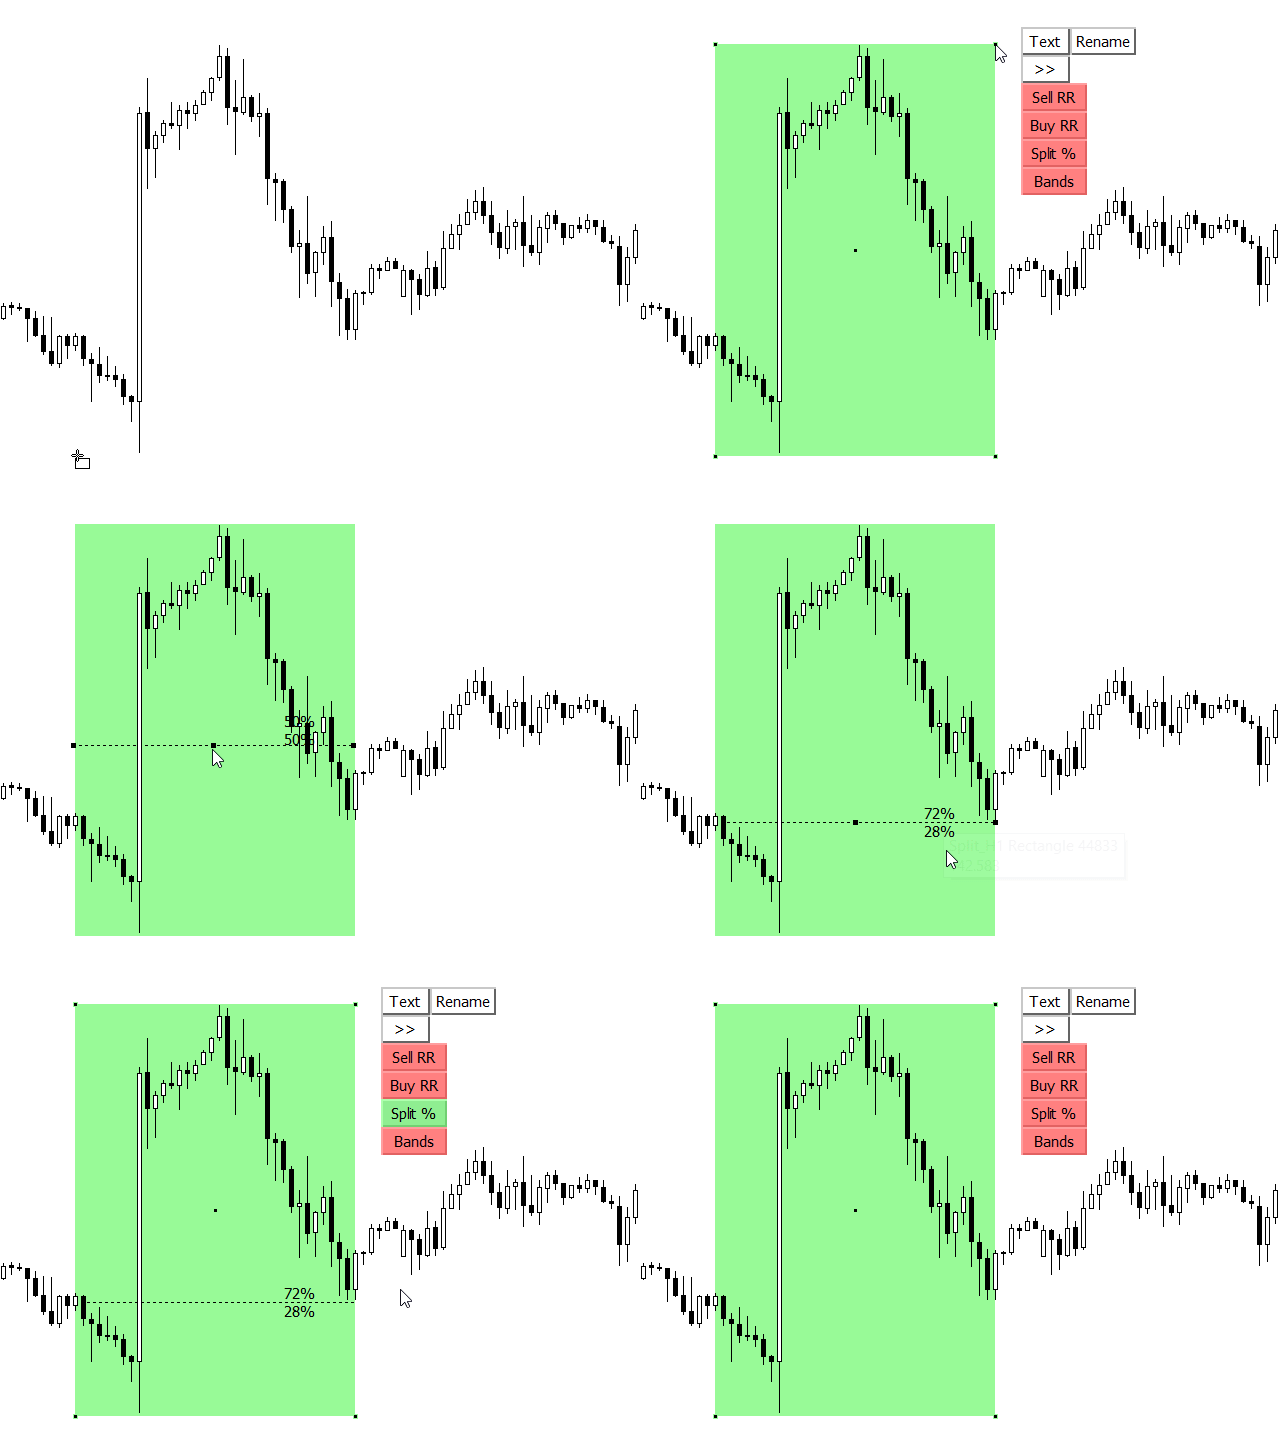
- new Split % button for rectangles to show premium or discount price like Fibonacci retracement
- Bands button added for non-extended rectangles
VIDEO: https://www.youtube.com/watch?v=VNPYUSUUdaA
バージョン 7.9
2022.09.12
- object extension bug fix when MetaTrader opens
バージョン 7.8
2022.09.09
- NEW inputs added:
Unfilled extended rectangle style
Unfilled extended rectangle width
- 4 NEW color buttons for filled and empty rectangles
バージョン 7.7
2022.09.02
- bug fix for Rename button and Timeframe visibility
バージョン 7.6
2022.08.21
- new input variable "Chart, alerts and drawings refresh speed"
バージョン 7.5
2022.08.12
- new button "Hide text" that hides all texts and alerts on chart
- "Rename" button now works with SYNC
- Text position is copied when SYNC button is used for non-extended rectangle or trendline
バージョン 7.4
2022.08.04
- "Bands" rectangle function upgraded with (Upper) and (Lower) tag for rectangle Upper and Lower edge
バージョン 7.3
2022.08.03
- Rename button added for extended rectangle and trendline
バージョン 7.1
2022.08.01
- bug fix for "Trend" and "Hline" button with input variable "TF visibility for newly created rectangle & trendline"
バージョン 7.0
2022.07.30
NEW button Rename gives option to rename the zones from the suggested list
VIDEO: https://www.youtube.com/watch?v=-_5njoa0etk
バージョン 6.7
2022.05.28
- update to sync with TBOM tool new functions
See the new function added to Trading box Order management that allow automation price action within a trading scale:
VIDEO: https://www.youtube.com/watch?v=Mdw211-Y9b0
バージョン 6.6
2022.05.09
- performance upgrade
バージョン 6.4
2022.04.28
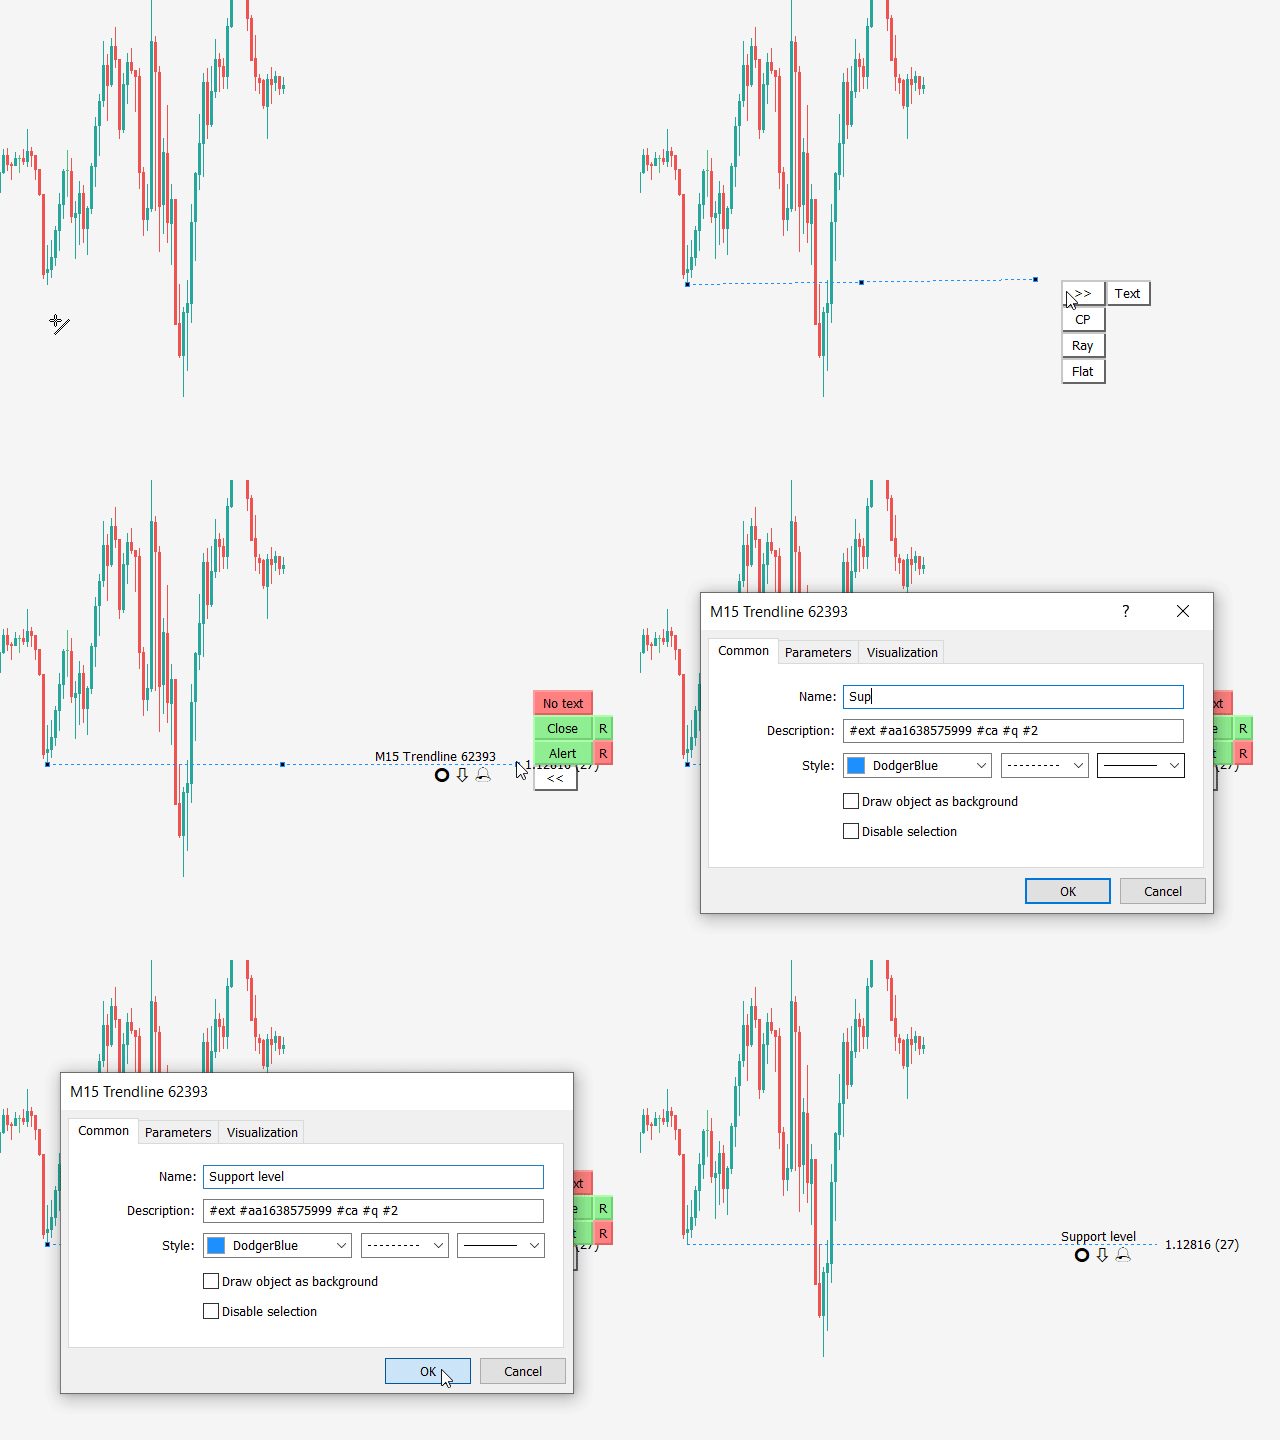
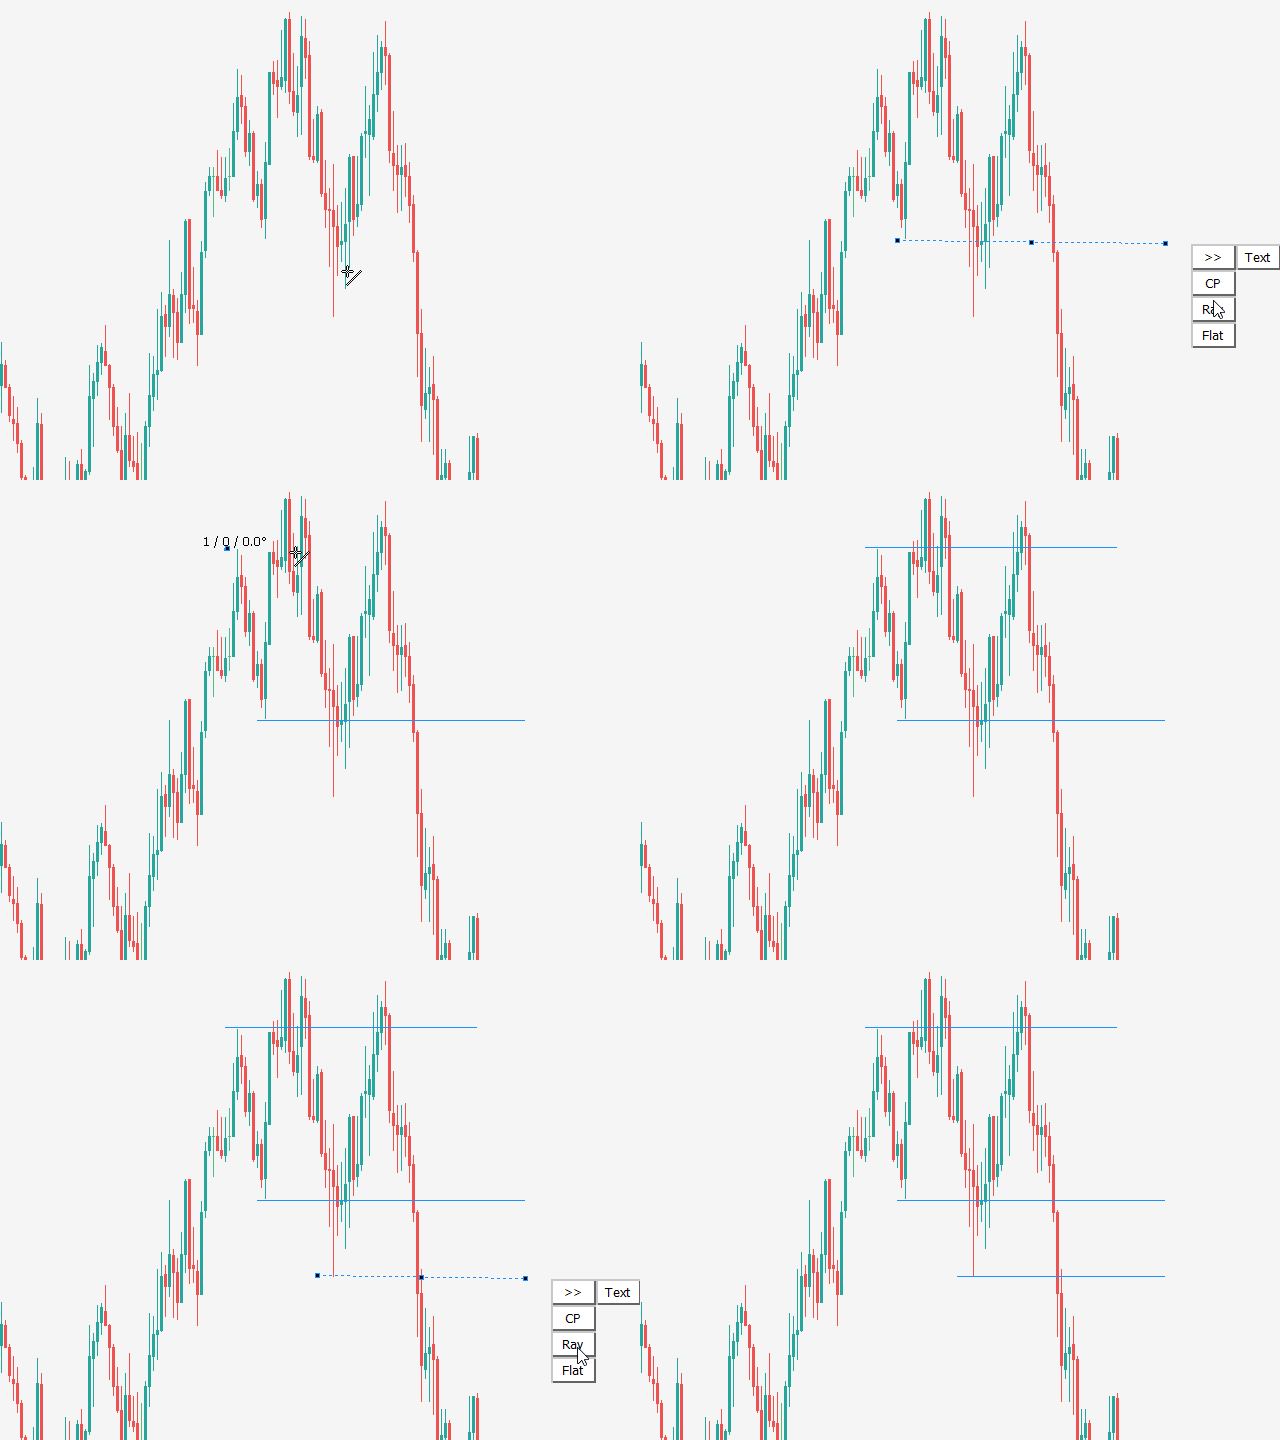
- NEW button "Trend" and "HLine" that will create trendline and horizontal line in the middle of the chart
- NEW input variables:
Show Trend and HLine button (object create)
Create trendline color - Trend button
Create trendline style - Trend button
Create trendline width - Trend button
Create horizontal line color - HLine button
Create horizontal line style - HLine button
Create horizontal line width - HLine button
Upgrade VIDEO: https://www.youtube.com/watch?v=ScEICIIEEKI
バージョン 6.2
2022.04.09
- bug fix and recompile for new Metatrader terminal version
バージョン 6.1
2022.01.30
- NEW input variable "Show Filled color buttons"
- NEW History button that will show the time of last alert in the label. This information is transferred to Technical analysis dashboard where you can see last alerts of all charts in one list
***UPGRADE VIDEO: https://www.youtube.com/watch?v=LsTozwEajpk
バージョン 6.0
2022.01.02
- NEW input variable "Candle close alert settings" with 2 options:
1. Current chart TF alert
2. Alert in TF when Close is clicked
バージョン 5.9
2021.12.23
- compliance upgrade for the NEW tool "Rectangle position changer"
Download: https://www.mql5.com/en/market/product/75865
VIDEO: https://www.youtube.com/watch?v=IYW1dgOWwRg
バージョン 5.8
2021.12.06
- bug fix for input variable "TF visibility for newly created rectangle & trendline" when rectangle is created with click on color button
バージョン 5.7
2021.11.28
- Color button rectangle creation improved, after extended color will stay the same
バージョン 5.6
2021.11.27
- bug fix for creating rectangles with color buttons when market is closed
バージョン 5.5
2021.11.27
- CPU usage reduced that will allow more charts with TBTA in MetaTrader terminal
バージョン 5.4
2021.11.16
- bug fix for non extended rectangle Risk Reward tool
- bug fix when rectangle name is changed and Split function is ON
- CPU performance improvement when using TBTA on multiple charts
バージョン 5.3
2021.11.01
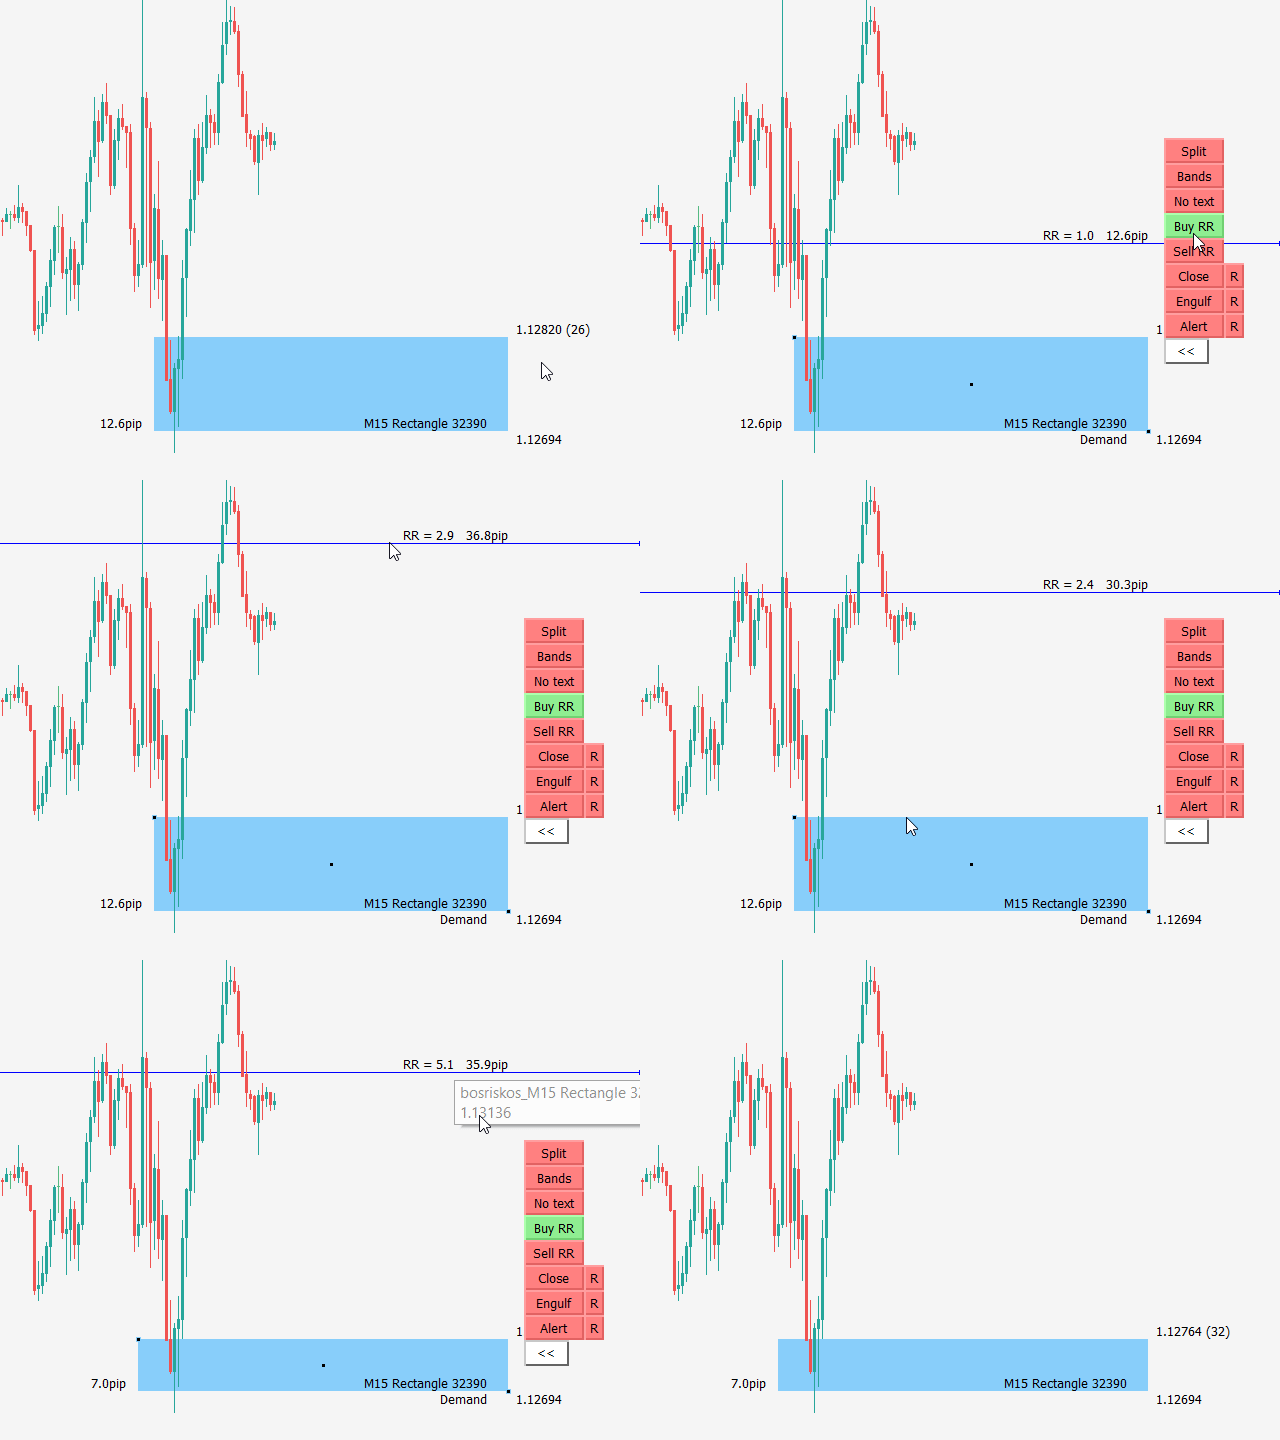
- risk reward tool for non-extended rectangles
- adding more texts positions (object names) to rectangle and trendline. With button "X" you remove current text
- if no object is selected then color buttons will create a new rectangle, otherwise the selected object color will be changed
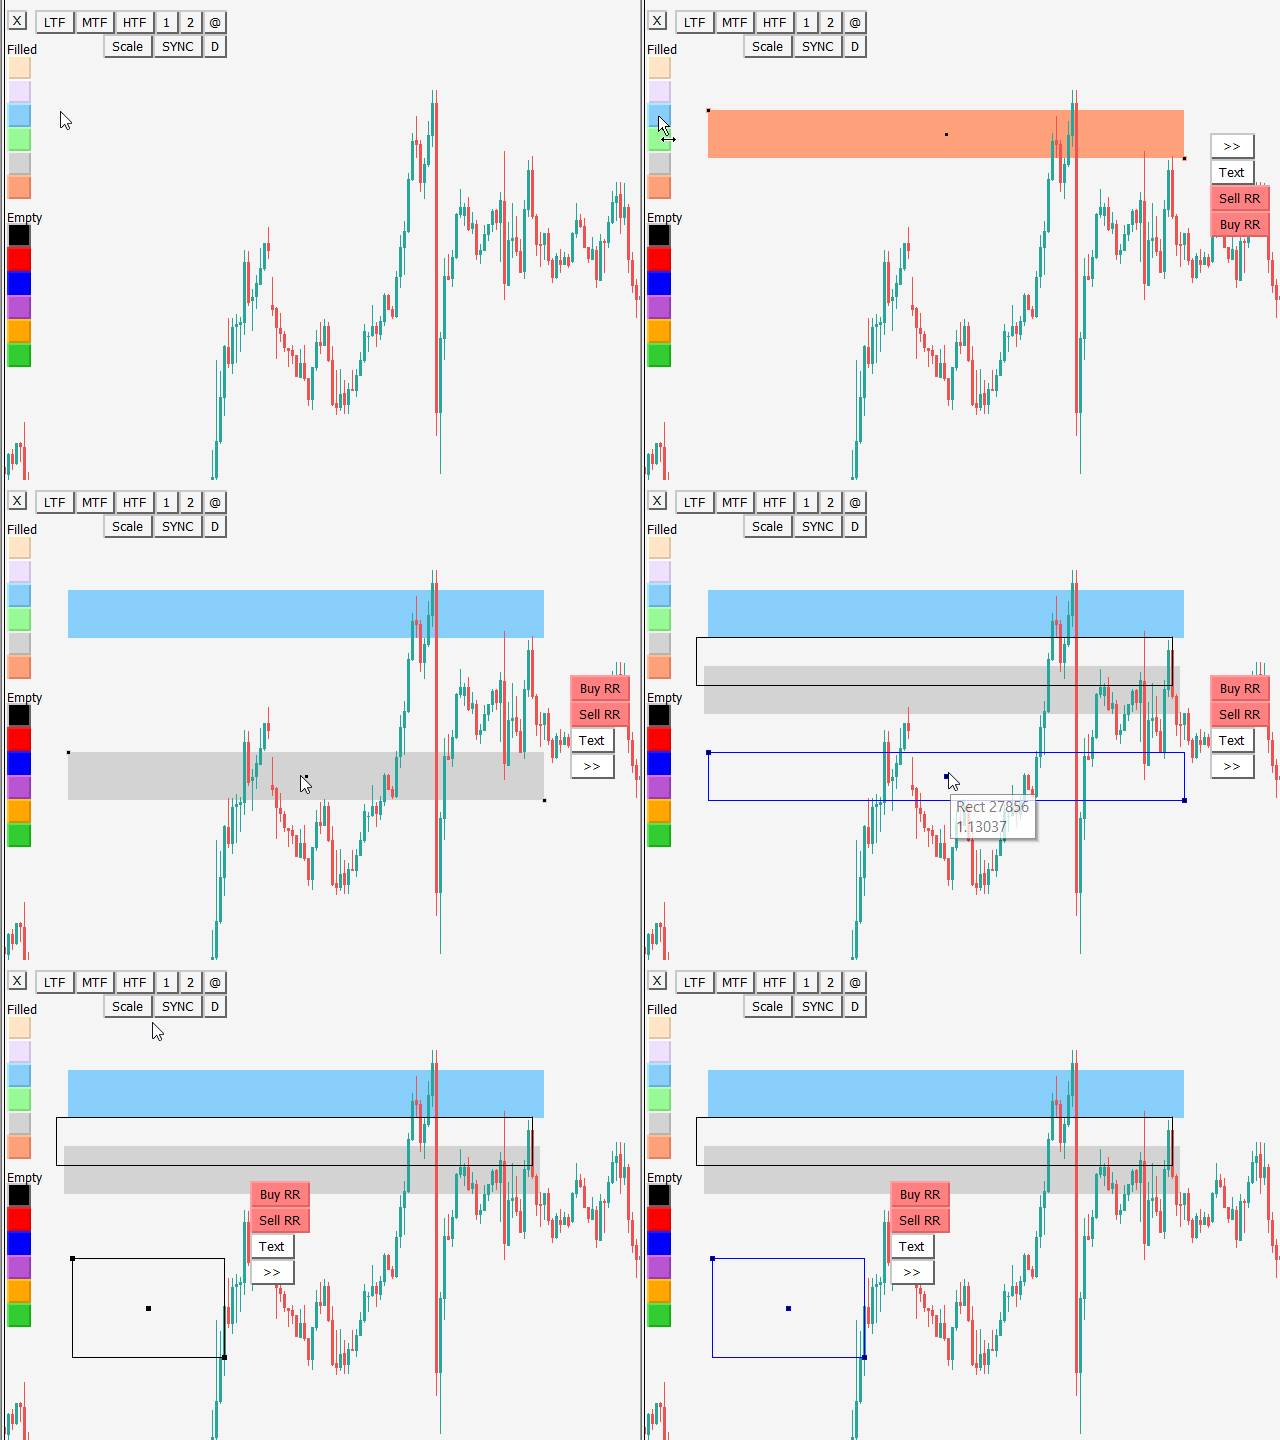
- NEW "Split" button added that will split extended rectangle with alert trendline (default 50% rectangle size)
- NEW input "Default rectangle split % (0-100)"
- NEW input "Split line color"
- NEW input "Split line style"
バージョン 5.2
2021.10.22
- selecting object bug fixed
バージョン 5.1
2021.10.07
- upgrade for link with new BACK button on Dashboard tool
バージョン 5.0
2021.10.07
- NEW "D" button is added that will show chart with "Technical analysis Dashboard" tool
FREE Dashboard: https://www.mql5.com/en/market/product/72876
VIDEO: https://www.youtube.com/watch?v=qzC9jpNshw4
バージョン 4.8
2021.08.29
- SYNC button will copy Bands function (if enabled) from Master to Slave rectangle
- SYNC function in combination with LTF, MTF, HTF buttons will copy timeframe visibility from Master to Slave object when LTF, MTF, HTF button will be assigned to Master object
- bug fix for SYNC function with combination of input "Visibility for current and lower timeframes"
バージョン 4.7
2021.08.22
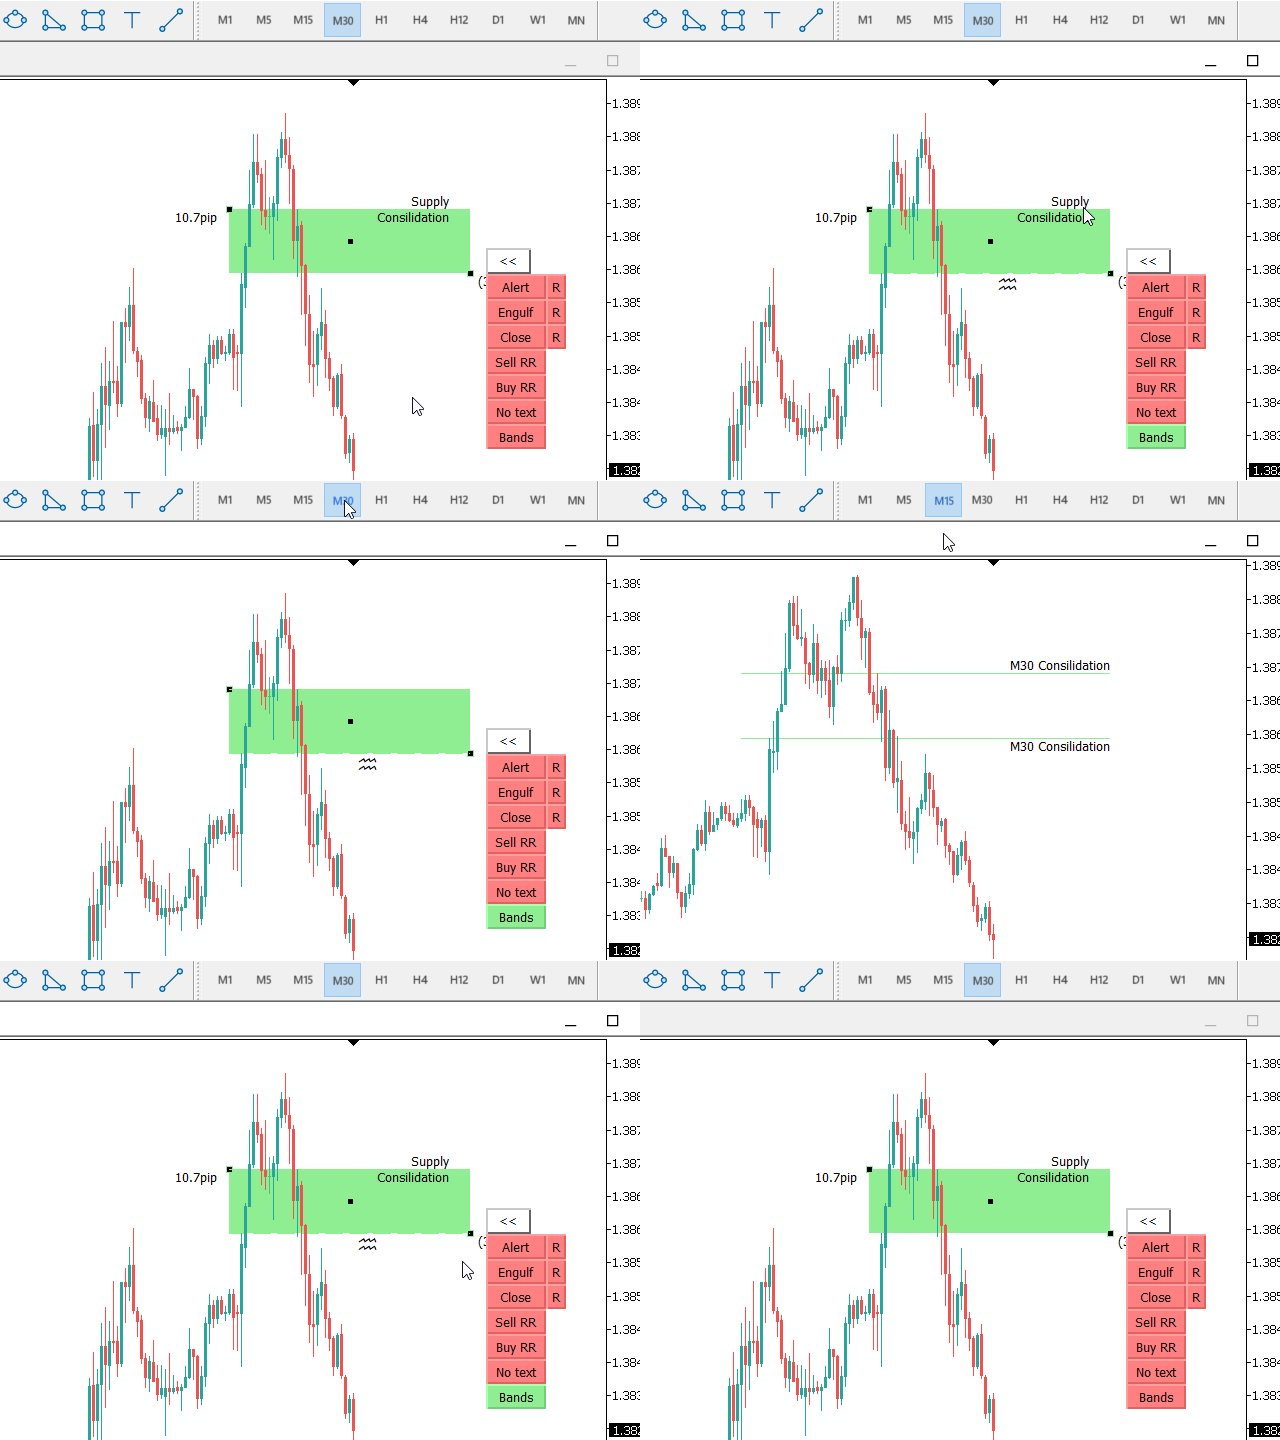
- NEW "Bands" button will create top and bottom rectangle lines visible on all TF but filled rectangle will be visible only on current TF. This will help you to see HTF levels on lower timeframes.
Rectangle top and bottom lines will be dashed for higher timeframes and solid for lower timerames.
When you disable "Bands" button it will restore rectangle TF visibility.
- NEW "Scale" button that will switch chart to "Fixed scale mode" that gives you option to move freely around the chart vertical and horizontal. It also gives you opportunity to get feeling for price movements
VIDEO: https://www.youtube.com/watch?v=OwfjWmBzPG8
バージョン 4.6
2021.08.01
- improved performance between Trading box tools (Order management, Technical analysis, Rectangle extender, Order box Dashboard)
バージョン 4.5
2021.08.01
- bug fix for "X" button display when TBTA is loaded on new chart
- extended rectangle and trendline buttons display correction for high resolution displays
バージョン 4.3
2021.07.31
- bug fix for chart clean up after indicator is removed
バージョン 4.2
2021.07.29
- removed input variable "Set larger button text"
- NEW input variable "Button font size"
- NEW input variable "Button size scale
- NEW input "TF visibility for newly created rectangle & trendline"
1. No automatic timeframe visibility
2. Visibility for current and lower timeframes
- SYNC button bug solved: Timeframe visibility was not copied from Master to Slave at object creation
バージョン 4.1
2021.07.20
- NEW input variable "Show pip distance in brackets"
- button click lagging solved
バージョン 4.0
2021.07.17
- bug fix when Trading box Order management and Technical analysis are used on the same chart
バージョン 3.9
2021.07.10
- NEW input variable "Extended trendline width"
- NEW input variable "Compression line width"
- NEW input variable "Ray trendline width"
バージョン 3.8
2021.07.07
- larger color and line width buttons when input variable "Set larger button text" is set to TRUE
バージョン 3.7
2021.07.06
- NEW input variable "Set larger button text" that will create a little bigger buttons and font size +2
- NEW input variable "Flat trendline width"
- NEW input variable "Line width button 1"
- NEW input variable "Line width button 2"
バージョン 3.5
2021.06.20
- NEW input variable "Bring Alerted chart to the top"
- NEW input variable "Extend new created rectangle"
- NEW input variable "Extend new created trendline"
バージョン 3.4
2021.05.25
- bug fix for button display
バージョン 3.3
2021.05.16
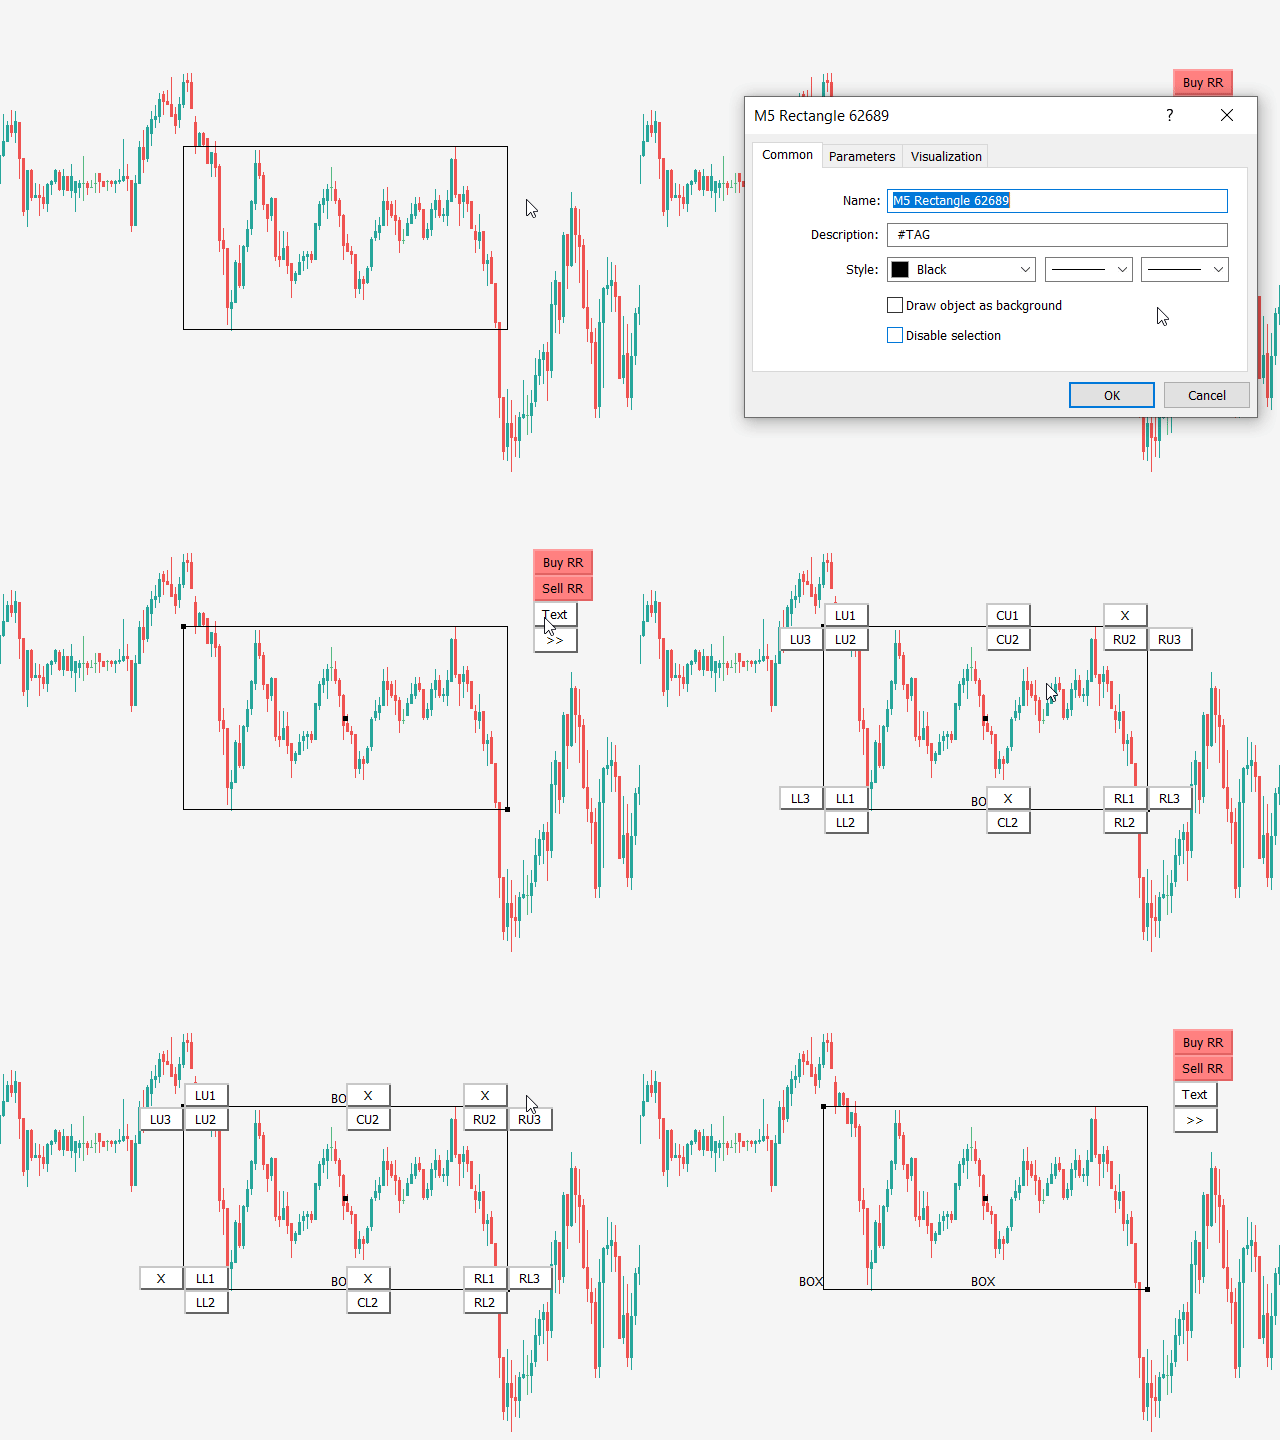
- NEW "Text" button that gives options to display rectangle or trendline text in all possible spots around or inside object. This works for non-extended rectangles and trendlines where we would like to have object name displayed in suitable place around or inside object. This is custom show object name function.
- NEW "SYNC" button (sync chart object or chart sync object) function for selected rectangle, trendline and horizontal line object chart synchronization on the same symbol (charts synchronizer, object sync)
The selected master object is copied to other charts of the same symbol.
Object position location and color style is updated from master to slave object and vice versa.
When you delete master object then slave objects will be deleted and NOT vice versa.
If you rename master object then you broke connection with slave objects. If you rename slave object then is no longer synced with master object.
"SYNC" button can also remove synchronization from selected master or slave object.
- NEW input "Show extra color buttons" that will display 6 "Filled" color and 6 "Empty" color buttons
- Bug fix: if you click on tickness buton "1" or "2", it will change object from filled to unfilled
- Safety check warning for too many objects on chart (performance issues) + warning for incompatible indicators
UPGRADE VIDEO: https://www.youtube.com/watch?v=asGmONlI4EY
バージョン 3.2
2021.03.27
- better sync with Trading box Order management v3.0 objects
バージョン 3.1
2021.03.01
New input variables added and used when you extend rectangle or trendline:
- Alert enabled by default
- Engulf enabled by default
- Close enabled by default
- No text enabled by default
バージョン 2.9
2021.02.17
- bug fix reported by users
バージョン 2.8
2021.02.04
- bug fix for full zoom chart label positions
バージョン 2.7
2021.02.01
- input variables description added
- new input variables:
- Selected object buttons position
- Rectangle pip size position
バージョン 2.6
2021.01.16
- switching between timeframes bug solved
バージョン 2.5
2020.12.27
Important MAJOR performance upgrade and bug fix:
- CPU load problems solved (better chart and object refresh logic)
- Ignoring Trading box Order management objects
- All user bug reports solved
- Works better with other indicators
バージョン 2.4
2020.12.09
MAJOR UPGRADE:
- added email alert option
- added 3 new variables to manage alerts and notifications (send_mobile_push_notification, send_email_alert, show_popup_alert)
- optimized chart refresh rate that will reduce CPU load from 30% up to 500%
- minor bugs solved and added some additional safe checkups for drawing rectangles and trendlines
バージョン 2.3
2020.11.06
- minor bug fix for >> button when used on rectangle
バージョン 2.2
2020.11.02
- another bug solved when clicking << button
バージョン 2.1
2020.11.02
- bug fix for << button and when rename trendline
バージョン 2.0
2020.10.30
- added new input variable extend_if_auto_scroll_off that will give you option to have fixed extended object size if you have auto scroll option diabled
バージョン 1.9
2020.10.29
- minor bug fixed when Auto scroll is OFF. Objects are extended to the right side of the chart
バージョン 1.8
2020.10.14
- bug fix for Close button, when used on chart with no previusly loaded data on new switched timeframe
バージョン 1.7
2020.10.04
- minor bug fix for alert arrows timeframe visibility
バージョン 1.6
2020.10.03
- minor bug fix for @ button when search for trendline origin history
バージョン 1.5
2020.09.27
MAJOR upgrade
- new Flat button for trendline (creates horizontal flat trendline)
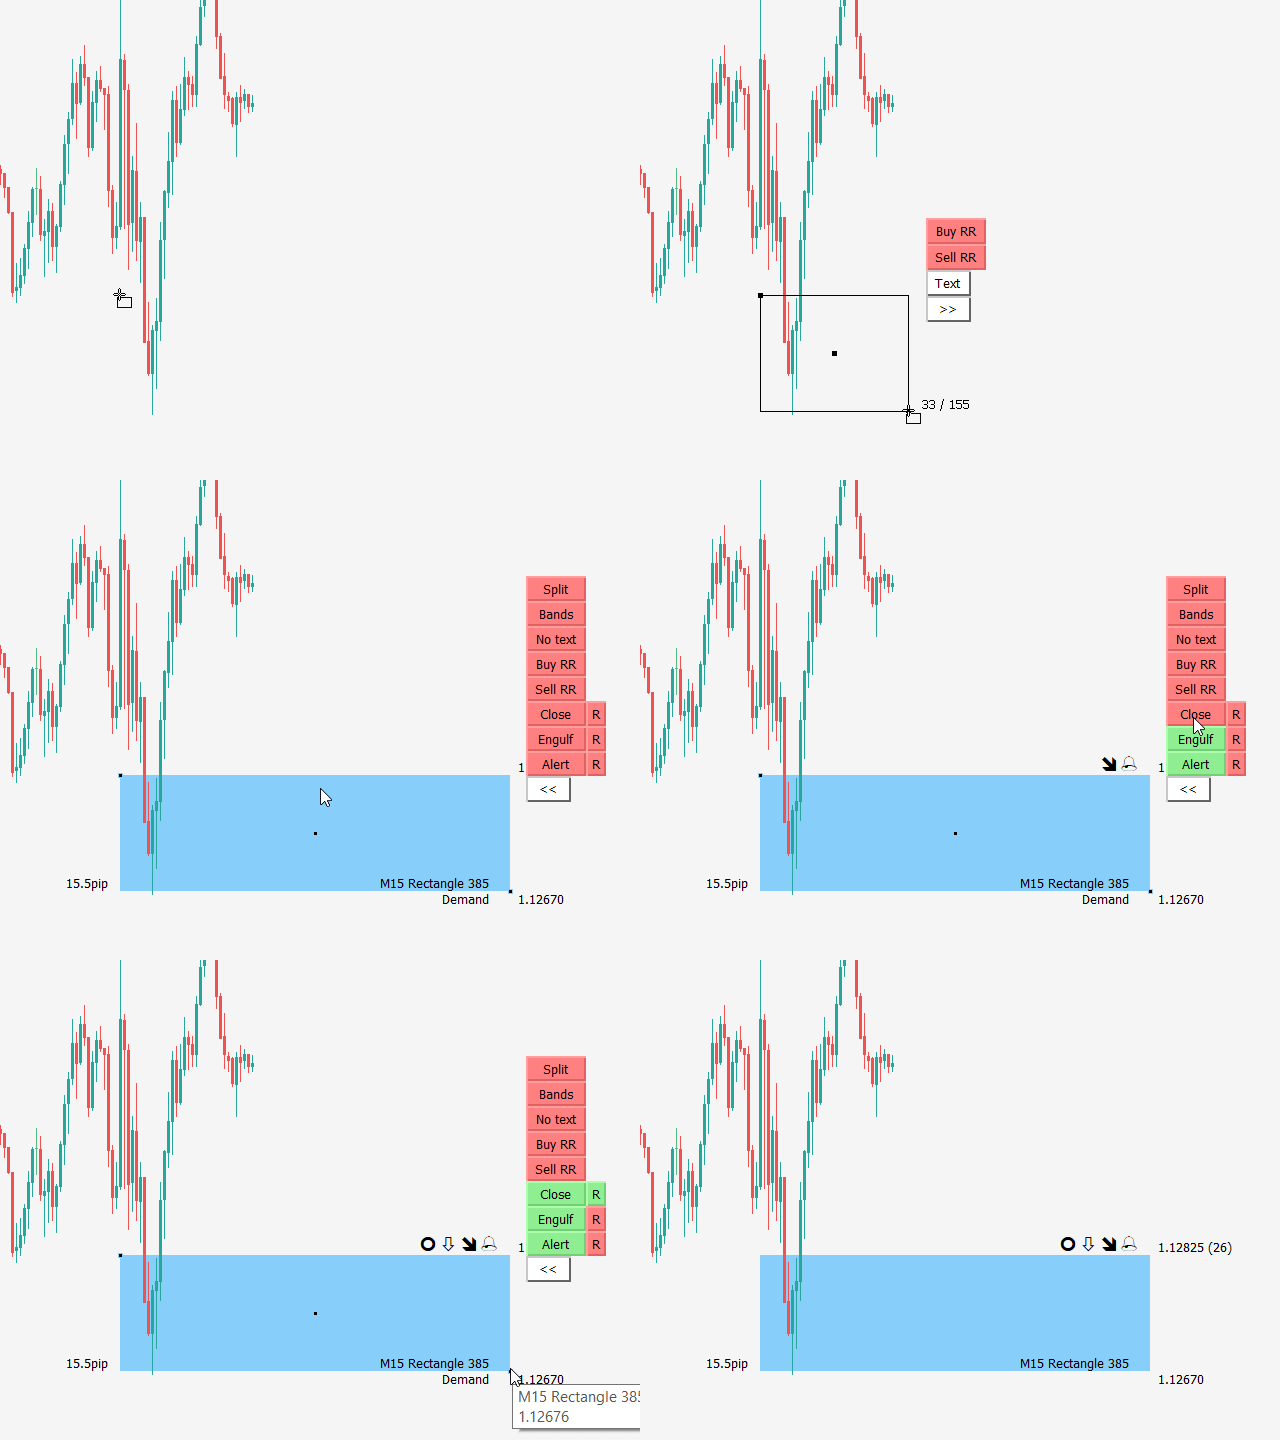
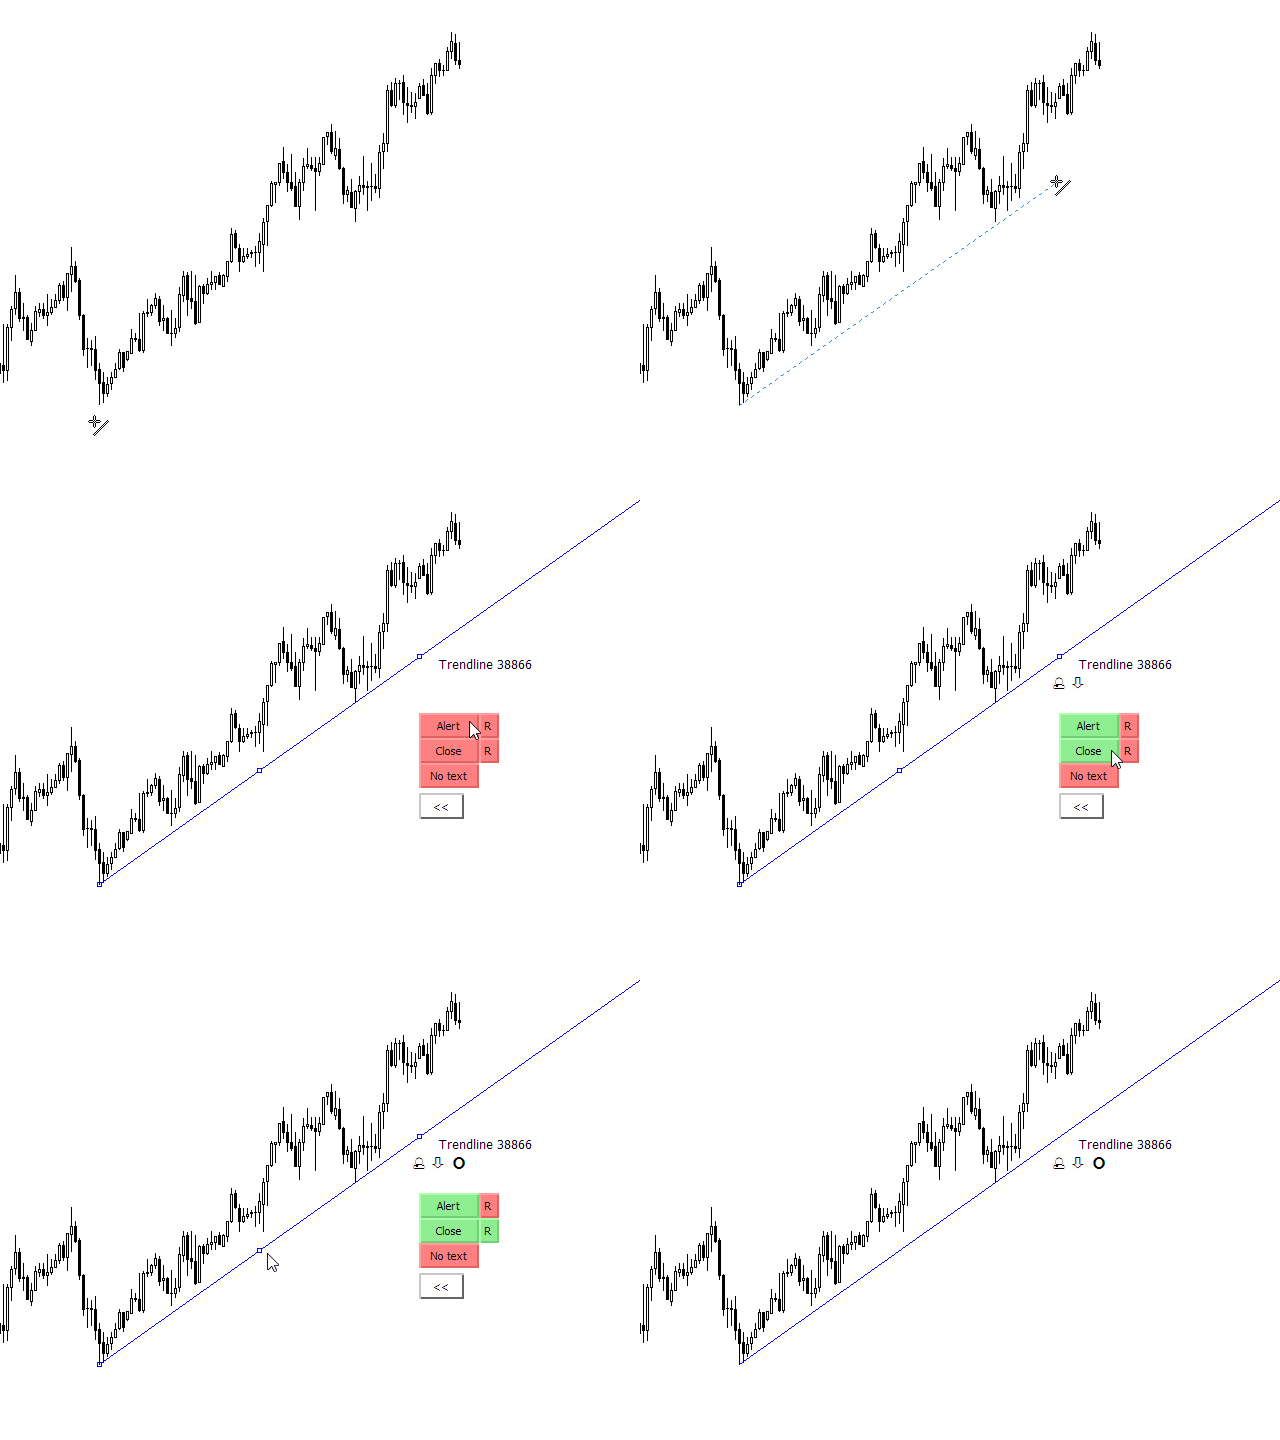
- new Close button for rectangle, trendline and ray (alert when current candle closes beyond object price)
- new R button to enable you repeat alert sound every few seconds (you can set repeat interval in seconds with sound_repeat_seconds_interval)
- new input parameters for sound repeat alerts for supply, demand, resistance and support (The file must be located in terminal_directory\Sounds. Only WAV files are played)
- when you click on extended rectangle it shows you Demand or Supply type of rectangle
- if you extend rectangle around price then you have option to decide if this rectangle is supply or demand
バージョン 1.4
2020.09.07
- minor preformance upgrades
バージョン 1.3
2020.08.12
- new input parameter button_position is added for placing buttons in different corner positions
バージョン 1.2
2020.08.08
- button fix for Demand extended rectangle
バージョン 1.1
2020.08.04
- Rectangle and trendline function buttons are now aligned on right side of charts, so they not overlay with other trendlines and rectangles
- Button positions corrections

































Best thing since slice bread! I never really liked the idea of using both Trading View and MT4 to trade. Thanks to this indicator I can finally ditch Trading View. Huge thanks!