Heiken Ashi Signal Mt4
- 指标
- Ruslan Latypov
- 版本: 2.0
- 激活: 10
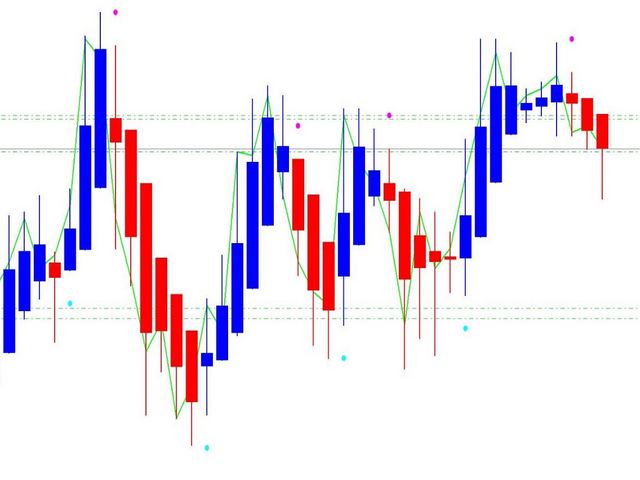
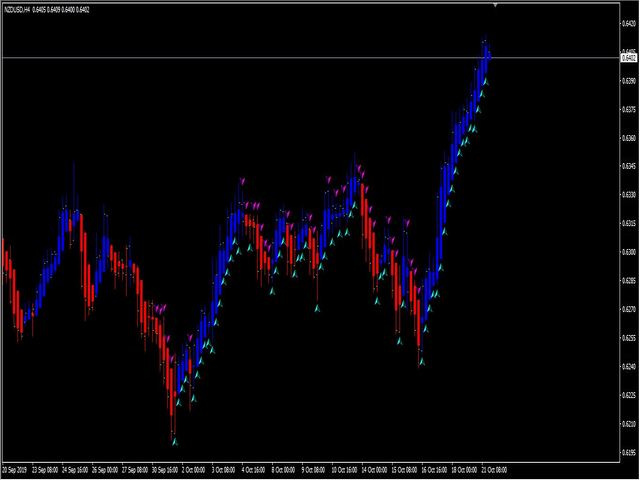
Heiken Ashi信号指标是为MT4交易终端设计的。
它是基于标准的Heiken Ashi指标,该指标在Mt4终端中可用。
该指标可以作为手动操作,也可以通过作者的专家顾问系统用于自动交易。
要在交易EA中使用Heiken Ashi信号指标,有信号缓冲区,用于入市和打开买入和卖出头寸。阅读下面的更多内容。
平安证券信号指标的特点和特征。
适用于任何图表周期:(M1,M15,M30,H1,H4,D1,W1,MN)。
可以应用于任何资产:(货币对、金属、股票、指数、加密货币)。
可以在专家顾问的策略中使用,把信号作为进入市场的基础。
在趋势开始时对价格反转作出反应,并无滞后地给出信号。
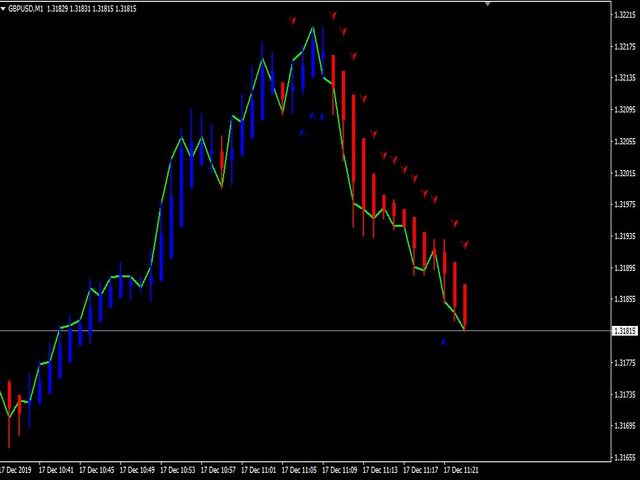
如果一个信号已经出现,它已经被固定下来,不会从图表中消失。
该指标不会在相邻的柱子上重新画出信号,也不会在柱子上上下移动。
你可以下载演示版,在购买前用任何设置测试该指标的工作。
如果你想在实时图表上使用该指标,你可以暂时租用它。
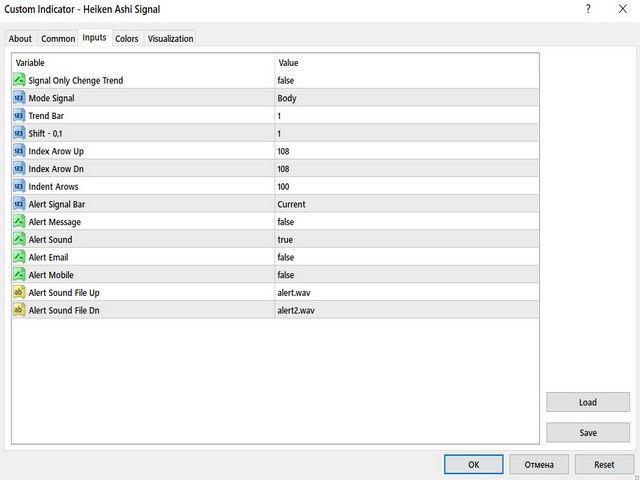
海肯阿斯信号指标设置。
//+------------------------------------------------------------------+
只有信号的Chenge趋势=真;(在趋势开始时的一个信号=真,每个条形上的信号=假)
模式信号=主体/阴影;(信号的蜡烛类型:蜡烛主体=主体,蜡烛阴影=阴影)。
趋势条=1;(对条形的趋势分析)。
Shift = 1; (信号在棒上的移动)
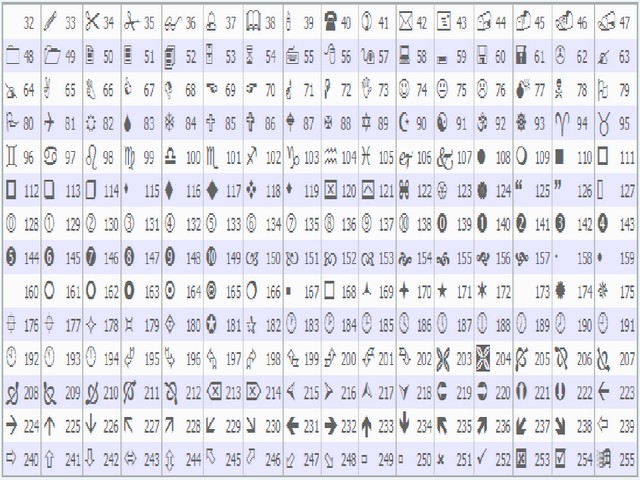
指数Arow Up = 108; (买入信号符号的代码)
指数Arow Dn = 108; (卖出信号符号的代码)。
缩进箭头 = 100; (信号的距离)
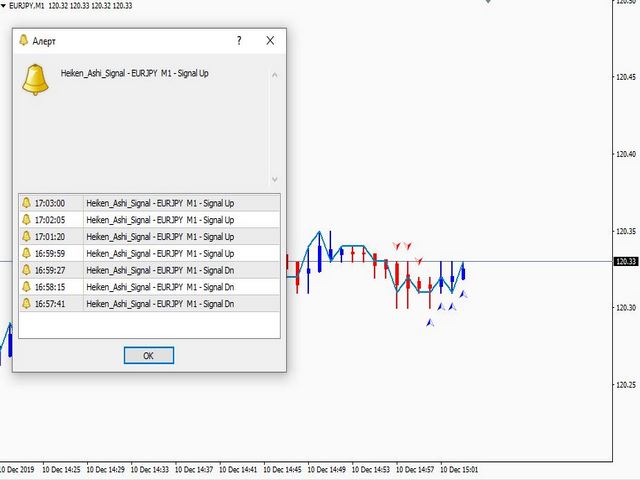
警报信号Bar = Tick/Current/Close;(在条形上发出声音:每一个tick,当前时间框架,在条形收盘时)。
警报信息 = false; (图表上的信号信息与窗口)
警报声=假;信号活动(买入和卖出的声音警报)。
警报电子邮件 = false; 警报到电子邮件(向电子邮件发送信号)。
Alert Mobile = false; 向手机发出警报(推送通知)。
警报声音文件Up = "alert.wav"; (购买的声音文件的名称)
警报声音文件 Dn = "alert2.wav"; (销售用声音文件的名称)。
//+------------------------------------------------------------------+
在专家顾问系统中调用该指标作为信号资源的例子。
//+------------------------------------------------------------------+
#resource "\\Indicators\Heiken Ashi Signal.ex4"
//---
enum enuma
{
sh, // 阴影
bd //身体
};
//---
输入字符串 Seting_Indicator = "------设置指标----"; //
外部 bool SigOnlyChengeTr1 = true; // 只有信号的Chenge趋势
外部enuma VarSig = bd; // 模式信号
输入uint shift = 1; // 在条形图上发出移位信号
//--
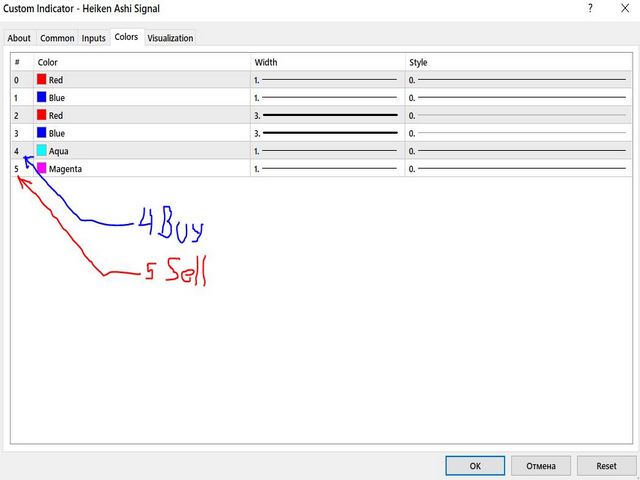
double upInd=iCustom(_Symbol,PERIOD_CURRENT,"::Indicators\Heiken Ashi Signal",SigOnlyChengeTr1,VarSig,4,shift) 。
double dnInd=iCustom(_Symbol,PERIOD_CURRENT,"::Indicators\Heiken Ashi Signal",SigOnlyChengeTr1,VarSig,5,shift) 。
//+------------------------------------------------------------------+
关于在实践和交易中使用该指标的建议。
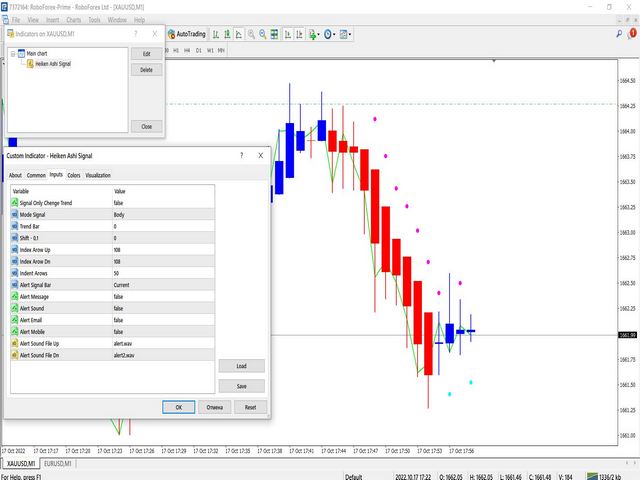
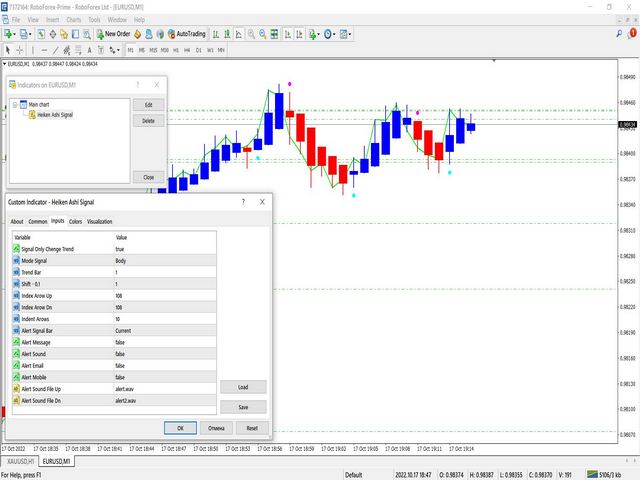
Heiken Ashi信号指标可用于二元期权交易和一分钟交易时段的剥头皮。它也可以在较高时期的趋势中使用。
Great Indicator, but please on what basis does the Sell and Buy dots happen. It will be preferable to be flat tops and flat bottoms which are some of the most powerful Heiken Ashi signals and not the wicky candles. Also why cant you see historical candles. No videos or clear explanation of how the Indicator works so its difficult to assess.