Heiken Ashi Signal Mt4
- 지표
- Ruslan Latypov
- 버전: 2.0
- 활성화: 10
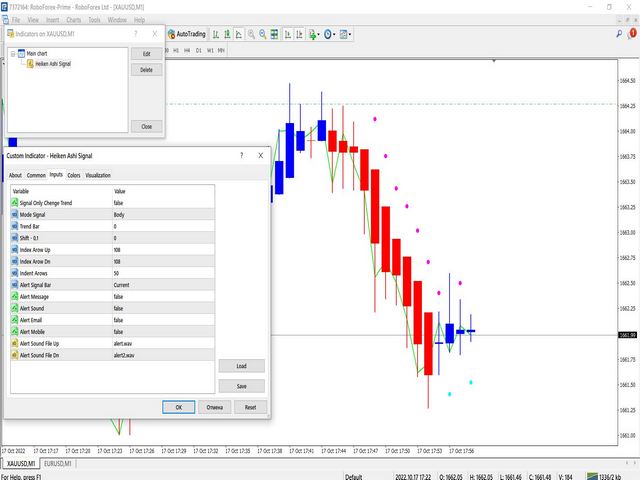
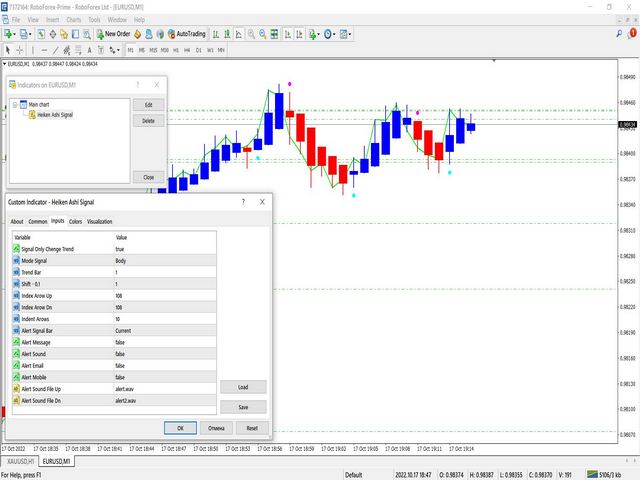
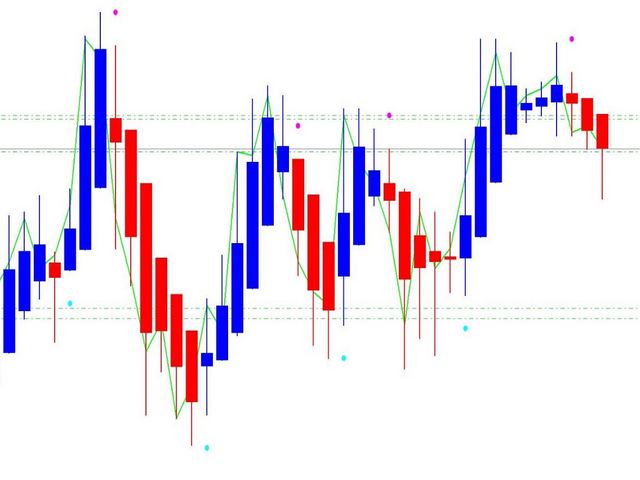
Heiken Ashi 신호 표시기는 MT4 거래 터미널을 위해 설계되었습니다.
표준 Heiken Ashi 표시기는 MT4 터미널을 기반으로합니다.
이 표시기는 매뉴얼 및 저작권 고문의 자동 거래에 사용할 수 있습니다.
Heiken Ashi 신호 표시기를 사용하려면 거래 전문가에게는 시장에 진입하고 구매 및 판매 위치를 열기위한 신호 버퍼가 있습니다.
아래에 대해 자세히 읽어보십시오.
Heiken Ashi 신호 지표의 기회와 특성 :
(M1, M15, M30, H1, H4, D1, W1, MN).
(통화 쌍, 금속, 주식, 지수, 암호 화폐).
시장에 진입하기위한 기초로 신호를 받고 전략에 대한 고문에 신청하십시오.
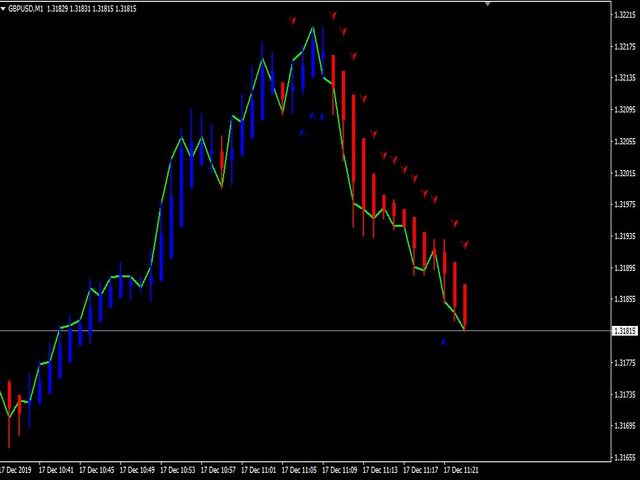
시간이 지남에 따라 그는 추세가 시작될 때 가격의 전환에 반응하고 지연없이 신호를 제공합니다.
신호가 나타나면 이미 고정되어 있으며 일정에서 사라지지 않습니다.
표시기는 인근 막대에서 신호를 다시 그리지하지 않으며 막대에서 위아래로 이동하지 않습니다.
구매하기 전에 데모 버전을 다운로드하고 모든 설정으로 표시기를 확인할 수 있습니다.
라이브 일정에 따라 지표로 작업하려면 여전히 임대 할 수 있습니다.
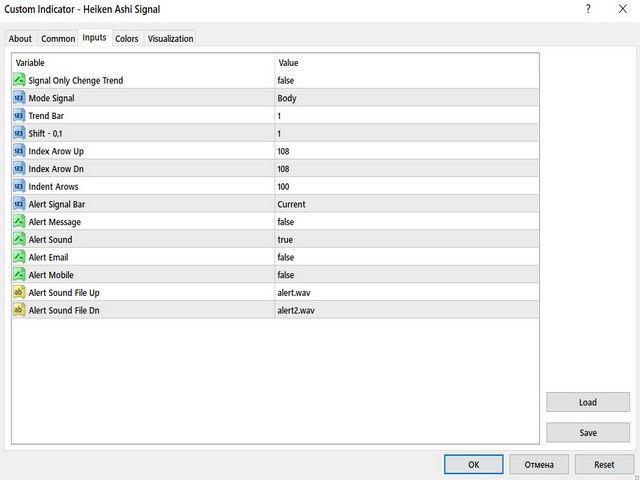
Heiken Ashi 신호 표시기 설정 :
//+--------------------------------------------------- ----------+
신호 전용 Chenge Trend = True; (추세의 시작시 1 개의 신호 = true, 각 막대의 신호 = false)
모드 신호 = 바디/그림자; (신호를위한 양초 유형 : 촛불 바디 = 몸, 그림자의 그늘 = 그림자)
추세 바 = 1; (막대 추세 분석)
시프트 = 1; (막대에서 신호 이동)
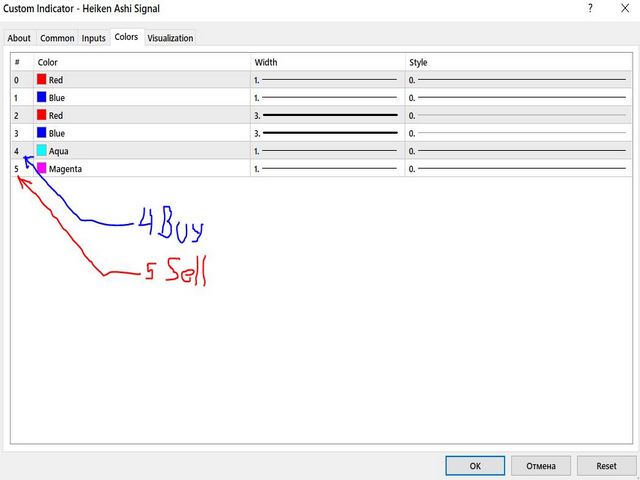
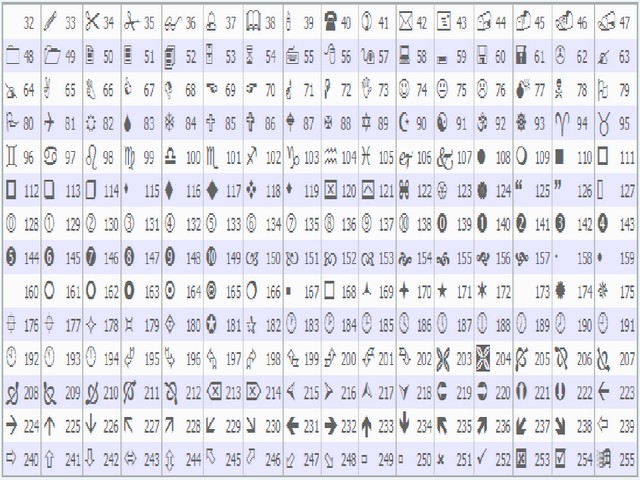
색인 arow up = 108; (신호 신호 코드)
색인 AROW DN = 108; (판매 신호 신호 코드)
들여 쓰기 arows = 100; (신호 거리 거리)
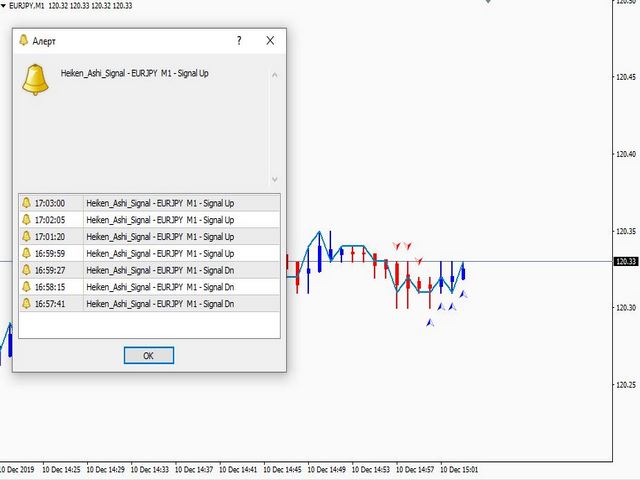
경고 신호 바 = 진드기/현재/닫기; (막대의 사운드 신호 : 막대를 닫아 각 진드기, 현재 시간)
경고 메시지 = false; 그래프에 알림 (그래프의 창의 출력이있는 신호에 대한 메시지)
경고 소리 = false; 사운드 경보 (사운드 구매 및 판매 신호)
경고 이메일 = false; 이메일 알림 (이메일로 신호 전송)
Alert Mobile = False; 전화의 경고 (푸시 알림)
Alert Sound File UP = "Alert.Wav"; (구매에 대한 사운드 파일의 이름)
경고 사운드 파일 dn = "alert2.wav"; (판매용 사운드 파일 이름)
//+--------------------------------------------------- ----------+
어드바이저에서 신호를 받기위한 리소스로서 표시기 호출의 예 :
//+--------------------------------------------------- ----------+
#Resource "\\ 표시기 \\ Heiken Ashi Signal.ex4"
// ---
열거적 인 Enuma
{
sh, // 그림자
BD // 바디
};
// ---
입력 문자열 seting_indicator = "--- seting indicator ---"; //
extern bool sigonlychengetr1 = true; // 신호 전용 Chenge 트렌드
Extern Enuma varsig = bd; // 모드 신호
입력 uint shift = 1; // 막대의 이동 신호
//-
double upind = icubol (_symbol, period_current, ":: 표시기 \\ heiken ashi 신호", sigonlychengetr1, varsig, 4, shift);
double dnind = icustom (_symbol, period_current, ":: 표시기 \\ heiken ashi 신호", Sigonlychengetr1, varsig, 5, shift);
//+--------------------------------------------------- ----------+
실제로 및 거래에 지표 적용을위한 권장 사항 :
Heiken Ashi 신호 표시기는 바이너리 옵션 거래 및 분량 거래 기간 동안 두피를하는 데 사용할 수 있습니다.
또한 오래된 기간에 트렌드에 사용할 수 있습니다.
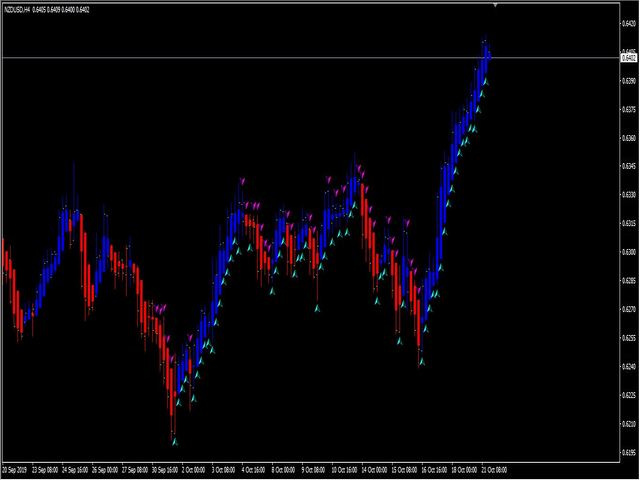
Great Indicator, but please on what basis does the Sell and Buy dots happen. It will be preferable to be flat tops and flat bottoms which are some of the most powerful Heiken Ashi signals and not the wicky candles. Also why cant you see historical candles. No videos or clear explanation of how the Indicator works so its difficult to assess.