KT Psar Arrows MT5
- 指标
- KEENBASE SOFTWARE SOLUTIONS
- 版本: 2.1
- 更新: 25 三月 2022
- 激活: 5
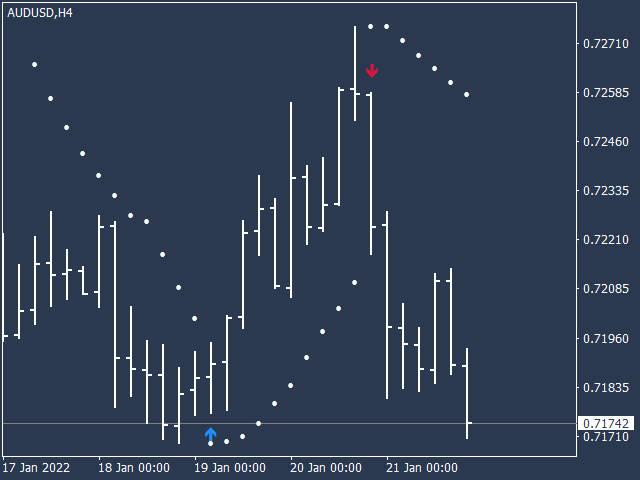
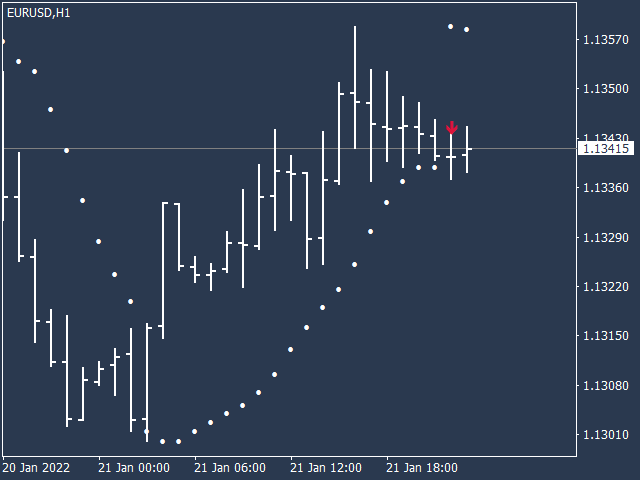
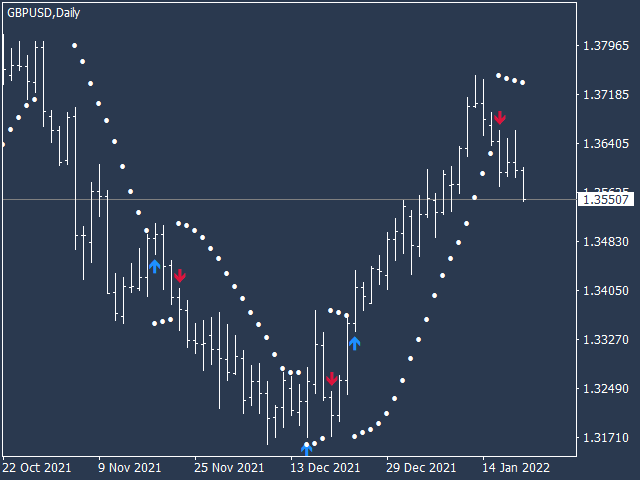
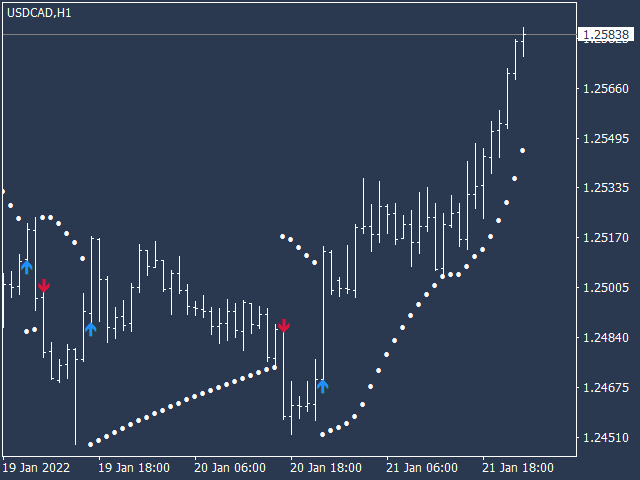
KT Psar Arrows plots the arrows on chart using the standard Parabolic SAR indicator. A bullish arrow is plotted when the candle's high touch the SAR. A bearish arrow is plotted when the candle's low touch the SAR. The signals are generated in the real-time without waiting for the bar close.
Features
- A beneficial tool for traders who want to experiment with the trading strategies that include the use of Parabolic Sar indicator.
- Can be used to find turning points in the market.
- Use custom PSAR inputs.
- All MT4 alerts are available.
A Word of Caution: The Parabolic SAR is a lagging and strict mechanical indicator. Every potential trade should be filtered by well-defined rules.
Input Parameters
- PSAR Step: Insert the step value.
- PSAR Maximum: Insert the maximum value.
- Rest of the inputs are self-explanatory.
EA Developers
//----- define Arrays
double buy_signal[], sell_signal[];

//----- define indicator handle
int psar_arrow_handle= iCustom(Symbol(),0,"Market/KT PSAR Arrows");

//----- Copying buffer into arrays
CopyBuffer(psar_arrow_handle,0,1,1,buy_signal);
CopyBuffer(psar_arrow_handle,1,1,1,sell_signal);

//----- for new entries
if(buy_signal[0]!=0) //----- Open Buy Trade
if(sell_signal[0]!=0) //----- Open Sell Trade


This is my second KT indicator purchase, and its a good'un. I tried coding an indicator that alerts when the Parabolic SAR switches, for better timed entries. It crashed my MT5, so I bought this. Very easy to use, does exactly what you would want / expect. I wish I could change the colour of the dots and position of the arrow, but generally is great. Thx, would recommend.