KT Momentum Arrows MT5
- 指标
- KEENBASE SOFTWARE SOLUTIONS
- 版本: 3.0
- 更新: 19 七月 2022
- 激活: 10
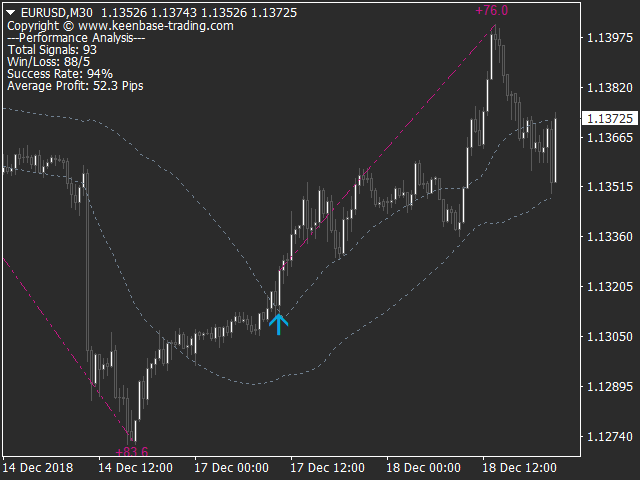
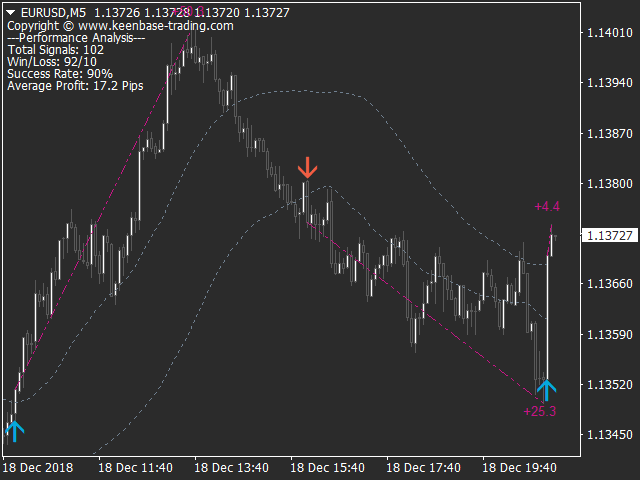
KT Momentum Arrows 指标基于瞬时突破计算,它结合了价格波动方向中的带宽偏离和新兴波动率。这是一种对动量变化反应灵敏的技术指标,适合在趋势开始阶段发出交易信号。
当价格收于上轨之上时,生成买入信号;当价格收于下轨之下时,生成卖出信号。
该指标使用一个“幅度系数”作为输入参数,同时影响带宽偏离和波动率计算。建议根据不同品种和时间周期仔细选择和优化该系数值以获得最佳效果。
主要特点
- 信号不重绘!
- 非常适合动量交易者的进场工具。
- 性能分析功能:胜率、盈亏比、平均收益等数据可视化展示。
- 适用于日内交易者、波段交易者和剥头皮交易者。
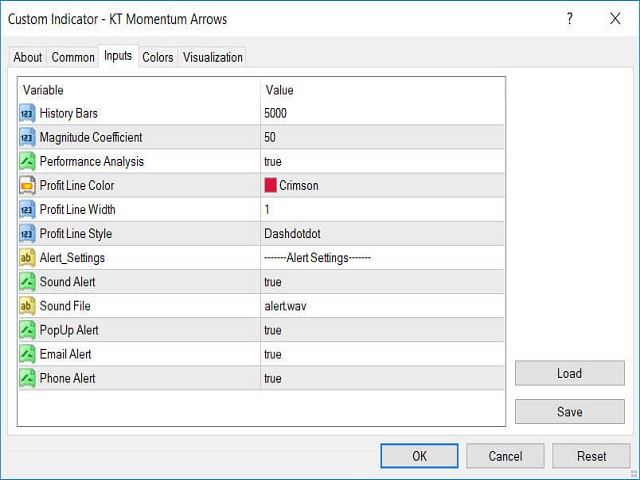
输入参数
- 历史K线数量: 用于指标计算的K线数量。
- 幅度系数: 用于调节带宽偏离和波动率的单一系数。
- 性能分析: 显示或隐藏性能分析,包括利润趋势线。
- 提醒设置: 支持弹窗、邮件、推送和声音提醒。
- 其余参数无需额外解释,简单明了。


Best indicator I've ever bought.
Also, the author is very involved.