Strategy Builder
- 指标
- Pavel Shutovskiy
- 版本: 3.5
- 更新: 27 五月 2020
- 激活: 20
Strategy Builder
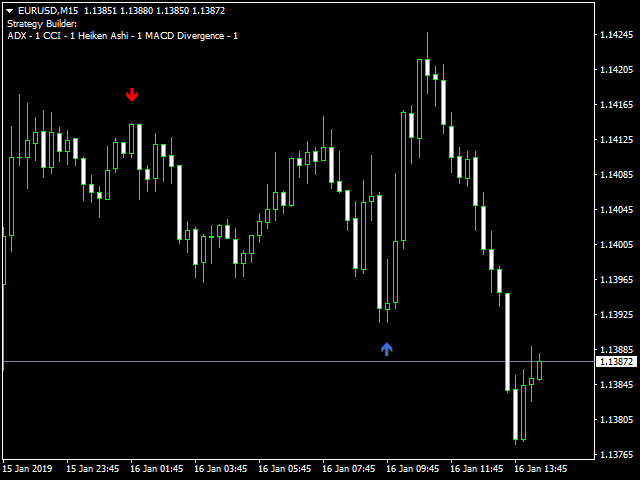
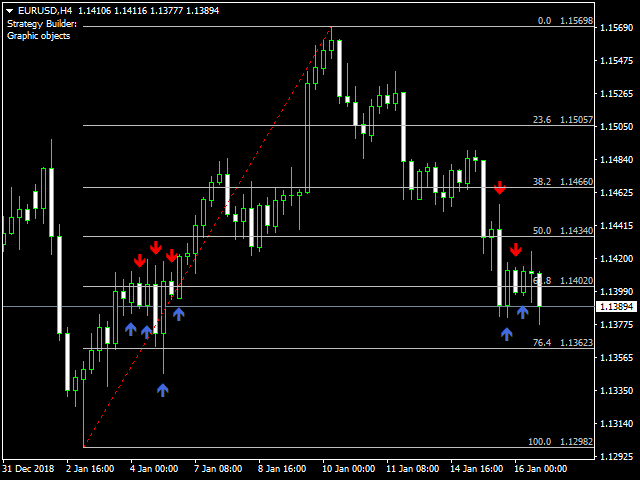
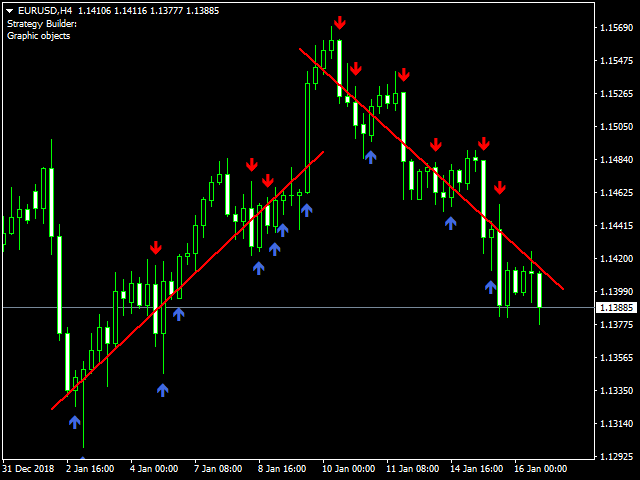
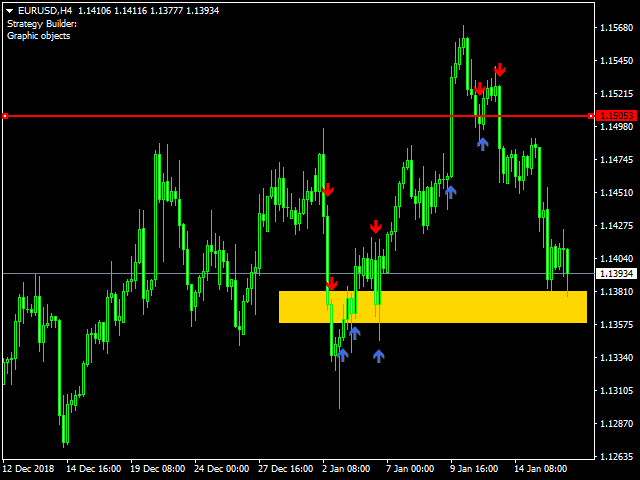
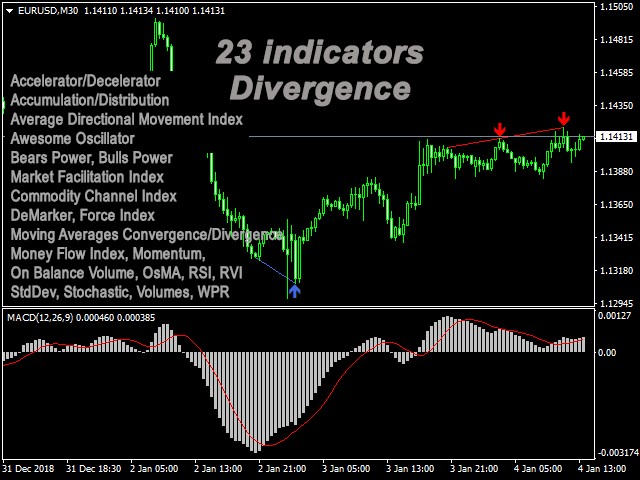
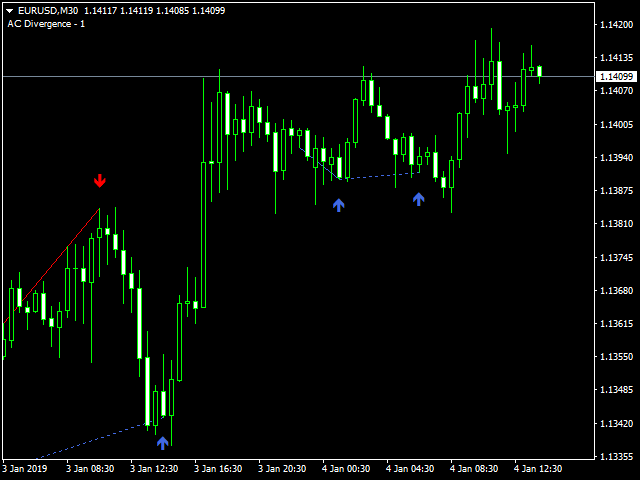
策略生成器指标允许您创建经典和个人策略,而无需使用大量指标加载图表,也无需跟踪许多不同的指标来识别真实信号。 Strategy Builder在30个标准指标上以箭头的形式显示信号,23个指标显示经典和隐藏分歧,接收来自斐波那契水平,水平,趋势线和矩形的信号。 借助此指标,您可以通过在设置中选择主要和辅助指标作为过滤器来接收来自一个指标以及来自多个指标的信号。
指标是重复的,因此可以获得读数,例如来自不同时间帧的RSI,可以在13指标上越过线(交叉)时接收信号。
指标:
- AC - Accelerator/Decelerator + Divergence
- AD - Accumulation/Distribution + Divergence
- ADX - Average Directional Movement Index + Divergence
- Alligator
- AO - Awesome Oscillator + Divergence
- ATR - Average True Range + Divergence + Crossing
- Bands - Bollinger Bands®
- Bears Power + Divergence
- Bulls Power + Divergence
- BWMFI - Market Facilitation Index - Divergence
- CCI - Commodity Channel Index + Divergence + Crossing
- DeMarker + Divergence + Crossing
- Envelopes + Crossing
- Force Index + Divergence + Crossing
- Fractals
- Gator Divergence
- Heiken Ashi
- Ichimoku - Ichimoku Kinko Hyo
- MA - Moving Average + Crossing
- MACD - Moving Averages Convergence/Divergence + Divergence
- MFI - Money Flow Index + Divergence + Crossing
- Momentum + Divergence + Crossing
- OBV - On Balance Volume + Divergence
- OsMA - Moving Average of Oscillator + Divergence
- RSI - Relative Strength Index + Divergence + Crossing
- RVI - Relative Vigor Index + Divergence + Crossing
- SAR - Parabolic Stop and Reverse system
- StdDev - Standard Deviation + Divergence + Crossing
- Stochastic Oscillator + Divergence + Crossing
- Volumes + Divergence
- WPR - Larry Williams' Percent Range + Divergence + Crossing
- ZigZag
- Graphic objects (horizontal, trend lines, rectangle, Fibonacci levels)
参数:
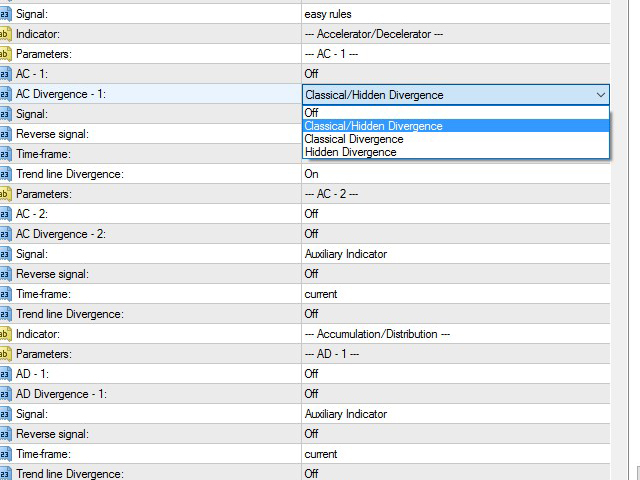
- Notification -启用通知
- Comment -显示有关所包含指标的注释
- Arrow Up - 发出信号的字体字符
- Arrow Down - 向下信号的字体字符
- Bars - 历史中显示指示器信号的柱数
- Reverse - 来自所有指标的反向信号
- Signal - 当使用多个指标时,选择信号形成的方法:严格的规则-当多个指标信号在一个柱上重合时,将形成信号。 简单的规则-信号将根据指标过滤器和主要指标的规则形成
所有参数都在讨论中公布。
在EA中调用指标受iCustom输入参数数量的限制,以接收信号:指标必须在图表上设置,信号接收可以使用GlobalVariableGet函数
EA中接收信号的函数的一个例子:
int IndicatorSignal(){
   if(GlobalVariableGet("Strategy Builder " + _Symbol + " " + (string)_Period) == 1.0) return 0; // sinal UP

   if(GlobalVariableGet("Strategy Builder " + _Symbol + " " + (string)_Period) == 2.0) return 1; // signal DOWN

   return -1;
}












Amazing Service - I was having trouble setting it up and Pavel very quickly sent me 3 different "set" files to load into the indicator and it is doing what it's supposed to do. Definitely worth it.
UPDATE: Having a little concern at the moment since after testing this product much more intently. If you are okay with repainting programs, then this is for you. I am currently using it in the most basic of forms and just wanted to know when the Main Line crosses the Signal Line when above 80% or below 20% for a fast and medium setting in the same time frame. This is a definitive point in time when using a candle closed condition. However, after it shows this, it continues to move the "Suggestion" arrow as the chart "flat lines" and there is not much movement either way, removes the suggested trade arrow if it begins reversing on you, and then also moves the arrow down to the optimal point when it does finally go up in the direction originally shown.
In Conclusion, if you are sitting there at your charts, it typically will provide an alert at the correct time but, unfortunately it tries to make things look prettier than they really are by repainting to the perfect spot. I have put in a request to see if this failing feature of so many programs that can absolutely mess up a strategy can be deleted and based on that, we will look into adjust the star rating.
Dine