• 概述
  • 评论 (20)
  • 评论 (234)
  • 新特性

Moving Average Currency Strength Meter

4.33
(目前 三十% 折扣)


在阅读该指标的描述之前,我只想向您介绍以下概念

移动平均线 - 仅基于一张图表的典型移动平均线。

货币强度线 - 某一货币对的移动平均线,其强度基于 二十八 对。可以说是真正的移动平均线。


移动平均线确实是几乎每个交易者都使用的最受欢迎的指标之一。

货币强度计也是一种基于多种货币的趋势指标。


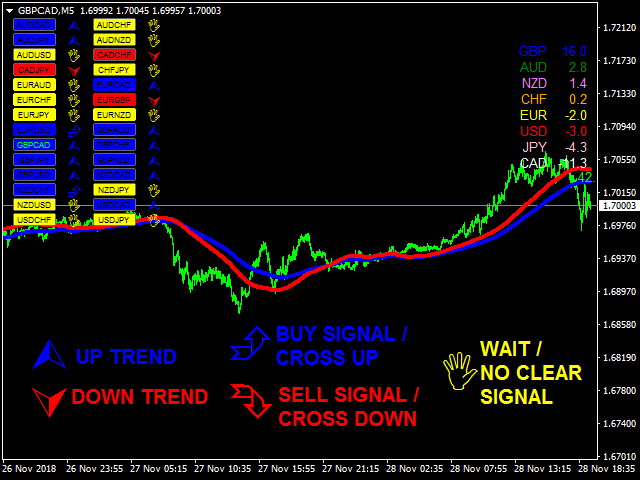
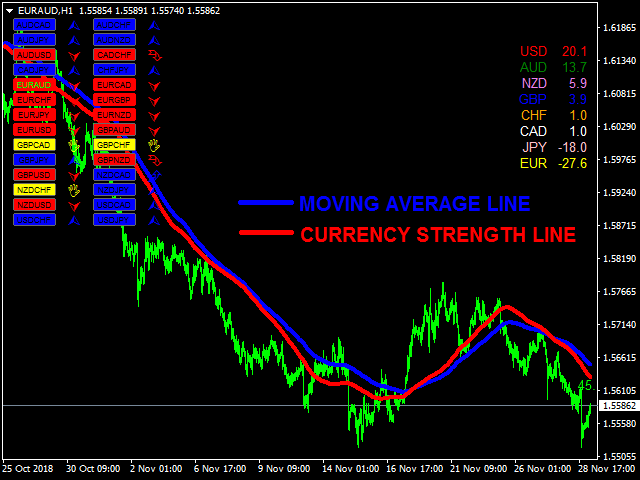
移动平均货币强度计是一个图表指标,它为您提供带有货币强度计算法的移动平均线。


蓝色线是每个交易者使用的正常移动平均线。而红线是货币强度线。

指标参数


  • 设置
    • 调整时间框架
    • 移动平均时间帧 - 从 M1 到 MN 选择您想要的时间帧
    • 货币行周期 - 货币行的输入周期 *注意:输入“零”表示当前蜡烛。示例:周期为 0 的 D1 表示当前 D1 蜡烛的强度
    • 移动平均线周期 - 移动平均线周期
    • 方法 - 移动平均法
    • 移动平均线移动 - 移动平均线的移动
    • 价格 - 选择要使用的价格类型
    •  点子交叉 - 移动平均线 和 货币强度线 之间的区别,用于判断货币对是趋势还是交叉

  • 显示设置
    • 字体 - 编辑字体
    • 显示或隐藏优势、趋势和移动平均线
    • 货币颜色
    • 信号颜色
    • 线条颜色
    • 对象的 X 和 Y 轴

  • 警报设置
    • 警报基于 - 在基于时间间隔或基于方向变化的警报之间进行选择。
    • 警报类型 - 选择从市场方向、货币强度或两者中获取警报
    • 市场方向警报 - 仅对趋势对、交叉对、等待对或所有方向发出警报
    • 计算机警报 - 这是一个图表警报。选择是仅按图表对还是按所有对获得警报
    • 电子邮件警报 - 这是一个 MAIL 通知警报。选择是仅按图表对还是按所有对获取报告
    • 移动警报 - 这是 元交易者应用程序 电话警报。选择是仅按图表对还是按所有对获取警报/报告
    • 提醒我时间 - 选择您希望收到提醒的时间。
    • 警报间隔 - 您将收到下一个警报的时间间隔
    • 最大蜡烛 - 这将限制或控制要分析的最大蜡烛。限制蜡烛的数量是为了避免延迟或挂在你的蜡烛上。这将防止您的 MT4 由于高负载而挂起。想象一下该指标对 28 对 2500 根蜡烛进行了多少计算。


评论 20
Najseattle7
292
Najseattle7 2022.06.06 04:45 
 

This is a fun indicator. I made a nice strategy using envelopes around the blue MA and angles of both the MAs. This indicator can do some cool things

Frank Paetsch
7463
Frank Paetsch 2021.09.22 00:33 
 

good Indicator

4example
245
4example 2020.12.18 01:12 
 

I am still yet to find a loosing trade in testing. Will put to work tonight on VPS. From now one this little guy is working, I will rest. I test it on several pairs in both trending and consolidating markets. If real time entry is used and active money management, there is simply no loosing trade, but break even in consolidation. In trending market it is amazing. Now I know, there are here some negative reviews. Of course. They have no patience to test nor willingness to ask the author about help with strategy. Not all time frames are equal guys. Emir is one of a kind. His indicator is simply fantastic. Please have the diligence to test it properly before posting your review and help others with an honest opinion.

推荐产品
Love Trend
Maryna Shulzhenko
Love Trend indicator showing buy and sell areas. The indicator follows the price movement around the opening price. It also displays information about the trend following the breakout of the low and high. The indicator has a very simple but effective graphic: an orange dot is displayed above the open price, and a blue dot is displayed below the open price. The indicator also includes an audible alert and a pop-up window to alert you when the candle closes at these important levels. The indicator
DracoAI
Hua Manh Hung
DracoAI is a revolutionary automated forex trading robot based on neural network.  Loss coverage is our premium exclusive feature. DracoAI IS: THE BEST MONEY MAKING SERVICE & STABLE PASSIVE INCOME PROFIT, EVEN IF YOU DO NOT PARTICIPATE IN BIDDING FINANCIAL INDEPENDENCE AND STABILITY DracoAI IS SAFE, BECAUSE: WE GUARANTEE THE SAFETY OF YOUR FUNDS NEGATIVE RESULTS OF TRADING ARE COVERED BY OUR RESERVE FUND 100% CONFIDENTIALITY Monitoring  - most popular signal at MQL5 :  https://www.mql5.com/en/s
SMC Venom 模型 BPR 指標是針對在智慧貨幣 (SMC) 概念內工作的交易者的專業工具。它會自動辨識價格圖表上的兩種關鍵模式: FVG (公平價值缺口)是三根蠟燭的組合,其中第一根和第三根蠟燭之間存在缺口。它在水平之間形成一個沒有成交量支撐的區域,這通常會導致價格調整。 BPR (平衡價格區間)是兩種 FVG 模式的組合,形成一個「橋樑」 - 當價格以低成交量活動移動時,突破並返回到水平的區域,從而在蠟燭之間產生間隙。 這些模式可協助交易者透過分析圖表上的交易量和價格動態(大型市場參與者和普通參與者之間的互動)來識別關鍵的支撐/阻力位、突破區域和切入點。 此指標以矩形和箭頭的形式可視化模式,也支援靈活的警報設定。 主要特點: 模式顯示模式:選擇顯示 BPR 模式(看漲和看跌)或 FVG 模式(看漲和看跌)。 可以隱藏所有圖表分析模式。 以條數過濾:BPR 結構中 FVG 之間的最小/最大距離。 訊號的附加視覺化: 箭頭有 9 種類型可供選擇(標準、細、分形等)或手動輸入 Wingdings 代碼,其表格可以選擇性地顯示在圖表上。 使用 ATR 配置顏色、尺寸及其相對於價格
The Advanced Bands Squeeze indicator is a custom indicator based on the classic Bollinger Bands as created by John Bollinger. The Bollinger Band Squeeze occurs when volatility falls to low levels and the Bollinger Bands narrow. This low volatility level is called a “Squeeze”.  According to John Bollinger, periods of low volatility are often followed by periods of high volatility, where prices tend to move a lot in either direction. Therefore, a volatility contraction or narrowing of the bands
TrendXplorer
Darko Licardo
TrendXplorer indicator is designed to provide valuable insights into market trends, helping you navigate the dynamic world of trading with confidence. Key Features: Accurate Trend Analysis: TrendXplorer utilizes a special algorithm to analyze trends combined with price action. This enables easier trend detection and is less prone to change during price manipulation. Built-in Risk Calculator: Take control of your risk management with TrendXplorer's built-in risk calculator. This feature assesses
Market Structure Zig Zag
Lesedi Oliver Seilane
4.63 (27)
Free Market structure zig zag to assist in price action trading the screenshots describe how to use and how to spot patterns new version comes with alerts, email alert and  push notification alert can be used on all pairs  can be used on all timeframes  you can add additional confirmation indicators the indicator shows you your higher high and low highs as well as your lower lows and lower highs  the indication makes price action analysis easier to spot.
FREE
缠中说禅 “缠论”是网络名人“缠中说禅”关于证券市场的一种投资理论,他这个理论似乎适合一切具有波动走势的投资市场,比如股票、权证和期货等 。 “缠论” 是基于形态学,几何学的一种技术分析理论。 任何投资市场的走势,本质就像两片叶子一样不可复制,不会完全相同,但是走势的绝妙之处,就在于不相同的走势却有着相同的结构。 “缠论” 就是从走势中抽丝剥茧,注重走势结构的技术分析理论。 即使是再好的指标,可以抓到准确的买卖点。但市场始终是概率市场,如果不能做到100%准确,那么仓位管理,即时止损,心态问题等就会变的非常的重要。 学缠之人要懂得客观看待市场与行情,要自律,永远敬畏市场。 本指标就的作用:自动绘制缠论中最基础的形态:笔。
A "Volume Profile" is an advanced charting indicator that displays total volume traded at every price level over a user specified time period. The main components of the volume profile are POC ( Point Of Control - the price level, at which the maximum number of contracts were executed during a selected period), VAH ( Value Area High - the highest price in the Value Area) and VAL ( Value Area Low - the lowest price in the Value Area). When we settled on the original indicator, we spent a lot of
Blahtech Market Profile
Blahtech Limited
4.53 (15)
Was: $249  Now: $149   Market Profile defines a number of day types that can help the trader to determine market behaviour. A key feature is the Value Area, representing the range of price action where 70% of trading took place. Understanding the Value Area can give traders valuable insight into market direction and establish the higher odds trade. It is an excellent addition to any system you may be using. Blahtech Limited presents their Market Profile indicator for the MetaTrader community. In
MaxProfitDz v4
Hafis Mohamed Yacine
MaxProfitDZ Expert adviser MaxProfitDz v1.4     Recommendations Symbol: ALL PAIRS ..i Recommended    EURUSD. Time Frame:1M. Brokers: ALL brokers .  low spread/commission, 1:500 leverage Minimum Deposit Recommended :   $500 USD  Lot Size for 500$   : 0.01  Use a broker with good execution and with a spread of 0.1-2 points. A very fast VPS is required Parameters EA TrendON=true (Read the  note ) MMType = 2 LotMultiplikator = 1 LotConst_or_not = TRUE Take profit :5-10 pips  for accounts with five
Forex Gump
Andrey Kozak
2.4 (5)
Forex Gump is a fully finished semi-automatic trading system. In the form of arrows, signals are displayed on the screen for opening and closing deals. All you need is to follow the instructions of the indicator. When the indicator shows a blue arrow, you need to open a buy order. When the indicator shows a red arrow, you need to open a sell order. Close orders when the indicator draws a yellow cross. In order to get the most effective result, we recommend using the timeframes H1, H4, D1. There
ndicador ADX Crossing Alertby Mr Beast El Indicador ADX Crossing Alert v1.0 es una herramienta avanzada diseñada para potenciar tu análisis técnico en MetaTrader, centrándose en las señales generadas por el cruce del Indicador de Dirección del Movimiento (ADX). Este indicador ofrece alertas visuales en el gráfico y la conveniencia de alertas via email, permitiéndote estar siempre al tanto de las oportunidades de trading. Características Destacadas: ADX Crossing Signals: El indicador utiliza el c
This may just look like another indicator for identifying and displaying supply and demand, but dig-in further and you will discover it has much more to offer. In addition to the complete flexibility for displaying zones, consider the identification of recent support or resistance, the back-testing capability to help you learn how to identify the best supply and demand zones to trader from, the continuously updated trend information for all time frames, times from around the world displayed on
Owl smart levels
Sergey Ermolov
4.24 (37)
MT5版本  |  FAQ Owl Smart Levels Indicator   是一個完整的交易系統,包含   Bill Williams   的高級分形、構建正確的市場波浪結構的 Valable ZigZag 以及標記準確入場水平的斐波那契水平等流行的市場分析工具 進入市場和地方獲利。 策略的详细说明 指示灯使用说明 顾问-贸易猫头鹰助手助理 私人用户聊天 ->购买后写信给我,我会将您添加到私人聊天中,您可以在那里下载所有奖金 力量在於簡單! Owl Smart Levels   交易系統非常易於使用,因此適合專業人士和剛開始研究市場並為自己選擇交易策略的人。 策略和指標中沒有隱藏的秘密公式和計算方法,所有策略指標都是公開的。 Owl Smart Levels 允許您快速查看進入交易的信號,突出顯示下訂單的水平並向您發送有關已出現信號的通知。 優點很明顯: 清楚地顯示主要和更高時間框架的趨勢方向。 指示儀器信號的出現。 標記開單、止損設置和固定利潤的水平。 沒有多餘的,只有必要的結構! ZigZag   表示全球趨勢的方向,因此也表示貿易方向。 市場反轉點的短線清楚地表明在什
Effect Volume
Ivan Simonika
Volume indicator Effect Volume , in the Forex market volumes are unique (tick). This volume indicator demonstrates the level of financial and emotional involvement. When the indicator forms a new top, it indicates that buyers are stronger than sellers over a certain period of time. If the indicator decreases, this indicates that the bears are stronger. Why is it impossible to track normal volumes in Forex? The fact is that this is an over-the-counter market. Consequently, it is practically imp
El indicador "MR BEAST ALERTAS DE LIQUIDEZ" es una herramienta avanzada diseñada para proporcionar señales y alertas sobre la liquidez del mercado basándose en una serie de indicadores técnicos y análisis de tendencias. Ideal para traders que buscan oportunidades de trading en función de la dinámica de precios y los niveles de volatilidad, este indicador ofrece una visualización clara y detallada en la ventana del gráfico de MetaTrader. Características Principales: Canal ATR Adaptativo: Calcula
Signal trend indicator. Detects the direction of the trend and is coloured accordingly.  Has built in audible and visual alerts when trends change. Can send notifications to your phone or email. Allows Trend and Counter-Trend trading. Works on all timeframes, all currency pairs, metals, indices and cryptocurrencies. Can be used with binary options. Distinctive features No re-drawing; Simple and clear settings; Four types of alerts; Works on all timeframes and all trading tools; Suitable
GeoWprPro
Georgij Komarov
WPR by Profile, or WPR for Professionals Geo_WprPro is one of the well-known currency profile indicators. It simultaneously displays two WPR indicators with different parameters in the matrix form on all timeframes of multiple currency pairs forming the currency profile . As follows from the description, " WPR is a leading indicator that often goes ahead of the price chart. The oscillator frequently reaches extreme values before the price reversal as if anticipating that event: it almost always
Supreme Commander
Ramon Sobrevals Arce
4.13 (8)
The indicator of the indicators. The Most Powerful Technique to Determine Forex Trend Strength in 2023. We have perfected Supreme Commander that it calculates an average of the selected indicators (up to 16) and the selected timeframe (all) with the result of a single trend that indicates the potential of buying and selling.  It includes the following indicators: Accelerator/Decelerator oscillator Average Directional Movement Index Awesome oscillator; Bulls and Bears  Commodity Channel Index; De
Oni Scalper
Goh Cheng Wai
3.67 (3)
Dear Onis, This Indicator is used for   GBPUSD, US30 and GOLD on 1-Min Chart . For US30 , Depending on your broker, Minimum Lot Size will differ from 0.01 to 1.0 lots. My Current Account is trading at 1.0 lots at $1 per point . Please check with your Broker what's the Margin Required for your Minimum lot sizes before you trade on your Real account. I have Forward Tested the indicator for around 6 months before releasing it to the public. ( No Demo is available for the Indicator, Strategy Teste
Price Detect Volume
Svyatoslav Kucher
Определения текущей тенденции одна из самых важных задач трейдера не зависимо от стиля торговли. Индикатор  Price Detect   Volume поможет с достаточно высокой вероятностью это сделать. Price Detect Volume  - индикатор распознавания тенденции, использующий авторский алгоритм расчета, использующий объемы. Показания индикатора не изменяются не при каких условиях. Также с помощью индикатора можно наблюдать за коррекцией цены в сторону глобального тренда, определять возможные границы окончания отката
Dear traders I am happy to introduce to you my new tool called "Brilliant Oscillator" Indicator. This is one of the indicators that can be used as a stand alone indicator. WHAT I LIKE ABOUT THIS TOOL IS Fast and reliable signals Purpose The purpose of this tool is to assist both newbie and Advanced traders to analyze the market with high level of accuracy in both bearish and bullish market trends. The inputs In the input section you will be able to change colors of the indicator only. Currency p
NAM Order Blocks
NAM TECH GROUP, CORP.
3 (2)
MT4多時限訂單塊檢測指示器。 特徵 -在圖表控制面板上完全可自定義,提供完整的交互。 -隨時隨地隱藏和顯示控制面板。 -在多個時間範圍內檢測OB。 -選擇要顯示的OB數量。 -不同的OB用戶界面。 -OB上的不同過濾器。 -OB接近警報。 -ADR高低線。 -通知服務(屏幕警報|推送通知)。 概括 訂單塊是一種市場行為,它指示從金融機構和銀行收取訂單。著名的金融機構和中央銀行帶動了外匯市場。因此,交易者必須知道他們在市場上正在做什麼。當市場建立訂單塊時,它會像發生大多數投資決策的範圍一樣移動。 訂單建立完成後,市場將朝著上升和縮小的方向發展。訂單大宗交易策略的關鍵術語是它包括機構交易者正在做的事情。由於它們是主要的價格驅動因素,因此包括機構交易在內的任何策略都可以。 您將在任何時間範圍內實時看到訂單塊,使用我們的控制面板,您將能夠在所選的歷史記錄週期內檢測常規,拒收和未大寫的訂單塊。 現在您可以接收到訂單塊接近警報,我們在MT4上顯示屏幕通知,並將通知推送到您的手機!
TWO PAIRS SQUARE HEDGE METER INDICATOR Try this brilliant 2 pairs square indicator It draws a square wave of the relation between your two inputs symbols when square wave indicates -1 then it is very great opportunity to SELL pair1 and BUY Pair2 when square wave indicates +1 then it is very great opportunity to BUY pair1 and SELL Pair2 the inputs are : 2 pairs of symbols         then index value : i use 20 for M30 charts ( you can try other values : 40/50 for M15 , : 30 for M30 , : 10 for H1 ,
Pair Spread Indicator
Vladislav Ostashenkov
Pair Spread Indicator The indicator shows the difference in price between the two instruments. : Graph in the form of a histogram of the difference in price between the two instruments in a separate window. Ideal for related tools for example:  BRN -- WTI,   GOLD -- 50* Silver, DJ -- 14*S&P500, etc; Calculation method: closing price (open, high, low) N-bars back; Moving average on the histogram; Averaging options for the moving average: simple, exponential, smoothed, etc; The negative coefficie
Visual CrossPulse Indicator MT4
AL MOOSAWI ABDULLAH JAFFER BAQER
Visual CrossPulse Indicator The Visual CrossPulse Indicator is a tool designed for precision and ease, combining technical analysis with user-friendly features to identify profitable market opportunities. This hybrid strategy tool integrates the MACD (Moving Average Convergence Divergence) with an optional RSI (Relative Strength Index) filter, visually signaling high-probability trade setups for confident market entries. How It Works The indicator uses the MACD to detect trend momentum shifts.
Matrixs
Andriy Sydoruk
Matrix is a Forex arrow indicator. Displays signals simply and clearly! The arrows show the direction of the transaction, and are colored accordingly, which can be seen in the screenshots. As you can see, trading with such an indicator is easy. I waited for an arrow to appear in the desired direction - I opened a deal. An arrow formed in the opposite direction - closed the deal. The indicator also displays the lines with the help of which the arrow signals are formed, taking into account the int
This is a new strategy for SUPPLY DEMAND areas It is based on a calculation using the tick volume to detect the big price action in market for both bear /bull actions this smart volume action candles are used to determine the supply and demand areas prices in between main supply and demand lines indicate sideway market  up arrows will be shown when prices moves above the main supply and the secondary supply lines Down arrows will be shown when prices moves below the main demand and the secondary
Weiss Wave
Giordano Gorghetto
If you are a market operator looking for an advanced solution to identify trends and trend reversals in financial markets, the Weiss Wave indicator could be what you need. Based on the principle of Elliott wave analysis and combining multiple indicators, the indicator provides a comprehensive view of the market in an easy and intuitive way, even for less experienced traders. With clear and easy-to-interpret buy/sell signals, the indicator provides reliable guidance for identifying trends and tre
SPV Body
Yvan Musatov
The SPV Body indicator displays the average analysis of the intersection of adjacent bars. The indicator can easily detect unusual market movements which can be used as a filter. For clarity, poke the graphs to the very beginning of the history when the bars were incomplete, and the indicator will easily display this anamaly. A very effective system for building various filters and confirmations of market entry, to exclude anomalies from trading. It also fixes cyclicity, it turns out that the in
该产品的买家也购买
Cycle Maestro
Stefano Frisetti
NOTE: CYCLEMAESTRO is distributed only on this website, there are no other distributors. Demo version is for reference only and is not supported. Full versione is perfectly functional and it is supported CYCLEMAESTRO , the first and only indicator of Cyclic Analysis, useful for giving signals of TRADING, BUY, SELL, STOP LOSS, ADDING. Created on the logic of Serghei Istrati and programmed by Stefano Frisetti ; CYCLEMAESTRO is not an indicator like the others, the challenge was to interpret only t
Enigmera
Ivan Stefanov
5 (7)
ENIGMERA: 市场的核心 重要提示:MQL5.com 演示版本在策略测试器中运行,可能无法完全反映 Enigmera 的功能。请查看描述、截图和视频了解详细信息。如有任何问题,请随时联系我! 该指标的代码已完全重写。版本 3.0 增加了新功能并修复了自指标发布以来积累的错误。 简介 这个指标和交易系统是金融市场的一种独特方法。ENIGMERA 使用分形周期来精确计算支撑和阻力水平。它展示了真实的积累阶段,并提供了方向和目标。无论是在趋势中还是在修正中,这个系统都能工作。 它是如何工作的 指标的大部分功能通过图表左侧的按钮控制,使得能够快速响应不同的市场情况。 按钮 ON/OFF – 显示或隐藏整个指标。 Channel – 激活支撑通道,显示可接受的偏差范围。 Dev1 (第一偏差) – 指示价格在支撑偏差内的波动,信号表示市场正在整合或积累力量。 Dev2 (第二偏差) – 显示价格在偏差之间的波动,表示趋势形成和方向。 Dev3 (第三偏差) – 表示趋势的显著加速和高波动性。 45deg (45度) – 显示市场的节奏和相对于 45 度线的运动稳定性。 Tgt1/2
PZ Harmonacci Patterns
PZ TRADING SLU
3.17 (6)
可以说,这是您可以为MetaTrader平台找到的最完整的谐波价格形成自动识别指标。它检测19种不同的模式,像您一样认真对待斐波那契投影,显示潜在的反转区域(PRZ),并找到合适的止损和获利水平。 [ 安装指南 | 更新指南 | 故障排除 | 常见问题 | 所有产品 ] 它检测19种不同的谐波价格形态 它绘制了主要,衍生和互补的斐波那契投影(PRZ) 它评估过去的价格走势并显示每个过去的形态 该指标分析其自身的质量和性能 它显示合适的止损和获利水平 它使用突破来表明合适的交易 它在图表上绘制所有样式比率 它实现了电子邮件/声音/视觉警报 受斯科特·M·卡尼(Scott M. Carney)的书的启发,该指标旨在满足最纯粹和最熟练的交易者的需求。但是,它采取了一种使交易更容易的方式:在向交易发出信号之前,它会等待Donchian朝正确方向突破,从而使交易信号非常可靠。 斐波那契投影与向量无关 它实现了电子邮件/声音/推送警报 它绘制了ABCD投影 重要提示: 为了符合 Scott M. Carney先生 的商标申诉,某些图案名称已重命名为不言自明的替代方式, Scott M.
RelicusRoad Pro
Relicus LLC
4.63 (104)
RelicusRoad 用户手册 + 培训视频 + 访问 Private Discord Group + VIP 身份 一种看待市场的新方式 RelicusRoad 是世界上最强大的外汇、期货、加密货币、股票和指数交易指标,为交易者提供保持盈利所需的所有信息和工具。我们提供技术分析和交易计划,帮助每一位交易者取得成功,从初学者到高级。它是一个关键的交易指标,可以提供足够的信息来预测未来的市场。我们相信一个完整的解决方案,而不是图表上几个没有意义的不同指标。这是一个多合一指标,显示无与伦比且非常准确的信号、箭头 + 价格行为信息。 RelicusRoad 基于强大的人工智能,提供缺失的信息和工具来教育您并使您成为交易专家,成为成功的交易者。 几乎所有技术指标都滞后,这意味着它们只能报告已经发生的事情。因此,他们只确认您过去可以看到的价格已经在哪里。我们相信领先指标可以预测未来价格,而无需重新绘制,也不要过度依赖可能改变并导致重新绘制的滞后指标。如果您根据滞后指标进行交易并建立头寸,您就知道您已经大部分时间在赌博。我们相信,在您考虑建仓之前,您需要了解市场并了解价格变动的位置和原
Linear Trend Predictor — 结合切入点和方向支撑线的趋势指标。按照突破高/低价通道的原理运作。该指标算法过滤市场噪音,考虑波动性和市场动态。 指示器功能  使用平滑方法,显示市场趋势和开立买入或卖出订单的切入点。  适合通过分析任何时间范围内的图表来确定短期和长期的市场走势。  输入参数可适应任何市场和时间范围,允许交易者独立定制指标。  设定的指示信号不会消失,也不会重新绘制——它是在蜡烛收盘时确定的。  几种类型的通知以箭头组合。  该指标既可以作为独立的交易系统使用,也可以作为其他交易系统的补充。  可供任何经验水平的交易者使用。 主要参数 Volatility Smoothing Level - 指标的主要参数,允许您配置指标以实现舒适的操作。 它的数字范围是 1 到 100,从而增加了您可以获得更长趋势运动的平滑度。 通过少量的数字,您可以获得短期走势并快速退出交易。 使用指标进行交易的时刻:  红线和箭头表示下降趋势和卖出开盘信号。止损应根据前一个上分形来设置。  黄线和箭头表示上升趋势和买入开盘信号。止损应根据前一个下分形来设置。
Introduction to X3 Chart Pattern Scanner X3 Cherart Pattern Scanner is the non-repainting and non-lagging indicator detecting X3 chart patterns including Harmonic pattern, Elliott Wave pattern, X3 patterns, and Japanese Candlestick patterns. Historical patterns match with signal patterns. Hence, you can readily develop the solid trading strategy in your chart. More importantly, this superb pattern scanner can detect the optimal pattern of its kind. In addition, you can switch on and off individu
Order Blocks ICT Multi TF MT4
Diego Arribas Lopez
5 (2)
[ MT5 Version ]  [ Kill Zones ]  [ SMT Divergences ] How to trade using Order Blocks:  Click here User Interface Performance:  During testing in the strategy tester, the UI may experience lag. Rest assured, this issue is specific to the testing environment and does not affect the indicator's performance in live trading. Elevate your trading strategy with the  Order Blocks ICT Multi TF  indicator, a cutting-edge tool designed to enhance your trading decisions through advanced order block analys
TrendMaestro
Stefano Frisetti
5 (3)
note: this indicator is for METATRADER4, if you want the version for METATRADER5 this is the link:  https://www.mql5.com/it/market/product/108106 TRENDMAESTRO ver 2.4 TRENDMAESTRO recognizes a new TREND in the bud, he never makes mistakes. The certainty of identifying a new TREND is priceless. DESCRIPTION TRENDMAESTRO identifies a new TREND in the bud, this indicator examines the volatility, volumes and momentum to identify the moment in which there is an explosion of one or more of these data a
Gold Channel XAUUSD
Paulo Rocha
5 (4)
Gold Channel is a volatility-based indicator, developed with a specific timing algorithm for the XAUUSD pair, which consists of finding possible corrections in the market. This indicator shows two outer lines, an inner line (retracement line) and an arrow sign, where the theory of the channel is to help identify overbought and oversold conditions in the market. The market price will generally fall between the boundaries of the channel. If prices touch or move outside the channel it is a tradi
PTS Precision Index Oscillator V2
PrecisionTradingSystems
5 (1)
精密指数振荡器(Pi-Osc)由Precision Trading Systems的Roger Medcalf开发 版本2经过精心重新编码,以在您的图表上加载速度非常快,还加入了一些其他技术改进,以提高体验。 Pi-Osc旨在提供准确的交易定时信号,旨在找到极端的耗尽点,这些点是市场被迫去触及,以清理每个人的止损单。 该产品解决了一个古老的问题,即知道极端点在哪里,这使得交易员的生活变得更加简单。 这是一个高度复杂的共识指标,与行业标准的振荡器相比,具有一些强大的区别。 它使用的一些特征包括需求指数、资金流动、RSI、随机指标、模式识别、成交量分析、标准偏差极端点以及不同长度上述各种变化的分歧。 乍一看,对于未经培训的人来说,它似乎与任何其他振荡器没有什么不同,但当与其他振荡器(如RSI或动量等)相对比时,这个指标的真正威力开始显现。 据我所知,没有其他振荡器可以频繁地精确指出顶部和底部,具有相同的定期效率。 精密指数振荡器由许多不同的数学方程组成,用于测量多个时间框架采样中的价格和成交量变动,从而高度准确地预测趋势可能发生转折的位置。 PTS Pi-Osc V2非
ECM Elite Channel is a volatility-based indicator, developed with a specific time algorithm, which consists of finding possible corrections in the market. This indicator shows two outer lines, an inner line (retracement line) and an arrow sign, where the channel theory is to help identify overbought and oversold conditions in the market. The market price will generally fall between the boundaries of the channel. If prices touch or move outside the channel, it's a trading opportunity. The ind
Quantum Entry PRO
Aleksandr Makarov
Special offer!  Any 2 advisors of your choice for only 99$  Any 2 indicators of your choice for only 49$ -------------------------------------------- The offer is limited in time, don't miss this chance. Write in a private message or in telegram @AlexBotm5 Quantum Entry is a powerful price action trading system built on one of the most popular and widely known strategies among traders: the Breakout Strategy! This indicator produces crystal clear buy and sell signals based on breakouts of key s
Bomb Bank Signal
Igor Pereira Calil
5 (1)
炸彈銀行訊號:您對 MetaTrader 4 的信心指標 Bomb Bank Signal 是 MetaTrader 4 的一個強大指標,旨在識別金融市場中最相關的趨勢。如果您正在尋找一種能夠準確預測運動的工具,那麼炸彈庫就是您需要的盟友。 運作原理: 該指標結合了三種不同的方法——成交量分析、蠟燭收盤價和對稱趨勢——來偵測和發出買賣機會訊號。當炸彈銀行識別出買入機會時,它就像一顆「炸彈」;當它偵測到賣出訊號時,它就像一個「頭骨」。 為什麼炸彈銀行不一樣? 完全可靠性:炸彈庫訊號不會刪除訊號。訊號一旦發出,就會一直存在,確保您不會錯過任何機會。 極為準確:炸彈庫不會發出錯誤訊號。它會即時更新您的訊息,隨著市場的變化進行調整,但保持先前訊號的透明度。 即時更新:訊號被即時識別並在必要時更新,使您能夠快速響應市場變化。 最大化您的結果: 炸彈銀行訊號是識別趨勢持續走勢的理想選擇。例如,如果您已經做空並且指標在 M15 發出買入訊號,那麼現在就是平倉或部分下單的最佳時機,反之亦然。 此外,經過仔細分析,我們建議您遵循M30、H1和H4上的訊號,停損僅50點。這使得價格朝著有利
Gann Zone Pro
Kirill Borovskii
This indicator identifies and displays zones, as it were areas of strength, where the price will unfold. The indicator can work on any chart, any instrument, at any timeframe. The indicator has two modes. The indicator is equipped with a control panel with buttons for convenience and split into two modes. Manual mode: To work with manual mode, you need to press the NEW button, a segment will appear. This segment is stretched over the movement and the LVL button is pressed. The level is displayed
Introducing the Delta Volume Profile Indicator - Unleash the Power of Institutional Precision!  https://youtube.com/shorts/znUdz5PEBAY Technical Indicator: Are you ready to trade like the pros? The Delta Volume Profile Indicator is no ordinary tool. It’s a high-precision, cutting-edge indicator that puts the power of institutional-grade trading in your hands. This unique indicator analyses delta volume distribution in real-time, revealing the market's hidden buy/sell imbalances that the biggest
Full Forex Market View Dashboard
Opengates Success International
5 (2)
完整的外汇市场视图仪表板指示器 这是一个自定义指标,旨在让交易者全面了解市场上正在发生的事情。 它使用实时数据访问市场并显示成功交易所需的每一点信息。 安装: 在将此指标附加到您的窗口图表之前,请转到您的 MT4 的市场观察面板并隐藏所有您不需要或交易的货币对,并将其余货币对留在那里。 原因是 FFMV 仪表板将显示出现在 MT4 市场观察中的所有货币对。 它最多可以显示 30 个或更少的货币对。 如果它超过您 MT4 的市场观察中的那个,它会模糊和毁坏 FFMV 仪表盘上的字体和图像! 它不会正确显示。 用法:      单人交易      对于篮子交易(见截图如何)      也可用于多单交易      确认从您自己的交易系统等收到的信号的有效性。 成分:      时间范围:从 M1 到 MN1 当前蜡烛状态(买入/卖出      趋势:币种整体走势      影响:货币变动的幅度/波动性,见下文:      建立:货币正在建立      好:货币越来越严重      高:币值值得关注      强:要考虑方向      非常强:这种货币近乎完美      优秀:
Pair Trading Station MT4
Young Ho Seo
3.67 (3)
How to use Pair Trading Station Pair Trading Station is recommended for H1 time frame and you can use it for any currency pairs. To generate buy and sell signal, follow few steps below to apply Pair Trading Station to your MetaTrader terminal. When you load Pair Trading Station on your chart, Pair Trading station will assess available historical data in your MetaTrader platforms for each currency pair. On your chart, the amount of historical data available will be displayed for each currency pai
ATC AlgoZone Indicator
Ameur Boudenne
5 (2)
Algo Trading Indicaor  With this indicator , you’ll have zones and trends that hight probability the price will reverse from it. so will gives you all the help that you need  Why should you join us !?  1-This indicator is logical since it’s working in previous days movement , to predict the future movements. 2-Algo trading indicator will help you to draw trends which is special and are too strong than the basics trend , trends will change with the frame time that you work on . 3-We can use
This is a mini version(One pair) of Advanced Detector of Trend Reversal and Continuance known as TrueTrendStarM(TTSm25). It is a sensitive and Predictive indicator of Price Trends for Professional traders. ( WEEKEND DISCOUNT OFF ! )( ATTENTION BUYERS:- PLEASE CONTACT ME FOR HOW BEST TO USE THE INDICATOR FOR MAXIMUM PROFITS )    It detects high odds changes in Price Trend direction long before other indicator detects it. I have been working on it since 2019.    This is possible due to fractal
PZ Trend Trading
PZ TRADING SLU
4.8 (5)
许多盈利交易者不仅知道如何识别市场趋势,而且也能把握趋势建立后的交易机会。 Pz 趋势交易 指标设计用来在趋势行情中尽可能的赚取利润。 已建立的趋势提供了一揽子交易机会,但大多数趋势交易指标完全忽视了它们,让交易者在趋势行情时完全不知道该如何做!一般趋势指标只通知有关的趋势变化,但根本不足以得到卓越的回报. Pz 趋势交易 指标比一般趋势指标显示多达 20 倍的交易 , 因为它注重所谓的市场时机。它不仅显示当前的市场趋势,也有回调,内柱线的突破和调整。它令您在趋势回调之后介入,安全的柱线内突破金字塔加仓,以及发现潜在的反转,和已知的调整。 趋势改变 一个趋势改变在市场方向变化时发生。趋势变化在图表上用带数字的彩色圆圈显示。蓝色 (1) 信号为上涨开始, 而红色 (1) 信号为下跌开始。趋势变化并非评估当前价格动作的结果, 它意味着交易设置是不定时地。如果您正确使用本指标, 在趋势变化时, 您将将已经入场 (参看下面的调整)。 回调 但凡趋势在运动中,行情上下抖动,盈利者收割利润,且其它参与者入场。趋势回调代表好的买入机会,通常是由主力获利离场导致。如果行情在回调后回归上行, 指标将
Clever Order Blocks
Carlos Forero
5 (2)
Description Very precise patterns to detect: entry signals as well as breakout, support and resistance reversal patterns. It points out zones in which, with a high probability, institutional orders with the potential to change the price’s direction and keep moving towards it, have been placed.  KEY LINKS:   Indicator Manual  –  How to Install   –  Frequent Questions  -  All Products  How is this indicator useful? It will allow you to trade on the order’s direction, once its direction has been id
IMPORTANT; Price is subject to rise at any time from now! Do not miss this offer! Dear trader I am glad to introduce my new tool called Trend Analyser Dashboard to you. The design, style, and settings of this indicator  have been made simple to make its users not take too much time in understanding the indicator itself.   The purpose is to help traders in analysing the direction of the major trend and the status of the trend whether in weak trend or its strong trend. The indicator will also prov
介绍 ON Trade Waves Patterns Harmonic Elliot Wolfe,这是一款高级指标,旨在使用手动和自动方法检测各种市场模式。以下是它的工作原理: 谐波模式: 该指标可以识别出现在您图表上的谐波模式。这些模式对于练习谐波交易理论的交易者非常重要,正如Scott Carney的书《谐波交易第1卷和第2卷》所描述的那样。无论您是手动绘制它们还是依赖自动检测,ON Trade Waves Patterns都可以胜任。 控制面板: 我们配备了一个用户友好的控制面板,它会保存您的图表和时间帧设置,使您可以轻松切换不同配置。您甚至可以最小化它以最大化图表空间。如果您更喜欢使用其他分析工具,只需单击关闭按钮即可隐藏所有指标数据。 模板保存: 当您自定义设置或添加其他指标,如移动平均线或布林带时,该指标会自动保存您的模板。这意味着您可以随时轻松加载您喜欢的设置。 优化显示: 对于Windows 10用户,我们建议调整您的DPI设置以获得高清设备上的最佳屏幕体验。右键单击MetaTrader图标,选择“兼容性”,然后选择“更改高DPI设置”,将其设置为“系统(增强)”。
Introduction Excessive Momentum Indicator is the momentum indicator to measure the excessive momentum directly from raw price series. Hence, this is an extended price action and pattern trading. Excessive Momentum Indicator was originally developed by Young Ho Seo. This indicator demonstrates the concept of Equilibrium Fractal Wave and Practical Application at the same time. Excessive Momentum detects the market anomaly. Excessive momentum will give us a lot of clue about potential reversal and
Magic M2
Tuan Anh Dao
4.5 (8)
------ GOOD LUCK   -----   (Telegram: @MagicBinary) The indicator allows you to trade binary options. T his indicator give high winning ratio with over 20 years of backtesting  The recommended time frame is М1 and the expiration time is 3, 5 minutes. The indicator suitable for Auto and Manual trading. A possible signal is specified as a arrows above/under a candle. You can entry current candle /intrabar or can wait until candle close Arrows are not re-painted Trade sessions: Any/ Rec
StalkeR Arrow
Abdulkarim Karazon
5 (3)
StalkeR Arrow 是一个箭头指标,可在柱形开盘/柱内发出买入和卖出信号,该指标基于价格行为模式和分形 该指标为每个买入和卖出信号提供 tp 和 sl ,tp 和 sl 以线的形式出现在每个信号的上方和下方,它们会延伸直至形成新的信号。 该指标具有回溯测试面板/仪表板,可提供历史信号的赢/输统计数据,该指标不会重新绘制或背面绘制。 参数 : StalkeR 周期:箭头周期,数字越大,信号越少 spread : 将使用以点为单位的点差值来计算面板上的盈利和亏损 止损 ATR x : atr 乘法中的止损值 止盈 ATR x : atr 乘法中的 TP 值 ATR period : 用于计算 tp 和 sl 的 atr 周期 TP/SL 线颜色和宽度 箭头颜色和宽度 面板/仪表板位置。 警报/电子邮件/通知
ON Trade Optuma Astro
Abdullah Alrai
5 (4)
当然可以!以下是您提供的文本的中文翻译: 引入 MT4 天文指标:您的终极天体交易伙伴 您准备好将交易体验提升到天文高度了吗?不用再寻找,就在我们的革命性 MT4 天文指标中。这个创新工具超越了传统的交易指标,利用复杂的算法提供无与伦比的天文洞察力和精确计算。 指尖上的宇宙信息: 瞻仰一个详尽的面板,展示了一宝藏般的天文数据。了解行星的地理/太阳心坐标,太阳/地球距离,亮度,伸长度,星座,黄道和赤道坐标,甚至是水平坐标——每个细节都经过精心计算并呈现得美轮美奂。指标生成的垂直线对应于时间值,为您的交易旅程提供了宇宙的视角。 行星线条与关系: 在您的图表上欣赏行星线条的魔力,具有可自定义的比例和角度。通过直观的控制面板轻松切换每个行星线条的可见性。通过连结、六分、四分、三分、对冲和逆行等指标,发现行星关系的艺术。在您选择的时间范围内探索这些宇宙构造,使您能够识别重要的交易机会。 揭示甘恩的智慧: 通过受甘恩启发的平方垂直线揭示潜在的反转时机。这种创新修改将甘恩历经考验的原则带入现实,帮助您提前了解市场的转向和趋势。 月亮引导: 在您的图表上优雅地导航月相,因为新月和满月点缀其间。月亮周期
Key level wedge pro
Presley Annais Tatenda Meck
5 (1)
We have combined all of our beloved indicators the likes of: Key level order block , Key level supply and demand , Key level liquidity grab and Key level wedge into one single indicator and dashboard. Whats new Dashboard : There is an easy access dashboard for all your needs. Multi-timeframe button : There is now a multi-timeframe option for Order Blocks and Supply and demand zones, making it easy to see higher timeframe zones easily on the current timeframe by just clicking the desired timefra
VIP Buy Sell Signals MT
Hapu Arachchilage Tharindu Lakmal
Contact me through this email address to download the FREE strategy PDF for this indicator tharindu999lakmal@gmail.com Download MT5 version here -- >>  https://www.mql5.com/en/market/product/119467 Introduction   The   "VIP Buy Sell Signals MT"   is designed to provide BUY and SELL trade signals based on the current market conditions.   A   Trading Strategy   (Chee sheet)  has been  provided for this trading indicator.   (Read the description). This indicator has time tuned e ntry signals . so
Please send me Direct message on MQL5 CHAT after purchasing the Indicator for Training and Installation Support There are some additional files that is important to use with the Indicator . So be sure to contact me after purchasing the Indicator So that I can add you for training and support . If you find any difficulty with installation then send me Direct message here So that I can connect with you via Anydesk or Teamview for the product installation. " Smart Order Block Indicator " to find m
作者的更多信息
True Currency Strength Meter
Emir Revolledo
4.24 (17)
发生了重大变化。参数说明将被更改。期待 6 月底之前的另一个更新。 最终更新后价格会上涨。 带有电子邮件和短信推送通知的真正货币计! 您有没有想过为什么有些货币对会比其他货币对波动更大,而 EURGBP 的 100 点大于 EURUSD 的 100 点?而在新闻中,有些会移动 200 点,但有些只会移动 150 点?这是新开发的“28对”真实货币强度计的关键。 人们必须知道所有对都是唯一的并且彼此不同。英镑和日元货币对通常移动得如此之快,但其他货币对则不然。这是我的 TRUE CURRENCY METER 的关键,用于平衡这 8 种主要货币的新计算。鉴于每一对都有不同的行为,他们都根据他们的市场走势进行了平衡,这基本上是基于 PIPS。典型的货币强度计甚至没有考虑到“EURGBP”的 100 点值可能与“欧元兑美元”的 100 点值不同。但是这个新的货币强度计将计算提升到一个新的水平,其中所有“28 对”都以相同的基数计算,只是为了获得每种货币的真实强度。其中,真正的货币计的关键是“平衡货币强度计”。 参数 时间范围 - 从 M1 到每月选择您想要的时间范围
Think of the rarest pair you can think of. And I assure you that this indicator can compute it's strength. This Currency Meter will literally calculate any currency pairs, either it is the Major Pairs, Metals, CFD's, Commodities, Crypto Currency like Bitcoin/BTC or Ethereum/ETH and even stocks. Just name it and you will get it! There is no currency pair this Currency Meter can solve. No matter how rare or exotic is that currency, it will always be solved by this Currency meter which on a real-ti
MACD Currency Meter
Emir Revolledo
4.68 (44)
MACD shì zuì shòu huānyíng de dòngliàng hé qūshì zhǐbiāo zhī yī. Huòbì qiángdù jì yěshì jīyú duō zhǒng huòbì de qūshì zhǐbiāo. MACD huòbì qiángdù jì shì jùyǒu MACD hé huòbì qiángdù jìsuàn fǎ de dān túbiǎo zhǐbiāo. Tā hái jùyǒu yī jiàn shì gōngnéng, qízhōng 28 gè zhǔyào hé cì yào duì xiǎnshì zài nín de yíbiǎo bǎn shàng, tōngguò dān jī mǒu gè duì, nín de túbiǎo jiāng zìdòng gēnggǎi wèi nín xuǎnzé de túbiǎo. Chǎnpǐn yōushì lùzhì de guānyú rúhé shǐyòng zhǐbiāo dì wǎngluò yántǎo huì wánzhěng de zījī
Fibonacci CSM
Emir Revolledo
Fibonacci Currency Strength Meter (FCSM) Early Access Sale!! This new product is still in the process of adding new features and settings. For early bird buyers. The Price will be 50% Sale. In a few weeks, the product will be done. Go Grab your copy while it's still cheap. More details will be added soon. Things to be added. Alert Levels Mobile and Email Alert From it's name, Fibonacci Currency Strength Meter is a combination of Fibonacci levels and Currency Strength Meter. The plot of Fibona
RSi CSM
Emir Revolledo
*笔记 : 早期购买者可享受 40% 折扣! 免费 EA 将于 11 月第 2 周发布 一旦免费 EA 可用,折扣即结束 RSi 指标是指示某种商品或货币对超买或超卖时最受欢迎的指标之一。 货币强弱计也是一个基于多种货币的趋势指标。 RSi 货币强度计是一款单图表指标,具有 RSi 和货币强度计的算法。 它还具有一键功能,其中 28 个主要和次要对显示在您的仪表板上,通过单击某个对,您的图表将自动更改为您选择的图表。 产品优势: 免费 EA 来管理您的交易。给我留言了解更多详情 输入参数 RSi 设置 - 默认参数为周期 14,电平为 65/35。电平越高或越低,信号会更少但更准确 线图、仪表板和市场趋势的类型 显示设置 - 字体货币颜色、信号颜色、线条颜色以及 X 和 Y 轴对象的位置 计算机、电子邮件和图表警报
Advance Currency Meter is a currency meter that detects strong market trends. This indicator is good for scalping, intraday trading and swing trading. The indicator will detect short term to long term market trends. This will give you good insight which currencies are best to trade as of the moment. Note : Kindly contact me before you make any purchases. This won't work on your account without my permission. Note :   Works well with my MACD Currency Strength Meter
Think of the rarest pair you can think of. And I assure you that this indicator can compute it is strength. This Currency Meter will literally calculate any currency pairs, either it is a major pair, metal, CFD, commodity, cryptocurrency like Bitcoin/BTC or Ethereum/ETH and even stocks. Just name it and you will get it! There is no currency pair this Currency Meter cannot solve. No matter how rare or exotic is that currency, it will always be solved by this Currency meter on a real-time basis. S
筛选:
Najseattle7
292
Najseattle7 2022.06.06 04:45 
 

This is a fun indicator. I made a nice strategy using envelopes around the blue MA and angles of both the MAs. This indicator can do some cool things

Frank Paetsch
7463
Frank Paetsch 2021.09.22 00:33 
 

good Indicator

4example
245
4example 2020.12.18 01:12 
 

I am still yet to find a loosing trade in testing. Will put to work tonight on VPS. From now one this little guy is working, I will rest. I test it on several pairs in both trending and consolidating markets. If real time entry is used and active money management, there is simply no loosing trade, but break even in consolidation. In trending market it is amazing. Now I know, there are here some negative reviews. Of course. They have no patience to test nor willingness to ask the author about help with strategy. Not all time frames are equal guys. Emir is one of a kind. His indicator is simply fantastic. Please have the diligence to test it properly before posting your review and help others with an honest opinion.

Fregatt888
588
Fregatt888 2020.09.23 11:55 
 

Отличный индикатор очень помогает в торговле. Главное следовать правилам.Спасибо за хорошую работу Эмир

Aravind Kolanupaka
9170
Aravind Kolanupaka 2020.05.18 04:44 
 

Good

Mahmoud A Kamaleh
274
Mahmoud A Kamaleh 2019.09.25 22:29 
 

用户没有留下任何评级信息

Yebo Lu
852
Yebo Lu 2019.09.23 13:10 
 

bravo !

Henry Setiawan
684
Henry Setiawan 2019.09.19 11:20 
 

This indicator is great. Now I trade more safe & confident, without a dangerous technique like martin, averaging, etc. I think Emir should make this forum more live, because everyone in here wanna see & learn what strategy we are using with this indicator.

Qun Li
579
Qun Li 2019.08.20 05:00 
 

very good

Forex 101
77
Forex 101 2019.08.18 13:11 
 

I'm not sure why people are giving out bad reviews on this one when you can surely earn $$$. I just started last Friday and already paid off the rental amount. I will surely get the permanent license and continue to earn. This system is a lifesaver thank you Emir! God bless you!

AgeTrader
105
AgeTrader 2019.08.18 02:13 
 

用户没有留下任何评级信息

jayosworld
291
jayosworld 2019.08.16 09:34 
 

Wow! Just rented for a month a few hours ago and already had valid signals. I am up in profit already! Just watch the videos on how to fix your charts (it's pretty easy) and you'll do just fine! I'll update my review after a month to show how my trades went.

Christopher Christian Kobiela
478
Christopher Christian Kobiela 2019.08.08 22:03 
 

Great indicator, already gave me some pips! Would you please add me to your Facebook Group? Thanks!

Hiroaki Takahashi
228
Hiroaki Takahashi 2019.08.07 04:33 
 

I want to join your group facebook ! Nice indicator

vollmerama
445
vollmerama 2019.07.12 21:51 
 

Im amazed. Today it showed clearly on H1 that EURUSD was going to go Long. And it did Amid some other indicators pointing towards short trade. Good Job!

Ravi Luke
645
Ravi Luke 2019.07.12 06:08 
 

Great indicator. With good money management you can get good returns.

sunnychow
9051
sunnychow 2019.07.10 16:34 
 

用户没有留下任何评级信息

[删除] 2019.07.06 08:18 
 

用户没有留下任何评级信息

Mohamed Ah M A A El Gharabawy
834
Mohamed Ah M A A El Gharabawy 2019.03.22 18:08 
 

It’s is a very smart system , and if used correctly with correct money management it can be very profitable , the good trades tend to continue for longer times while the bad trades are exited quickly. So the overall is in the positive.

The developer is great , he is always responsive quickly , and he does his best to solve any problem.

I whole heartedly recommend this indicator.

kennyschuble
133
kennyschuble 2019.03.13 22:57 
 

Full disclosure I am not trading real money yet. But this indicator looks AWESOME in demo and if you get full purchase you get access to the Facebook were people are posting trades and making money. The biggest point from people in the FB group seems like the easy of use and the amount of pips or % they are making ! One person said it correctly that if there ever was a single indicator system this is it! Let me also make this point, and to make a long story short. Emier went way above and out of his way to help me with some technical issues. So you wont get any better service ! Without him I would not be up and running. Let's also not forget the one on one you get with him about the indicator to make you you understand it all. I was already trying to put together a system of currency strength with moving averages but then he came out with this and did the work for me...lol.......Thanks Emir !

回复评论
版本 1.8 2020.08.21
Arrow signals on charts are now available
版本 1.7 2020.02.26
Button Length and Width can now be edited
版本 1.6 2019.07.07
No major changes. This is just a reminder to DEMO-version users that back test result is not accurate. This means that the lines of backtest is different from forward testing(rented or licensed)

*Note: The limitation of backtest is that it can only test one pair at a time. So if it test a multi-currency indicator like this, results are not accurate.
版本 1.5 2019.06.20
Added Options to Show or Hide Currency strengths, trends or moving average
版本 1.4 2019.03.19
Text Color Added
版本 1.3 2019.01.31
Moving Average and Currency Strength Line can now have different periods.
Shift Parameter is only for Moving Average
版本 1.2 2018.12.19
Back Test can now be used, but only December 2018 onwards won be allowed for back testing
Alerts can now be either Time_Interval or when there's a change in Market Direction
Moving Average Shift is added for Moving Average Line.
版本 1.1 2018.12.13
Minimal change just on comment section when user's mt4 have missing data.