PZ Megaphone
- 指标
- PZ TRADING SLU
- 版本: 2.0
- 更新: 1 十二月 2017
- 激活: 20
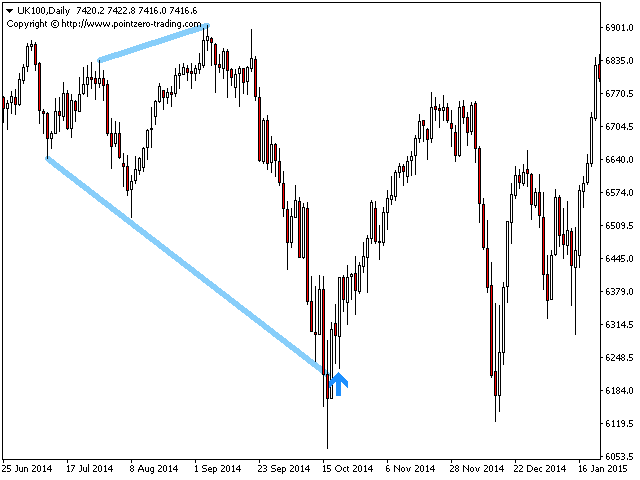
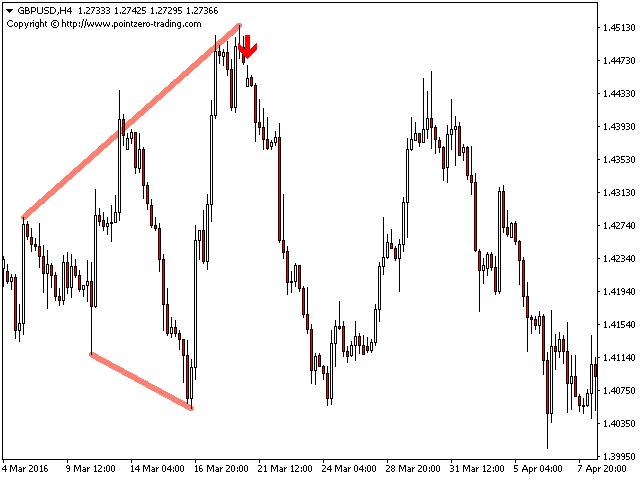
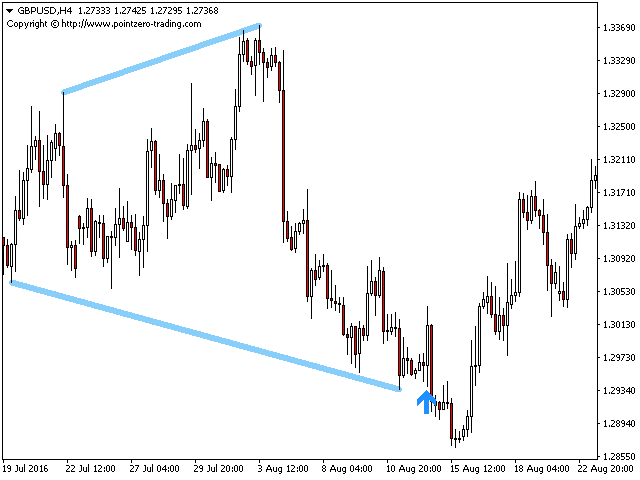
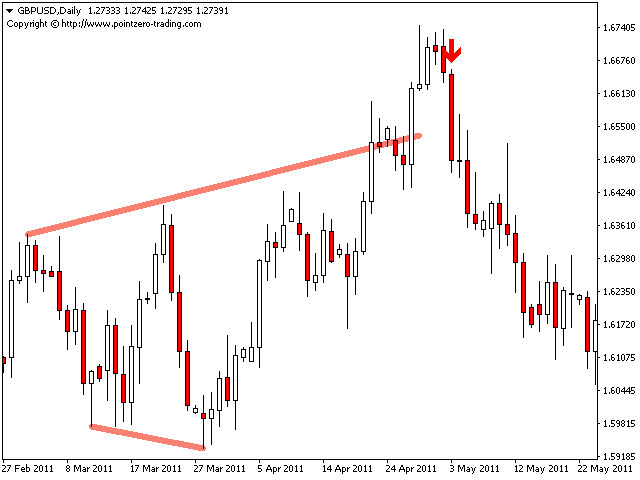
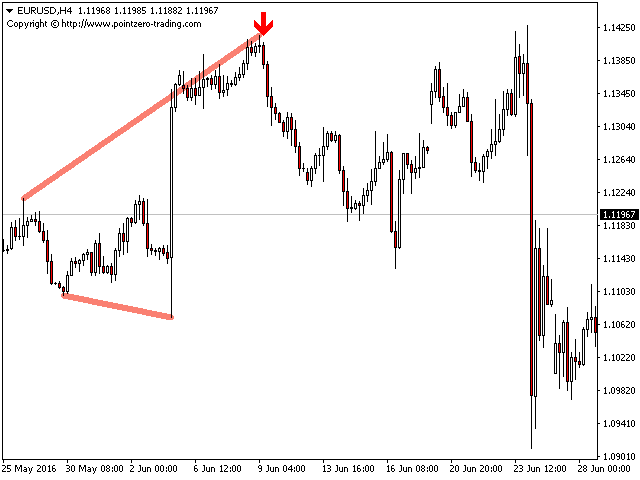
使用此指示器可以轻松找到扩音器样式。
[ 安装指南 | 更新指南 | 故障排除 | 常见问题 | 所有产品 ]
- 易于使用
- 可自定义的颜色和尺寸
- 它实现突破信号
- 它实现了各种警报
输入参数
- 模式的大小:要找到的模式的大小,表示为替代点之间的条形
- 最大。历史柱线:图表中要检查的过去柱线的数量
- 看涨形态的颜色:此参数不言自明
- 空头形态的颜色:此参数不言自明
- 标签的字体大小:图表中1-2-3标签的字体大小
- 线宽:图案线的大小
- 看涨突破的颜色:这是买入箭头的颜色
- 看跌突破的颜色:这是卖出箭头的颜色
- 箭头大小:这是图表中显示的箭头的大小
- 自定义警报名称:此图表中引发的警报的自定义标题
- 显示警报:启用或禁用屏幕警报
- 电子邮件警报:启用或禁用邮件警报。
- 推送警报:启用或禁用推送警报。
- 声音警报:启用或禁用声音警报。
- 声音文件:出现屏幕警报时播放的声音文件。
作者
ArturoLópezPérez,私人投资者和投机者,软件工程师,零零点交易解决方案的创始人。