• 概要
  • レビュー
  • コメント
  • 最新情報

PZ Megaphone

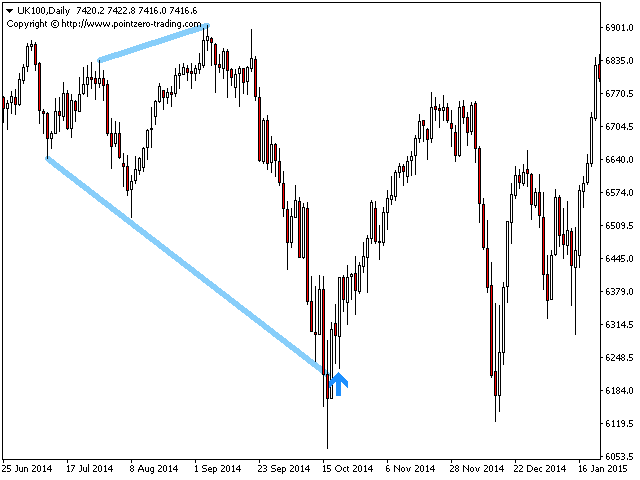
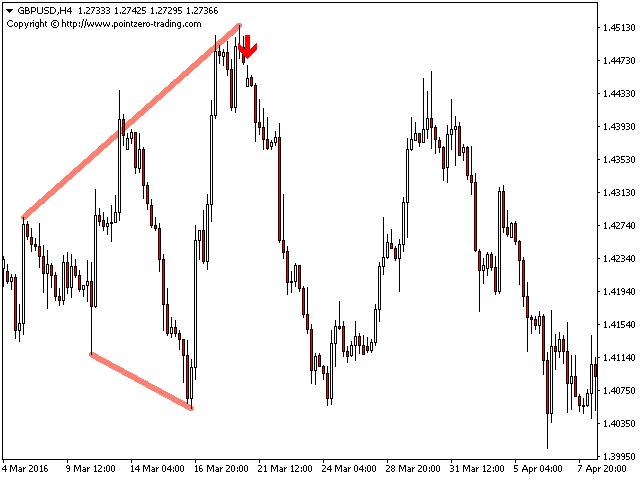
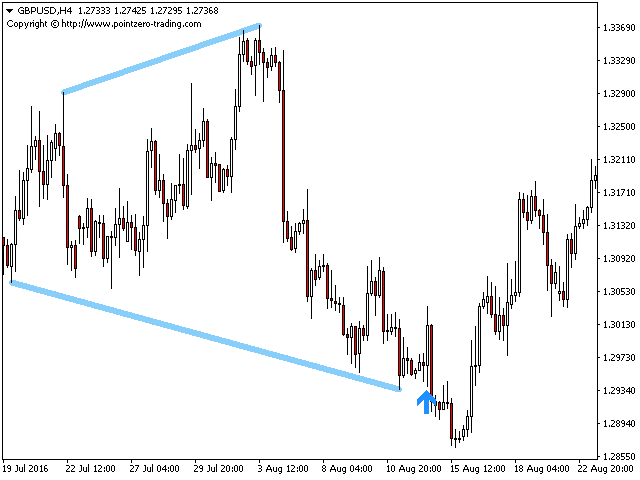
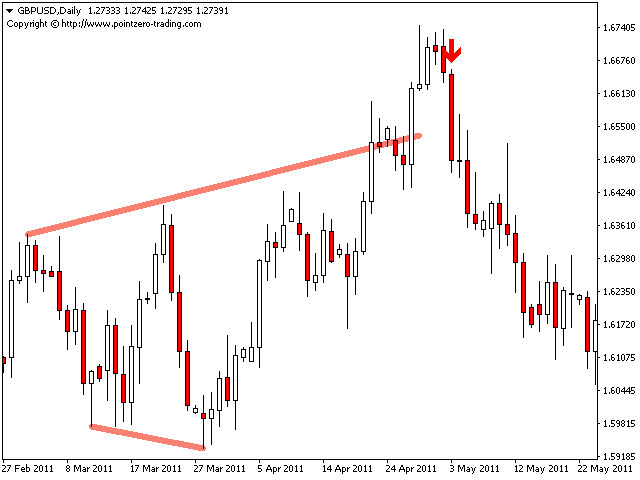
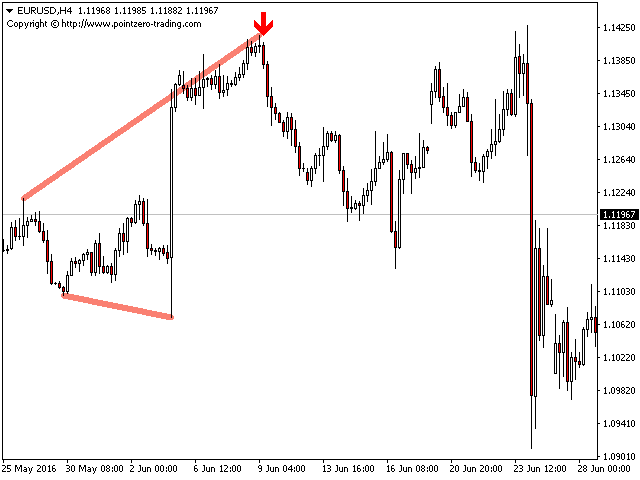
このインジケーターでメガホンパターンを簡単に見つけます。

[ インストールガイド | 更新ガイド | トラブルシューティング | よくある質問 | すべての製品 ]

  • 使いやすい
  • カスタマイズ可能な色とサイズ
  • ブレイクアウト信号を実装します
  • あらゆる種類のアラートを実装します


入力パラメータ

  • パターンのサイズ:検出されるパターンのサイズ。代替ポイント間のバーとして表されます
  • 最大履歴バー:チャートで調べる過去のバーの量
  • 強気パターンの色:このパラメーターは一目瞭然です
  • 弱気パターンの色:このパラメーターは一目瞭然です
  • ラベルのフォントサイズ:チャートの1-2-3ラベルのフォントサイズ
  • 線幅:パターン線のサイズ
  • 強気のブレイクアウトの色:これは購入矢印の色です
  • 弱気のブレイクアウトの色:これは売り矢印の色です
  • 矢印サイズ:これは、グラフに表示される矢印のサイズです
  • カスタムアラート名:このチャートで発生したアラートのカスタムキャプション
  • アラートの表示:画面アラートを有効または無効にします
  • メールアラート:メールアラートを有効または無効にします。
  • プッシュアラート:プッシュアラートを有効または無効にします。
  • サウンドアラート:サウンドアラートを有効または無効にします。
  • サウンドファイル:画面アラートが発生したときに再生するサウンドファイル。


著者

ArturoLópezPérez、個人投資家および投機家、ソフトウェアエンジニア、Point Zero Trading Solutionsの創設者。

おすすめのプロダクト
We present you the indicator "Candle closing counter", which will become your indispensable assistant in the world of trading. That’s why knowing when the candle will close can help: If you like to trade using candle patterns, you will know when the candle will be closed. This indicator will allow you to check if a known pattern has formed and if there is a possibility of trading. The indicator will help you to prepare for market opening and market closure. You can set a timer to create a p
Was: $249  Now: $99   Market Profile defines a number of day types that can help the trader to determine market behaviour. A key feature is the Value Area, representing the range of price action where 70% of trading took place. Understanding the Value Area can give traders valuable insight into market direction and establish the higher odds trade. It is an excellent addition to any system you may be using. Blahtech Limited presents their Market Profile indicator for the MetaTrader community. Ins
これは、キャンドルの終値を予測する指標です。 このインジケータは、主にD1チャートでの使用を目的としていますが. この指標は、従来の外国為替取引とバイナリオプション取引の両方に適しています。 インジケーターは、スタンドアロンのトレーディングシステムとして使用することも、既存のトレーディングシステムへの追加として機能させることもできます。 このインジケーターは、現在のキャンドルを分析し、キャンドル自体の内部の特定の強度係数と、前のキャンドルのパラメーターを計算します。 したがって、この指標は、市場の動きのさらなる方向性と現在のキャンドルの終値を予測します。 この方法のおかげで、この指標は、短期の日中取引だけでなく、中期および長期の取引にも適しています。 インジケーターを使用すると、市場の状況の分析中にインジケーターが生成する潜在的な信号の数を設定できます。 インジケーターの設定には、このための特別なパラメーターがあります。 また、インジケーターは、チャート上のメッセージの形式で、電子メールで、およびPUSH通知の形式で、新しい信号について通知することができます。 購入後は必ず私に書いて
This unique multi-currency strategy simultaneously determines the strength of trends and market entry points, visualizing this using histograms on the chart. The indicator is optimally adapted for trading on the timeframes М5, М15, М30, Н1. For the convenience of users, the indicator renders the entry point (in the form of an arrow), recommended take profit levels (TP1, TP2 with text labels) and the recommended Stop Loss level. The take profit levels (TP1, TP2) are automatically calculated for
"Pattern 123" is an indicator-a trading system built on a popular pattern, pattern 123. This is the moment when we expect a reversal on the older trend and enter the continuation of the small trend, its 3rd impulse. The indicator displays signals and markings on an open chart. You can enable/disable graphical constructions in the settings. The indicator has a built-in notification system (email, mobile terminal, standard terminal alert). "Pattern 123" has a table that displays signals from
フィボナッチリトレースと拡張ラインツール DiNapoliポイント取引方法とゴールデンセクション取引を使用するトレーダーにとって理想的なMT4プラットフォームのフィボナッチリトレースと拡張ラインツール 主な特長: あなたはフィボナッチリトレースメントの複数のセットを直接描くことができ、重要なリターンポイント間の関係は一目瞭然です。 2.フィボナッチ拡張を描画することができます。 3.フィボナッチフォールドバックとラインの延長は、簡単な観察と数値表示のために左右に動かすことができます。 4.チャートは非常に爽やかな 5.数字キーでサイクルを切り替えることができます。 ファンクションキー: 1。 [戻るを押す、要求に応じて描画する、最大8つのグループにする 2。拡張]を描くには[押す] 3。 \を押すと、現在のサイクルの下にあるすべての拡張機能と折り畳みが削除されます 4。フォールドバックを移動して削除して展開する (1)最初のフォールドバックセットのF5行をクリックします。 一度クリックすると(黄色に変わります)、キーボードのDel
The perfect tool for Scalng in the Forex markets You can trade both from signal to signal and using take profit  The algorithm does not use Zigzag!  No redrawing!  This is a channel instrument that uses a moving average as a filter. Moving Average  There are 2 parameters for the settings Ma Period = 5 period Moving Average  Channel 1.0 distance of channel lines from the chart Price Signal Filter - calculation of signal opening and filter There is a complete set of Alert There is a multi-timefram
Title : Market Bias Indicator - Oscillator-Based Trading Tool Introduction : Discover the potential of the "Market Bias Indicator," a revolutionary oscillator-based trading tool designed for precise market analysis. If you're in search of a robust alternative to traditional bias indicators, your quest ends here. Market Bias Indicator offers unparalleled accuracy in identifying market sentiment and is your gateway to confident trading decisions. Recommended Trading Pairs : Market Bias Indicator i
The Th3Eng PipFinite indicator is based on a very excellent analysis of the right trend direction with perfect custom algorithms. It show the true direction and the best point to start trading. With StopLoss point and Three Take Profit points. Also it show the right pivot of the price and small points to order to replace the dynamic support and resistance channel, Which surrounds the price. And Finally it draws a very helpful Box on the left side on the chart includes (take profits and Stop loss
マーケットシェーバー   マーケットスカルパー このインジケーターはRPTradeProSolutionsシステムの一部です。 Market Scalperは、プライスアクション、ダイナミックサポート、レジスタンスを使用した毎日のトレンド指標です。 誰でも使用できるように設計されており、トレーディングの初心者でも使用できます。 決して塗り直さないでください。 表示は近いものから近いものへと示されます。 単独で使用するように設計されているため、他のインジケーターは必要ありません。 明確でシンプルな表示を提供します どのように機能しますか MarketShaverはDualTimeFramesシステムを使用しています。 主な傾向はより高いTFによって取られますが、より速いものは取引を閉じるために使用されます トレードは1つずつ示され、同時に2つのトレードが存在することはありません。 マーケットシェーバーは次のことを示しています。 いつ取引するか いつそれを止めるか、利益か損失か。 貿易報酬 適切な期間終了TFを設定するのに役立つ多くの統計 マーケットシェーバーは動作します
This is the FXTraderariel-TakeProfit - Stop Loss Indicator . It provides you 3 potential Take Profits and 1 Stop Loss. These potential targets are computed based on several methods . The indicator can be used on every time frame, but we advise to use it on H1, H4 and D1. Especially if you are a novice trader. Pro Traders can also you use it for scalping in smaller time frames (M1, M5 and M15). This indicator is not a complete trading system. It doesn't provide you a Signal nor can predict the m
Heiken Ashi candle chart is an improved version of The Japanese candle chart, which can effectively filter the market "noise" of the Japanese candle chart. It is favored by many traders for its simplicity and intuition. For trend traders, the HA candle chart is a magic tool. Unlike the traditional Japanese candle chart, Heikenashi does not reflect the opening price, high price, low price and closing price of the market. Instead, Heikenashi calculates the value of a single K line in the dominant
Owl smart levels
Sergey Ermolov
4.63 (54)
MT5版  |   FAQ Owl Smart Levels Indicator   は、 Bill Williams   の高度なフラクタル、市場の正しい波構造を構築する Valable ZigZag、エントリの正確なレベルをマークする Fibonacci レベルなどの一般的な市場分析ツールを含む 1 つのインジケーター内の完全な取引システムです。 利益を得るために市場と場所に。 戦略の詳細な説明 インジケータを操作するための指示 顧問-取引助手 プライベートユーザーチャット ->購入後に私に書いて、私はプライベートチャットにあなたを追加し、あなたはそこにすべてのボーナスをダウンロードすることができます 力はシンプルさにあります! Owl Smart Levels   取引システムは非常に使いやすいので、専門家にも、市場を勉強し始めて自分で取引戦略を選択し始めたばかりの人にも適しています。 戦略と指標に秘密の数式や計算方法が隠されているわけではなく、すべての戦略指標は公開されています。 Owl Smart Levels を使用すると、取引を開始するためのシグナルをすばやく確認し、
This indicator monitors the market for a flat state and possible breakout. The flat state is detected as a predefined number of consecutive bars during which price fluctuates inside a small range. If one of the next bars closes outside the range, breakout is signaled. The indicator shows 3 lines: blue - upper bound of flat ranges AND consecutive breakout areas; red - lower bound of flat ranges AND consecutive breakout areas; yellow - center of flat ranges (NOT including breakout areas). When a b
How to use Pair Trading Station Pair Trading Station is recommended for H1 time frame and you can use it for any currency pairs. To generate buy and sell signal, follow few steps below to apply Pair Trading Station to your MetaTrader terminal. When you load Pair Trading Station on your chart, Pair Trading station will assess available historical data in your MetaTrader platforms for each currency pair. On your chart, the amount of historical data available will be displayed for each currency pai
ナイト ゴースト - バイナリ オプションの矢印インジケーター。 これからのあなたの頼もしいアシスタントです! 11 - チャートの再描画なし - すべての通貨ペアで大活躍! -インジケータの精度は最大 90% (特に夜間) ・長時間の設定不要(バイナリーオプションに最適な設定) - 信号が遅れない - 現在のローソク足でのシグナルの出現 ・M1期にピッタリ(No More!) ・目に優しいキャンドルカラー(赤・青) -インストールされたアラート それを扱う: - 青い矢印は信号アップを示します -赤い下向き矢印 M1 以上のインジケーターをチャートに配置しないでください. シグナルの精度が低下します! インジケーターのスクリーンショットとビデオを見る
The indicator shows you buy/sell signals and does not repaint. It works well with almost all pairs, while the best ones are GBPUSD, XAUUSD and EURUSD. The product works better on H1 and H4. You can change the parameters in the inputs tab to get the best signals and the best trade results on each pair. You can enable/disable alerts when signal appears. The indicator is easy to use. Parameters barstrip & Sensitive: amount of bars to process the highest and lowest prices (relates to the internal
Noize Absorption Index - is the manual trading system that measures the difference of pressure between bears forces and bulls forces. Green line - is a noize free index that showing curent situation. Zero value of index shows totally choppy/flat market.Values above zero level shows how powerfull bullish wave is and values below zero measures bearish forces.Up arrow appears on bearish market when it's ready to reverse, dn arrow appears on weak bullish market, as a result of reverse expectation. S
The new update makes this indicator a complete tool for studying, analyzing and operating probabilistic patterns. It includes: On-chart Multi-asset percentage monitor. Configurable martingales. Twenty-one pre-configured patterns , including Mhi patterns and C3. An advanced pattern editor to store up to 5 custom patterns. Backtest mode to test results with loss reports. Trend filter. Hit operational filter. Martingale Cycles option. Various types of strategies and alerts. Confluence between patte
Please follow the "How To Trade" instructions exactly for best results Wycoff theory is vastly used by institutional traders but when it comes to retail traders the concept isn't well understood by most. It is even more difficult to implement in intraday & swing trading. This No REPAINT indicator helps you in analyzing the market cycles and plots buy/sell signals at the start of trending phase. It studies the market strength of bulls and bears and does a effort Vs reward matrix calculation befor
The Strategy Tester product is an indicator where you can both test and run strategies. There are 64 strategies in total in this indicator. It uses 3 indicators. You can test tens of thousands of strategies by changing the parameter settings of these indicators. You can run 6 strategies at the same time. With this product, you will now create your own signals. Recommendations and Features Used indicators: Stochastic, Macd, Williams Percent Range It works on all time frame   Recommended time f
This is a trend indicator without redrawing Developed instead of the binary options strategy (by the color of the Martingale candlestick) Also works well in forex trading When to open trades (binary options) A signal will appear in the place with a candle signaling the current candle It is recommended to open a deal for one candle of the current timeframe M1 and M5 When a blue dot appears, open a deal up When a red dot appears, open a trade down. How to open trades on Forex. When a signal is rec
Trend Bilio - an arrow indicator without redrawing shows potential market entry points in the form of arrows of the corresponding color: upward red arrows suggest opening a buy, green down arrows - selling. The entrance is supposed to be at the next bar after the pointer. The arrow indicator Trend Bilio visually "unloads" the price chart and saves time for analysis: no signal - no deal, if an opposite signal appears, then the current deal should be closed. It is Trend Bilio that is considered
The   Strategy Tester   product is an indicator where you can both test and run strategies. There are 64 strategies in total in this indicator. It uses 3 indicators. You can test tens of thousands of strategies by changing the parameter settings of these indicators. You can run 6 strategies at the same time. With this product, you will now create your own signals. Recommendations and Features Used indicators:   Rsi, Bears power, Stochastic It works on all   time frame   Recommended time frame
Pro Magic Signal   indicator is designed for signal trading. This indicator generates trend signals.  It uses many algorithms and indicators to generate this signal. It tries to generate a signal from the points with the highest trend potential. This indicator is a complete trading product. This indicator does not need any additional indicators.  The indicator certainly does not repaint. The point at which the signal is given does not change.  Thanks to the alert features you can get the signals
Credible Cross System   indicator is designed for signal trading. This indicator generates trend signals. It uses many algorithms and indicators to generate this signal. It tries to generate a signal from the points with the highest trend potential. The indicator works based on instant price movements. This indicator is a complete trading product. This indicator does not need any additional indicators. The indicator certainly does not repaint. The point at which the signal is given does not
Volume Profile Indicator for MT4 Gain a trading edge with the "Volume Profile" indicator for MetaTrader 4 (MT4). This advanced technical analysis tool allows you to precisely identify key support and resistance levels based on transaction volume. Easily visualize market areas of high interest, where trading volumes are highest, and use this information to make more informed trading decisions. Key Features: Clear and detailed visualization : The indicator displays volume histograms directly on th
Consolidations
Rofhiwa Bruce Nthulane
5 (1)
What if you could see trouble from far, just imagine having some ability to foresee danger. This indicator has the ability to see consolidations before they are clear to everyone else. In the market everything is always fun until the market starts consolidating and often times by the time people realise it it's often too late. This Indicator will spot consolidations very fast and let you know at the top right of the chart so that you can either avoid losses by stopping to trade using trend follo
矢印を再描画しない外国為替スキャルピング インジケーター。 M5、M15、M30、H1 の時間枠で最適に機能します。デフォルト設定は M5 時間枠用です。下の図は、「期間 = 0.35」パラメーター値を使用して H1 チャートで作業する例を示しています。デモ版をダウンロードして、自分でテストできます。現在、ほとんどすべてのスキャルピング戦略でこのインジケーターのシグナルを使用しています。私たちの計算によると、そのシグナルの精度は時間枠に応じて約 95% です。このインジケーターは、すべての通貨ペアで機能します。すべての主要通貨ペアと金属でテストしました。どこでも±95%のほぼ同じ精度が得られました。 インジケーターの利点: 矢印を再描画しません すべての通貨ペアで動作します 高い信号精度 スキャルピングに良い インジケーターの設定: period - 信号精度を計算するための期間。 price - インジケーターにどの価格を使用するかを指示します: CLOSE、OPEN、HIGH、LOW。デフォルトでは、インディケータは CLOSE 価格で動作します。
このプロダクトを購入した人は以下も購入しています
Gold Stuff
Vasiliy Strukov
4.89 (265)
Gold Stuff は、金専用に設計されたトレンド指標であり、あらゆる金融商品にも使用できます。 インジケーターは再描画せず、遅れません。 推奨時間枠 H1. それインディケータでフルオートExpert Advisor EA Gold Stuffが動作します。 あなたは私のプロフィールでそれを見つけることができます. 設定と個人的なボーナスを得るために、購入後すぐに私に連絡してください! トレンド スキャナーの強力なサポートを利用して、無料のインジケーターを入手し、プライバシーを守ります。あーみー!   設定 矢印を描く - オンオフ。 チャートに矢印を描く。 アラート - 可聴アラートのオンオフ。 メール通知 - オンオフ。 電子メール通知。 プチ通知 - オンオフ。 プッシュ通知。 次に、色域を調整します。 Gold Stuff は、金専用に設計されたトレンド指標であり、あらゆる金融商品にも使用できます。 インジケーターは再描画せず、遅れません。 推奨時間枠 H1. それインディケータでフルオートExpert Advisor EA Gold Stuff
An exclusive indicator that utilizes an innovative algorithm to swiftly and accurately determine the market trend. The indicator automatically calculates opening, closing, and profit levels, providing detailed trading statistics. With these features, you can choose the most appropriate trading instrument for the current market conditions. Additionally, you can easily integrate your own arrow indicators into Scalper Inside Pro to quickly evaluate their statistics and profitability. Scalper Inside
Reversal First Impulse levels (RFI)    INSTRUCTIONS        RUS       -       ENG              R ecommended to use with an indicator   -   TPSpro  TREND PRO -  Version MT5 A key element in trading is zones or levels from which decisions to buy or sell a trading instrument are made. Despite attempts by major players to conceal their presence in the market, they inevitably leave traces. Our task was to learn how to identify these traces and interpret them correctly. Main functions: Displaying activ
現在26%オフ 初心者やエキスパートトレーダーに最適なソリューション! このインジケーターは、独自の機能と新しい計算式を取り入れた、ユニークで高品質、かつ手頃な価格のトレーディングツールです。たった1枚のチャートで28の為替ペアの通貨強度を読み取ることができます。新しいトレンドやスキャルピングチャンスの引き金となるポイントを正確に特定することができるので、あなたのトレードがどのように改善されるか想像してみてください。 ユーザーマニュアルはこちら  https://www.mql5.com/en/blogs/post/697384 これが最初の1本、オリジナルだ! 価値のないクローンを買わないでください。 特別な サブウィンドウの矢印で強い通貨の勢いを表示 GAPがあなたのトレードを導く! 基準通貨や気配値が売られすぎ・買われすぎのゾーン(外相フィボナッチレベル)にあるとき、個別チャートのメインウィンドウに警告表示。 通貨がレンジの外側から反落した場合、プルバック/リバーサルのアラート。 クロスパターンの特別なアラート 複数の時間枠を選択可能で、トレンドを素早く
このインディケータは、当社の2つの製品 Advanced Currency IMPULSE with ALERT  +   Currency Strength Exotics . のスーパーコンビネーションです。 このインジケーターは全ての時間枠で作動し、8つの主要通貨と1つのシンボルの強弱のインパルスをグラフで表示します。 このインジケータは、金、エキゾチックペア、商品、インデックス、先物など、あらゆるシンボルの通貨強度の加速度を表示することに特化されています。金、銀、原油、DAX、US30、MXN、TRY、CNHなどの通貨強度の加速度(インパルスまたは速度)を表示するために、任意のシンボルを9行目に追加できる、この種の最初のものです。 新しいアルゴリズムに基づいて構築され、潜在的な取引の特定と確認がさらに容易になりました。これは、通貨の強さや弱さが加速しているかどうかをグラフィカルに表示し、その加速の速度を測定するためです。加速すると物事は明らかに速く進みますが、これはFX市場でも同じです。つまり、反対方向に加速している通貨をペアリングすれば、潜在的に利益を生む取
mql5と Telegramの モーニング・ブリーフィングで、詳細とスクリーンショットを含む毎日のマーケット・アップデートをご覧 ください! FX Power MT4 NGは 、長年の人気を誇る通貨強度計FX Powerの次世代モデルです。 この次世代ストレングスメーターは何を提供するのでしょうか?初代FXパワーの魅力すべて プラス GOLD/XAUの強さ分析 より正確な計算結果 個別に設定可能な分析期間 カスタマイズ可能な計算上限値により、さらに優れたパフォーマンスを実現 もっと見たい人のための特別なマルチインスタンス設定 すべてのチャートでお好みの色を無限に設定可能 数え切れないほどの通知オプションにより、重要なことを見逃すことはありません。 Windows 11とmacOSのスタイルで角を丸くした新しいデザイン 魔法のように動くインジケーターパネル FXパワーの主な機能 すべての主要通貨の強さの完全な履歴 すべての時間枠における通貨の強さの履歴 すべてのブローカーとチャートで同一の計算結果 100%信頼できるリアルタイム計算 -> リペイントなし ドロップダウン・リストから
現在20%OFF! 初心者やエキスパートトレーダーのためのベストソリューション! このダッシュボードソフトウェアは、28の通貨ペアで動作しています。それは私達の主要な指標(高度な通貨の強さ28と高度な通貨インパルス)の2に基づいています。それは全体の外国為替市場の大きい概観を与えます。それは、すべての(9)時間枠で28の外国為替ペアのための高度な通貨の強さの値、通貨の動きの速度と信号を示しています。チャート上で1つのインディケータを使用して市場全体を観察し、トレンドやスキャルピングの機会をピンポイントで見つけることができたら、あなたのトレードがどのように改善されるか想像してみてください。 このインディケータには、強い通貨と弱い通貨の識別、潜在的な取引の識別と確認がより簡単になるような機能が搭載されています。このインディケータは、通貨の強さや弱さが増加しているか減少しているか、また、すべての時間枠でどのように機能しているかをグラフィカルに表示します。 新機能として、現在の市場環境の変化に適応するダイナミックなマーケットフィボナッチレベルが追加され、すでに当社のAdvan
まず第一に、この取引インジケーターは再描画されず、再描画されず、遅延しないことを強調する価値があります。これにより、手動取引とロボット取引の両方に理想的なものになります。 ユーザーマニュアル:設定、入力、戦略。 アトミックアナリストは、価格の強さとモメンタムを利用して市場でより良いエッジを見つけるためのPA価格アクションインジケーターです。ノイズや誤ったシグナルを除去し、取引ポテンシャルを高めるための高度なフィルターを備えています。複雑なインジケーターの複数のレイヤーを使用して、アトミックアナリストはチャートをスキャンし、複雑な数学的計算をシンプルなシグナルと色に変換します。これにより、どのような初心者トレーダーでも理解して使用し、一貫した取引の決定を行うことができます。 「アトミックアナリスト」は、新規および経験豊富なトレーダー向けにカスタマイズされた包括的な取引ソリューションです。プレミアムインジケーターとトップノッチの機能を1つの取引戦略に組み合わせ、すべてのタイプのトレーダーにとって汎用性のある選択肢にします。 デイリートレーディングとスキャルピング戦略:高
TPSpro TRENDPRO  - is a trend indicator that automatically analyzes the market and provides information about the trend and each of its changes, as well as giving signals for entering trades without redrawing! The indicator uses each candle, analyzing them separately. referring to different impulses - up or down impulse. Exact entry points into transactions for currencies, crypto, metals, stocks, indices!  -  Version MT5               DETAILED DESCRIPTION                R ecommended to use with
Indicator : RealValueIndicator Description : RealValueIndicator is a powerful tool designed specifically for trading on the EURUSD pair. This indicator analyzes all EUR and USD pairs, calculates their real currency strength values, and displays them as a single realistic value to give you a head start on price. This indicator will tell you moves before they happen if you use it right. RealValueIndicator allows you to get a quick and accurate overview of the EURUSD currency pair tops and bottoms,
ご紹介   クォンタム トレンド スナイパー インジケーターは 、トレンド反転を特定して取引する方法を変革する画期的な MQL5 インジケーターです。 13年以上の取引経験を持つ経験豊富なトレーダーのチームによって開発されました。     クォンタムトレンドスナイパーインジケーター   は、非常に高い精度でトレンドの反転を識別する革新的な方法で、あなたのトレーディングの旅を新たな高みに押し上げるように設計されています。 ***Quantum Trend Sniper Indicatorを購入すると、Quantum Breakout Indicatorを無料で入手できます!*** クォンタム ブレイクアウト インジケーターは、トレンドの反転を特定するとアラートを発し、矢印を示し、3 つのテイクプロフィットレベルを提案します。 初心者トレーダーにもプロのトレーダーにも適しています。 量子EAチャネル:       ここをクリック MT5のバージョン:       ここをクリック 推奨事項: 期間: すべての時間枠。最良の結果を得るには、
現在31%オフ! 初心者やエキスパートトレーダーに最適なソリューション! このインジケータは、独自の機能と秘密の数式を組み込んだ、ユニークで高品質かつ手頃な価格のトレーディングツールです。たった1枚のチャートで28の通貨ペアのアラートを表示します。新しいトレンドやスキャルピングチャンスの引き金となるポイントを正確に把握することができるので、あなたのトレードがどのように改善されるか想像してみてください! 新しい基本的なアルゴリズムに基づいて構築されているため、潜在的な取引の特定と確認がより簡単になります。これは、通貨の強さや弱さが加速しているかどうかをグラフィカルに表示し、その加速のスピードを測定するためです。加速すると物事は明らかに速く進みますが、これはFX市場でも同じです。つまり、反対方向に加速している通貨をペアにすれば、利益を生む可能性のある取引を特定することができるのです。 通貨の勢いを示す縦の線と矢印は、あなたの取引の指針となるでしょう。 ダイナミックマーケットフィボナッチ23レベルはアラートトリガーとして使用され、市場の動きに適応します。もしインパルスが黄色
TrendMaestro
Stefano Frisetti
5 (3)
note: this indicator is for METATRADER4, if you want the version for METATRADER5 this is the link:  https://www.mql5.com/it/market/product/108106 TRENDMAESTRO ver 2.4 TRENDMAESTRO recognizes a new TREND in the bud, he never makes mistakes. The certainty of identifying a new TREND is priceless. DESCRIPTION TRENDMAESTRO identifies a new TREND in the bud, this indicator examines the volatility, volumes and momentum to identify the moment in which there is an explosion of one or more of these data a
Advanced Supply Demand
Bernhard Schweigert
4.92 (313)
現在33%オフ 初心者にもエキスパートトレーダーにも最適なソリューション このインジケーターは独自の機能と新しい公式を多数内蔵しており、ユニークで高品質かつ手頃な取引ツールです。このアップデートでは、2つの時間枠ゾーンを表示できるようになります。より長いTFだけでなく、チャートTFとより長いTF(ネストゾーンを表示)の両方を表示できます。すべてのSupply Demandトレーダーの皆さんのお気に召すはずです。:) 重要情報の公開 Advanced Supply Demandの可能性を最大化するには、 https://www.mql5.com/ja/blogs/post/720245 にアクセスしてください。   エントリーまたはターゲットの正確なトリガーポイントを正確に特定できれば取引がどのように改善されるか想像してみてください。新しい基盤となるアルゴリズムに基づいて構築されているため、買い手と売り手の間の潜在的な不均衡をさらに簡単に特定できます。これは、最も強い需要と供給のゾーンと、過去のパフォーマンス(古いゾーンを表示)がグラフィカルに表現されるためです。これらの機能は、最適
JULY OFFER 80% OFF next price for unlimited version will be 17000$. This is the only time you can get this institutional and professional indicator at this price for unlimited version. Don't dare to miss this. The tool I am about to introduce to you you can't compare it with other tools due to its strategy and accuracy level in predicting the next price directional movement . This tool is designed for serious traders who have decided to make a difference through trading. Be the next person to wi
ご紹介     Quantum Breakout PRO は 、ブレイクアウト ゾーンの取引方法を変革する画期的な MQL5 インジケーターです。 13年以上の取引経験を持つ経験豊富なトレーダーのチームによって開発された Quantum Breakout PROは 、革新的でダイナミックなブレイクアウトゾーン戦略により、あなたの取引の旅を新たな高みに押し上げるように設計されています。 クォンタム ブレイクアウト インジケーターは、5 つの利益ターゲット ゾーンを備えたブレイクアウト ゾーン上のシグナル矢印と、ブレイクアウト ボックスに基づいたストップロスの提案を提供します。 初心者トレーダーにもプロのトレーダーにも適しています。 量子EAチャネル:       ここをクリック MT5バージョン:   ここをクリック 重要!購入後、インストールマニュアルを受け取るためにプライベートメッセージを送ってください。 推奨事項: 時間枠: M15 通貨ペア: GBPJPY、EURJPY、USDJPY、NZDUSD、XAUUSD アカウントの種類: ECN、Raw、また
FX Volume
Daniel Stein
4.61 (36)
mql5と Telegramの モーニング・ブリーフィングで、詳細とスクリーンショットを含む毎日のマーケット・アップデートをご覧 ください! FX Volumeは、ブローカーの視点から市場のセンチメントをリアルに洞察する、最初で唯一の出来高インジケーターです。 ブローカーのような機関投資家が外国為替市場でどのようなポジションをとっているか、COTレポートよりもはるかに速く、素晴らしい洞察を提供します。 この情報をチャート上で直接見ることは、あなたの取引にとって真のゲームチェンジャーであり、画期的なソリューションです。 以下のようなユニークなマーケットデータ洞察から利益を得てください。 比率は 、通貨のロングポジションとショートポジションの比率をパーセントで表示します。 比率の変化は 、選択した期間内のロング比率とその変化率を表示します。 Volumes Totalは 、通貨の取引量(ロングとショート)の合計をロット単位で表示します。 Volumes Long :全通貨のロングポジションの取引量を表示します。 Volumes(ショート )は、全通貨のショートポジションの取引量を表示
Cycle Sniper
Elmira Memish
4.41 (37)
NEW YEAR SALE PRICE FOR LIMITED TIME!!! Please contact us after your purchase and we will send you the complimentary indicators to complete the system Cycle Sniper is not a holy grail but when you use it in a system which is explained in the videos, you will feel the difference. If you are not willing to focus on the charts designed with Cycle Sniper and other free tools we provide, we recommend not buying this indicator. We recommend watching the videos about the indiactor and system before pu
これはMT4のインジケーターで、再描画なしで取引に参入するための正確なシグナルを提供します。 外国為替、暗号通貨、金属、株式、インデックスなど、あらゆる金融資産に適用できます。かなり正確な見積もりを提供し、取引を開始して終了するのに最適な時期を教えてくれます。1つのシグナルを処理しただけでインジケーターの元が取れた例の 動画 (6:22)をご覧ください。Entry PointsPro インジケーターの助けを借りたほとんどのトレーダーの最初の1週間の結果が改善しています。 Telegramグループ に登録してください。Entry Points Proインジケーターのメリットは次の通りです。 再描画のないエントリーシグナル 再描画されるインジケーターでは一度表示されたシグナルが削除されて大きな金銭的損失につながることがありますが、これと異なり、表示されて確認されたシグナルは消えることがありません。 エラーなしの取引開始 インジケーターアルゴリズムによって取引を開始する(資産を売買する)理想的な瞬間を見つけることができます。それを使用するすべてのトレーダーの成功率が向上します。
The Volumebyprice.com Indicator for MetaTrader 4 features Volume Profile and Market Profile TPO (Time Price Opportunity). Volume and TPO histogram bar and line charts. Volume Footprint charts. TPO letter and block marker collapsed and split structure charts. Static, dynamic and flexible range segmentation and compositing methods with relative and absolute visualizations. Session hours filtering and segment concatenation with Market Watch and custom user specifications. Graphical layering, posit
The AT Forex Indicator MT4 is a sophisticated trading tool designed to provide traders with a comprehensive analysis of multiple currency pairs. This   powerful indicator   simplifies the complex nature of the forex market, making it accessible for both novice and experienced traders. AT Forex Indicator uses   advanced algorithms   to detect trends, patterns and is an essential tool for traders aiming to enhance their forex trading performance. With its robust features, ease of use, and reliabl
NAM Order Blocks
NAM TECH GROUP, CORP.
5 (1)
MT4マルチタイムフレームオーダーブロック検出インジケーター。 特徴 -チャートコントロールパネルで完全にカスタマイズ可能で、完全な相互作用を提供します。 -必要な場所でコントロールパネルを表示および非表示にします。 -複数の時間枠でOBを検出します。 -表示するOBの数量を選択します。 -さまざまなOBユーザーインターフェイス。 -OBのさまざまなフィルター。 -OB近接アラート。 -ADRの高線と低線。 -通知サービス(画面アラート|プッシュ通知)。 概要 注文ブロックは、金融機関や銀行からの注文収集を示す市場行動です。著名な金融機関と中央銀行が外国為替市場を牽引しています。したがって、トレーダーは市場で何をしているのかを知る必要があります。市場が注文ブロックを構築するとき、それは投資決定のほとんどが行われる範囲のように動きます。 注文の構築が完了すると、市場は上向きと下向きの両方に向かって急激に動きます。注文ブロック取引戦略の重要な用語は、機関投資家が行っていることを含むことです。それらは主要な価格ドライバーであるため、機関投
プレシジョン・インデックス・オシレーター(Pi-Osc)は、Precision Trading SystemsのRoger Medcalfによるものです。 バージョン2は、チャートにスーパーファストでロードされるように注意深く再コードされ、その他の技術的な改良も組み込まれて、エクスペリエンスを向上させています。 Pi-Oscは、市場が強制的に行かなければならない、すべての人のストップを取り除くためのポイントである、極限のエクソースト・ポイントを見つけるために設計された正確な取引タイミング信号を提供するために作成されました。 この製品は、極限のポイントがどこにあるかを知るという古代の問題を解決し、トレーダーの生活をはるかにシンプルにします。 これは、業界標準のオシレーターとは異なる強力な要素を持つ高度なコンセンサス・インジケーターです。 使用されている一部の機能には、需要指数、マネーフロー、RSI、スティリング、パターン認識、出来高分析、標準偏差の極値などがあり、異なる長さでこれらのバリエーションが多く含まれています。 初めて見ると、訓練されていない目には、他の
MTF Supply Demand Zones
Georgios Kalomoiropoulos
4.83 (23)
次世代の自動化された需要と供給のゾーン。どのチャートでも機能する新しい革新的なアルゴリズム。すべてのゾーンは、市場の価格行動に従って動的に作成されています。 2種類のアラート --> 1) 価格がゾーンに達したとき 2) 新しいゾーンが形成されたとき もう 1 つの役に立たない指標はありません。実績のある完全な取引戦略を手に入れることができます。     新機能:     価格が需給ゾーンに達したときにアラートを出す     新しい需給ゾーンが作成されたときにアラートを発します     プッシュ通知アラート     ピップ単位のゾーン幅ラベル     MTF のもう 1 つのタイムフレーム。したがって、現在より 2 時間足高いのではなく、現在より 3 時間足し上に見えるようになります。     アラート/ゾーン/MTF 機能を有効/無効にするボタン あなたが得る利点:     取引から感情を取り除きます。     取引エントリをオブジェクト化します。     確率の高いセットアップで利益
Enigmera
Ivan Stefanov
5 (4)
エニグメラ:市場の中核 https://www.enigmera.com はじめに このインディケータと取引システムは、金融市場に対する驚くべきアプローチです。ENIGMERAは、フラクタルサイクルを使用して、サポートとレジスタンスレベルを正確に計算します。本格的な蓄積局面を示し、方向性と目標を示します。 トレンド中でも調整中でも機能するシステムです。 どのように作動するのか? ENIGMERAは、支持線・抵抗線、目標線、乖離線の3つのラインで構成されています。このシステムは、過去のデータを現在と未来に外挿する典型的な市場指標とは異なり、現在の完全な画像を提供します。支持線上にある場合、それは本当の支持を意味し、抵抗線上にある場合、それは本当の抵抗を意味する。ある水準が破られた場合、それはトレンドの変化を意味する。再描画はしない。 市場は常に進化しているため、ENIGMERAはその評価ツールを適応させ、定期的に戦略を修正しています。  これにより、すべてのシナリオが徹底的に評価されることが保証されます。この市場指標の独自性は、その能力を見れば明らかです。  ENIGM
ZeusArrow Smart Liquidity Finder  Smart Liquidity Finder is Ai controlled indicator based on the Idea of Your SL is My Entry. It scan and draws the major Liquidity areas on chart partitioning them with Premium and Discount Zone and allows you find the best possible trading setups and help you decide the perfect entry price to avoid getting your Stop Loss hunted . Now no more confusion about when to enter and where to enter. Benefit from this one of it's kind trading tool powered by Ai an trade
Welcome to the world of SMC (Smart Money Concepts) Trading, where we empower traders with the tools and knowledge to make smarter trading decisions. Our latest addition to our suite of trading tools is the SMC Trading Pro indicator, version 1.0. Key Features: Major Market Structure Identification with BODY break. Order Block must be in Major Swing ( not Small Swing ). Order Block with Fair Value Gap Detection. Order Block in Discount | Premium zone. Filter for only Bullish, Bearish or All Order
The Reversal Master is an indicator for determining the current direction of price movement and reversal points. The indicator will be useful for those who want to see the current market situation better. The indicator can be used as an add-on for ready-made trading systems, or as an independent tool, or to develop your own trading systems. The Reversal Master indicator, to determine the reversal points,  analyzes a lot of conditions since the combined analysis gives a more accurate picture of t
A. A2SR とは何ですか ?   * 先行テクニカル指標です (塗り直しなし、ラグなし)。 -- ガイダンス : -- https://www.mql5.com/en/blogs/post/734748/page4#comment_16532516 -- そして https://www.mql5.com/en/users/yohana/blog A2SR には、サポート (需要) とレジスタンス (供給) のレベルを決定する特別な手法があります。 ネットで見かける通常の方法とは異なり、A2SR は実際の SR レベルを決定する独自のコンセプトを持っています。 元の手法はインターネットから取得されたものではなく、インターネット上で公開されたこともありません。 A2SR は、取引スタイルに応じて SR レベルを自動選択します。 時間枠を変更しても、SR レベルはその位置にとどまります。 実際のSRは、使用する時間枠から取得されるわけではないため. A2SR には、取引のための完全な手段があります 。 実際のサポート (需要) とレジスタンス (供給) の真のコンセプト。
This indicator uses support and resistance, volume and some special formula to calculate the volume to filter the candles. If the volume reaches a specific value, And at the same time, Candle breaks the support/resistance line, There would be a signal and we can enter the market. Signals appear when the current candle closes. then you can enter the trade when a new candle appears. Please don't forget to follow your money management plan. MT5 Version Support/Resistance Breakout MT5 :   https:
作者のその他のプロダクト
これはほぼ間違いなく、MetaTraderプラットフォームで見つけることができる最も完全な調和価格形成自動認識インジケーターです。 19種類のパターンを検出し、フィボナッチプロジェクションをあなたと同じように真剣に受け止め、潜在的逆転ゾーン(PRZ)を表示し、適切なストップロスとテイクプロフィットレベルを見つけます。 [ インストールガイド | 更新ガイド | トラブルシューティング | よくある質問 | すべての製品 ] 19の異なる調和価格形成を検出します プライマリ、派生および補完フィボナッチ投影(PRZ)をプロットします 過去の価格行動を評価し、過去のすべてのパターンを表示します この指標は、独自の品質とパフォーマンスを分析します 適切なストップロスとテイクプロフィットのレベルを表示します ブレイクアウトを使用して適切な取引を通知します すべてのパターン比をグラフにプロットします 電子メール/音声/視覚アラートを実装します スコット・M・カーニーの本に着想を得て、この指標は最も純粋で急を要するトレーダーのニーズを満たすように設計されています。ただし、トレードを
This is the latest iteration of my famous indicator, Reversal Fractals, published for the first time almost a decade ago. It examines the price structure of fractals to determine possible reversal points in the market, providing timing to positional traders that already have a fundamental or technical valuation model. [ Installation Guide | Update Guide | Troubleshooting | FAQ | All Products ] Reversal fractals can start long trends The indicator is non repainting It implements alerts of all k
FREE
これは、ほぼ10年前に初めて公開された私の有名なスキャルパー、ゴールドフィンチEAの最新版です。短期間で起こる急激なボラティリティの拡大で市場をスキャルピングします。突然の価格上昇の後、価格変動の慣性を利用しようとします。この新しいバージョンは、トレーダーがテスターの最適化機能を簡単に使用して最適な取引パラメーターを見つけられるように簡素化されています。 [ インストールガイド | 更新ガイド | トラブルシューティング | よくある質問 | すべての製品 ] 最適化を容易にするシンプルな入力パラメーター カスタマイズ可能な取引管理設定 取引セッションの選択 平日の選択 資金管理 注意してください... 多くの要因が見返りを台無しにする可能性があるため、ダニのダフ屋は危険です。変動スプレッドとスリッページは、取引の数学的期待値を低下させ、ブローカーからの低いティック密度は幻の取引を引き起こす可能性があり、ストップレベルは利益を確保する能力を損ない、ネットワークラグはリクオートを意味します。注意が必要です。 バックテスト Expert Advisorはティックデータのみを使
FREE
このインジケータは、30を超える日本のローソク足パターンを認識し、チャート上でそれらを美しく強調します。それは、価格行動トレーダーがなしでは生きていけない指標の1つにすぎません。 一晩でテクニカル分析を強化 日本のローソク足パターンを簡単に検出 信頼できる普遍的な反転パターンを取引する 継続パターンを使用して、確立されたトレンドに安全に飛び乗る インジケーターは再描画されず、アラートを実装します インジケーターは、マルチタイムフレーム ダッシュボードを 実装します チャートが非常に多くのパターンを検出するため、チャートが非常に乱雑に見え、読みにくくなります。トレーダーは、チャートをより読みやすくするために、インディケーター入力から望ましくないパターンを無効にする必要があるかもしれません。 1小節、2小節、3小節、および多小節のパターンを検出します 反転、継続、および脆弱性のパターンを検出します パターンは有効または無効にできます 強気のパターンは 青 、弱気のパターンは 赤 、中立のパターンは 灰色で ラベル付けされてい ます 。 検出されたローソク足パターンのリスト 1バーから
トレンドトレーディング は、タイミングのプルバックとブレイクアウトにより、市場で起こっているトレンドから可能な限り利益を得るように設計された指標です。確立されたトレンドの中で価格が何をしているかを分析することにより、取引の機会を見つけます。 [ インストールガイド | 更新ガイド | トラブルシューティング | よくある質問 | すべての製品 ] 自信を持って効率的に金融市場を取引する むち打ちにならずに確立されたトレンドから利益を得る 収益性の高いプルバック、ブレイクアウト、早期の逆転を認識する この指標は、独自の品質とパフォーマンスを分析します 複数時間枠のダッシュボードを実装します インジケーターは再描画されていません 電子メール/音声/視覚アラートを実装します 確立されたトレンドは多くの取引機会を提供しますが、ほとんどのトレンド指標はそれらを完全に無視しています。インジケーターの解釈はかなり簡単です: (1) トレンドの変化 (2) トレンドの方向への後退 (3) トレンドの方向へのブレイクアウト 赤いダッシュ は下降トレンド中の修正です 青いダッシュ は上昇ト
スイングトレーディング は、トレンドの方向のスイングと可能な反転スイングを検出するように設計された最初のインジケーターです。トレーディングの文献で広く説明されているベースラインスイングトレーディングアプローチを使用します。インディケータは、いくつかの価格と時間のベクトルを調査して、全体的なトレンドの方向を追跡し、市場が売られ過ぎまたは買われ過ぎて修正の準備ができている状況を検出します。 [ インストールガイド | 更新ガイド | トラブルシューティング | よくある質問 | すべての製品 ] むち打ちを起こさずに市場スイングの利益 インジケーターは常にトレンドの方向を表示します 色付きの価格帯は機会のベースラインを表します 色付きのダッシュは、可能な反転スイングを表します この指標は、独自の品質とパフォーマンスを分析します 複数時間枠のダッシュボードを実装します カスタマイズ可能なトレンドおよびスイング期間 電子メール/サウンド/プッシュアラートを実装します インジケータは再描画またはバックペインティングではありません Swing Tradingとは Swing Tradi
これは、ほぼ10年前に初めて公開された私の有名なスキャルパー、ゴールドフィンチEAの最新版です。短期間で起こる急激なボラティリティの拡大で市場をスキャルピングします。突然の価格上昇の後、価格変動の慣性を利用しようとします。この新しいバージョンは、トレーダーがテスターの最適化機能を簡単に使用して最適な取引パラメーターを見つけられるように簡素化されています。 [ インストールガイド | 更新ガイド | トラブルシューティング | よくある質問 | すべての製品 ] 最適化を容易にするシンプルな入力パラメーター カスタマイズ可能な取引管理設定 取引セッションの選択 平日の選択 資金管理 注意してください... 多くの要因が見返りを台無しにする可能性があるため、ダニのダフ屋は危険です。変動スプレッドとスリッページは、取引の数学的期待値を低下させ、ブローカーからの低いティック密度は幻の取引を引き起こす可能性があり、ストップレベルは利益を確保する能力を損ない、ネットワークラグはリクオートを意味します。注意が必要です。 バックテスト Expert Advisorはティックデータのみを使
FREE
サポート線と抵抗線のプロットにうんざりしていませんか? サポートレジスタンス は、非常に興味深いひねりを加えてチャート内のサポートとレジスタンスラインを自動検出およびプロットするマルチタイムフレームインジケーターです。価格レベルは時間とともにテストされ、その重要性が高まるにつれて、ラインは太くなり、暗くなります。 [ インストールガイド | 更新ガイド | トラブルシューティング | よくある質問 | すべての製品 ] 一晩でテクニカル分析を強化 チャートを閲覧せずに重要な価格レベルを検出 一目ですべての価格レベルの相対的な強さを認識する すべての取引で最大30時間のプロットラインを節約 インジケーターは、すべての価格レベルの年齢を表示します インジケーターは再描画されていません 過去および現在の価格レベルは近接によって崩壊し、現在の市場行動に合わせて調整されます。動作は、必ずしもピークではない場所に線が引かれます。 価格レベルは、時間とともに拒否されるにつれて、より暗く、より広くなります ノイズを避けるために、重要でない価格レベルは定期的にクリアされます カスタマイズ可能な時間枠の
このインディケータは、価格アクション分析とドンチャンチャネルのみを使用して、ジグザグ方式で価格の反転を検出します。再描画やバックペインティングを一切行わずに、短期取引向けに特別に設計されています。それは彼らの操作のタイミングを増やすことを目指している賢明なトレーダーにとって素晴らしいツールです。 [ インストールガイド | 更新ガイド | トラブルシューティング | よくある質問 | すべての製品 ] 驚くほど簡単に取引できます すべての時間枠で価値を提供します 自己分析統計を実装します 電子メール/音声/視覚アラートを実装します 可変長のブレイクアウトと混雑ゾーンに基づいて、インディケータは価格アクションのみを使用して取引を選択し、市場が非常に高速に行っていることに反応します。 過去のシグナルの潜在的な利益が表示されます この指標は、独自の品質とパフォーマンスを分析します 負けブレイクアウトは強調表示され、説明されます インジケータは、非バックペインティングおよび非再ペイントです この指標は、日中のトレーダーが単一の価格反転を見逃さないようにするのに役立ちます。ただし、す
トレンドトレーディング は、タイミングのプルバックとブレイクアウトにより、市場で起こっているトレンドから可能な限り利益を得るように設計された指標です。確立されたトレンドの中で価格が何をしているかを分析することにより、取引の機会を見つけます。 [ インストールガイド | 更新ガイド | トラブルシューティング | よくある質問 | すべての製品 ] 自信を持って効率的に金融市場を取引する むち打ちにならずに確立されたトレンドから利益を得る 収益性の高いプルバック、ブレイクアウト、早期の逆転を認識する この指標は、独自の品質とパフォーマンスを分析します 複数時間枠のダッシュボードを実装します インジケーターは再描画されていません 電子メール/音声/視覚アラートを実装します 確立されたトレンドは多くの取引機会を提供しますが、ほとんどのトレンド指標はそれらを完全に無視しています。インジケーターの解釈はかなり簡単です: (1) トレンドの変化 (2) トレンドの方向への後退 (3) トレンドの方向へのブレイクアウト 赤いダッシュ は下降トレンド中の修正です 青いダッシュ は上昇ト
This indicator displays pivot points in the chart, including historical vales, and supports many calculation modes for Pivot Points and S/R levels. [ Installation Guide | Update Guide | Troubleshooting | FAQ | All Products ] It plots historical levels for backtesting purposes It allows you to select the reference timeframe It implements different Pivot Point calculation modes It implements different SR calculation modes It implements customizable colors and sizes Calculation Modes The indi
FREE
これはほぼ間違いなく、MetaTraderプラットフォームで見つけることができる最も完全な調和価格形成自動認識インジケーターです。 19種類のパターンを検出し、フィボナッチプロジェクションをあなたと同じように真剣に受け止め、潜在的逆転ゾーン(PRZ)を表示し、適切なストップロスとテイクプロフィットレベルを見つけます。 [ インストールガイド | 更新ガイド | トラブルシューティング | よくある質問 | すべての製品 ] 19の異なる調和価格形成を検出します プライマリ、派生および補完フィボナッチ投影(PRZ)をプロットします 過去の価格行動を評価し、過去のすべてのパターンを表示します この指標は、独自の品質とパフォーマンスを分析します 適切なストップロスとテイクプロフィットのレベルを表示します ブレイクアウトを使用して適切な取引を通知します すべてのパターン比をグラフにプロットします 電子メール/音声/視覚アラートを実装します スコット・M・カーニーの本に着想を得て、この指標は最も純粋で急を要するトレーダーのニーズを満たすように設計されています。ただし、トレードを
Tired of plotting trendlines? The PZ TrendLines MT5 indicator applies a mechanical approach to the construction of trend lines for you!  [ Installation Guide | Update Guide | Troubleshooting | FAQ | All Products ] It can draw up to 18 trendlines Trendlines can be optionally based on fractals Each line represents a breakout level Each trendline can be broken or rejected Configurable amount of lines Configurable colors Support I am happy to provide free products but given my limited time, they com
FREE
This indicator analyzes price action patterns and helps you to make positive equity decisions in the binary options market. [ Installation Guide | Update Guide | Troubleshooting | FAQ | All Products ] Easy to trade Trade both call and put options No crystal ball and no predictions The indicator is non-repainting The only strategy suitable for binary options is applying a mathematical approach, like professional gamblers do. It is based on the following principles: Every binary option represents
FREE
This indicator detects inside bars of several ranges, making it very easy for price action traders to spot and act on inside bar breakouts. [ Installation Guide | Update Guide | Troubleshooting | FAQ | All Products ] Easy to use and understand Customizable color selections The indicator implements visual/mail/push/sound alerts The indicator does not repaint or backpaint An inside bar is a bar or series of bars which is/are completely contained within the range of the preceding bar. A blue box is
FREE
The Turtle Trading Indicator implements the original Dennis Richards and Bill Eckhart trading system, commonly known as The Turtle Trader. This trend following system relies on breakouts of historical highs and lows to take and close trades: it is the complete opposite to the "buy low and sell high" approach. The main rule is "Trade an N-day breakout and take profits when an M-day high or low is breached (N must me above M)".  [ Installation Guide | Update Guide | Troubleshooting | FAQ | All Pr
FREE
Wolfe Wavesは、すべての金融市場に存在する自然に発生する取引パターンであり、均衡価格への戦いを表しています。これらのパターンは、短期および長期の時間枠で発生する可能性があり、現在の最も信頼性の高い予測反転パターンの1つであり、通常は強い長期の価格変動に先行します。 [ インストールガイド | 更新ガイド | トラブルシューティング | よくある質問 | すべての製品 ] クリアな取引シグナル 驚くほど簡単に取引できます カスタマイズ可能な色とサイズ パフォーマンス統計を実装します 適切なストップロスおよび利益レベルを表示します 電子メール/音声/視覚アラートを実装します インジケーターはパターンとブレイクアウト矢印を同時に描画し、インジケーターが展開するときにパターンが再描画されないようにします。ただし、エントリのブレイクアウトが何度も発生し、インジケータが再描画される場合、あまり頻繁にではなく控えめに再描画される可能性があります。インジケータは非バックペインティングです。 オオカミの定義 ウルフ波には、次の特性が必要です。 ( 例を見るにはここをクリック ) ウ
サポート線と抵抗線のプロットにうんざりしていませんか? サポートレジスタンス は、非常に興味深いひねりを加えてチャート内のサポートとレジスタンスラインを自動検出およびプロットするマルチタイムフレームインジケーターです。価格レベルは時間とともにテストされ、その重要性が高まるにつれて、ラインは太くなり、暗くなります。 [ インストールガイド | 更新ガイド | トラブルシューティング | よくある質問 | すべての製品 ] 一晩でテクニカル分析を強化 チャートを閲覧せずに重要な価格レベルを検出 一目ですべての価格レベルの相対的な強さを認識する すべての取引で最大30時間のプロットラインを節約 インジケーターは、すべての価格レベルの年齢を表示します インジケーターは再描画されていません 過去および現在の価格レベルは近接によって崩壊し、現在の市場行動に合わせて調整されます。動作は、必ずしもピークではない場所に線が引かれます。 価格レベルは、時間とともに拒否されるにつれて、より暗く、より広くなります ノイズを避けるために、重要でない価格レベルは定期的にクリアされます カスタマイズ可能な時間枠の
This indicator detects Sandwich Bars of several ranges, an extremely reliable breakout pattern. A sandwich setup consists on a single bar that engulfs several past bars, breaking and rejecting the complete price range. [ Installation Guide | Update Guide | Troubleshooting | FAQ | All Products ] Easy and effective usage Customizable bar ranges Customizable color selections The indicator implements visual/mail/push/sound alerts The indicator does not repaint or backpaint The indicator could not b
FREE
This indicator analyzes price action patterns and helps you to make positive equity decisions in the binary options market. [ Installation Guide | Update Guide | Troubleshooting | FAQ | All Products ] Easy to trade Trade both call and put options No crystal ball and no predictions The indicator is non-repainting The only strategy suitable for binary options is applying a mathematical approach, like professional gamblers do. It is based on the following principles: Every binary option represents
FREE
PZ Trendlines
PZ TRADING SLU
4.64 (11)
Tired of plotting trendlines? The PZ TrendLines indicator applies a mechanical approach to the construction of trend lines for you!  [ Installation Guide | Update Guide | Troubleshooting | FAQ | All Products ] It can draw up to 18 trendlines Trendlines can be optionally based on fractals Each line represents a breakout level Each trendline can be broken or rejected Configurable amount of lines Configurable colors Support I am happy to provide free products but given my limited time, they come
FREE
Wolfe Wavesは、すべての金融市場に存在する自然に発生する取引パターンであり、均衡価格への戦いを表しています。これらのパターンは、短期および長期の時間枠で発生する可能性があり、現在の最も信頼性の高い予測反転パターンの1つであり、通常は強い長期の価格変動に先行します。 [ インストールガイド | 更新ガイド | トラブルシューティング | よくある質問 | すべての製品 ] クリアな取引シグナル 驚くほど簡単に取引できます カスタマイズ可能な色とサイズ パフォーマンス統計を実装します 適切なストップロスおよび利益レベルを表示します 電子メール/音声/視覚アラートを実装します インジケーターはパターンとブレイクアウト矢印を同時に描画し、インジケーターが展開するときにパターンが再描画されないようにします。ただし、エントリのブレイクアウトが何度も発生し、インジケータが再描画される場合、あまり頻繁にではなく控えめに再描画される可能性があります。インジケータは非バックペインティングです。 オオカミの定義 ウルフ波には、次の特性が必要です。 ( 例を見るにはここをクリック ) ウ
This indicator studies price action as an aggregation of price and time vectors, and uses the average vector to determine the direction and strength of the market. This indicator highlights the short-term directionality and strength of the market, and can be used to capitalize from short-term price movements by trading breakouts or binary options.  [ Installation Guide | Update Guide | Troubleshooting | FAQ | All Products ] Find market direction easily Confirm with breakouts or other indicators
FREE
The market profile indicator provides with an X-Ray vision into market activity, outlining the most important price levels, value area and control value of the daily trading session. [ Installation Guide | Update Guide | Troubleshooting | FAQ | All Products ] Easy to understand and use Understand market dynamics easily Automatic timeframe selection Identify zones of trading value and discard others It is useful in all market conditions Effective for any trading strategy It implements three color
FREE
This indicator finds Three Drives patterns. The Three Drives pattern is a 6-point reversal pattern characterised by a series of higher highs or lower lows that complete at a 127% or 161.8% Fibonacci extension. It signals that the market is exhausted and a reversal can happen. [ Installation Guide | Update Guide | Troubleshooting | FAQ | All Products ] Customizable pattern sizes Customizable colors and sizes Customizable breakout periods Customizable 1-2-3 and 0-A-B ratios It implements visua
FREE
PZ Pivot Points
PZ TRADING SLU
4.64 (14)
This indicator displays pivot points in the chart, including historical vales, and supports many calculation modes for Pivot Points and S/R levels.  [ Installation Guide | Update Guide | Troubleshooting | FAQ | All Products ] It plots historical levels for backtesting purposes It allows you to select the reference timeframe It implements different Pivot Point calculation modes It implements different SR calculation modes It implements customizable colors and sizes Calculation Modes The indi
FREE
This is a smooth and responsive accelerometer which reveals the market trend and strength. [ Installation Guide | Update Guide | Troubleshooting | FAQ | All Products ] Two moving averages indicate trend direction The histogram represents strength of the price movement It draws buy and sell zones as colored vertical lines Should be used as a confirmation indicator Customizable line widths and colors It implements alerts of all kinds This indicator is similar to MACD but aims to react faster t
FREE
The Turtle Trading Indicator implements the original Dennis Richards and Bill Eckhart trading system, commonly known as The Turtle Trader. This trend following system relies on breakouts of historical highs and lows to take and close trades: it is the complete opposite to the "buy low and sell high" approach. The main rule is "Trade an N-day breakout and take profits when an M-day high or low is breached (N must me above M)". [ Installation Guide | Update Guide | Troubleshooting | FAQ | All Prod
FREE
The Stretch is a Toby Crabel price pattern which represents the minimum average price movement/deviation from the open price during a period of time, and is used to calculate two breakout levels for every single trading day. It is calculated by taking the 10 period SMA of the absolute difference between the open and either the high or low, whichever difference is smaller. This value is used to calculate breakout thresholds for the current trading session, which are displayed in the indicator as
FREE
フィルタ:
レビューなし
レビューに返信
バージョン 2.0 2017.12.01
- Improved alerts