• 概述
  • 评论 (2)
  • 评论
  • 新特性

Magic MovingAverage

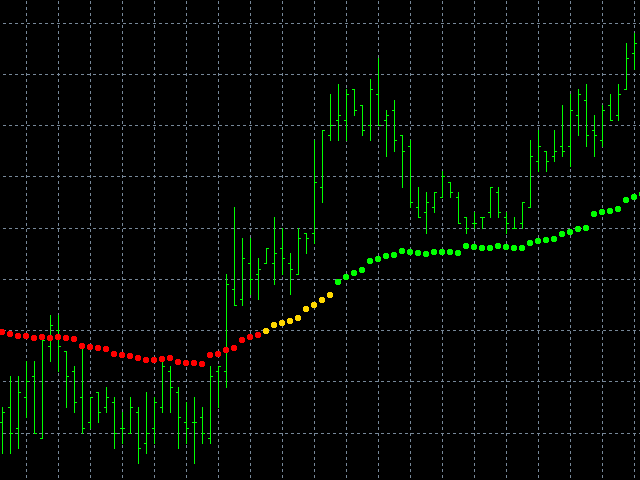
The indicator displays the averaged value of the moving averages of the current and two higher timeframes with the same parameters on the chart. If the moving averages are located one above the other, the resulting one is painted in green, showing an uptrend, in the opposite direction - red color (downtrend), intertwined - yellow color (transitional state)


The indicator parameters

  • MaPeriod - moving average period
  • MaMethod - moving average method (drop-down list)
  • MaShift - moving average shift
  • MaPrice - moving average price (drop-down list)
  • middleTF - timeframe of the middle period (drop-down list)
  • slowTF - timeframe of the higher period (drop-down list)
推荐产品
Owl smart levels
Sergey Ermolov
4.24 (37)
MT5版本  |  FAQ Owl Smart Levels Indicator   是一個完整的交易系統,包含   Bill Williams   的高級分形、構建正確的市場波浪結構的 Valable ZigZag 以及標記準確入場水平的斐波那契水平等流行的市場分析工具 進入市場和地方獲利。 策略的详细说明 指示灯使用说明 顾问-贸易猫头鹰助手助理 私人用户聊天 ->购买后写信给我,我会将您添加到私人聊天中,您可以在那里下载所有奖金 力量在於簡單! Owl Smart Levels   交易系統非常易於使用,因此適合專業人士和剛開始研究市場並為自己選擇交易策略的人。 策略和指標中沒有隱藏的秘密公式和計算方法,所有策略指標都是公開的。 Owl Smart Levels 允許您快速查看進入交易的信號,突出顯示下訂單的水平並向您發送有關已出現信號的通知。 優點很明顯: 清楚地顯示主要和更高時間框架的趨勢方向。 指示儀器信號的出現。 標記開單、止損設置和固定利潤的水平。 沒有多餘的,只有必要的結構! ZigZag   表示全球趨勢的方向,因此也表示貿易方向。 市場反轉點的短線清楚地表明在什
The indicator displays the data of the Stochastic oscillator from a higher timeframe on the chart. The main and signal lines are displayed in a separate window. The stepped response is not smoothed. The indicator is useful for practicing "manual" forex trading strategies, which use the data from several screens with different timeframes of a single symbol. The indicator uses the settings that are identical to the standard ones, and a drop-down list for selecting the timeframe. Indicator Paramet
Forex Gump
Andrey Kozak
2.4 (5)
Forex Gump is a fully finished semi-automatic trading system. In the form of arrows, signals are displayed on the screen for opening and closing deals. All you need is to follow the instructions of the indicator. When the indicator shows a blue arrow, you need to open a buy order. When the indicator shows a red arrow, you need to open a sell order. Close orders when the indicator draws a yellow cross. In order to get the most effective result, we recommend using the timeframes H1, H4, D1. There
Noize Absorption Index MT4
Ekaterina Saltykova
5 (1)
Noize Absorption Index - is the manual trading system that measures the difference of pressure between bears forces and bulls forces. Green line - is a noize free index that showing curent situation. Zero value of index shows totally choppy/flat market.Values above zero level shows how powerfull bullish wave is and values below zero measures bearish forces.Up arrow appears on bearish market when it's ready to reverse, dn arrow appears on weak bullish market, as a result of reverse expectation. S
HMA Trend Professional MT4
Pavel Zamoshnikov
4.57 (7)
Improved version of the free HMA Trend indicator (for MetaTrader 4) with statistical analysis. HMA Trend is a trend indicator based on the Hull Moving Average (HMA) with two periods. HMA with a slow period identifies the trend, while HMA with a fast period determines the short-term movements and signals in the trend direction. The main differences from the free version: Ability to predict the probability of a trend reversal using analysis of history data. Plotting statistical charts for analyzi
我们为您提供一个指标"蜡烛收盘台",它将成为您在贸易领域不可或缺的助手。 这就是为什么知道蜡烛何时关闭会有所帮助的原因: 如果你喜欢使用蜡烛花纹进行交易,你就会知道蜡烛何时关闭。 此指标将允许您检查是否形成了已知模式以及是否存在交易的可能性。 该指标将帮助您做好市场开放和市场关闭的准备。 可以设置一个计时器来创建计划新闻的预览,这样就可以检查市场对此的反应。 您可以设置指示灯,以便在蜡烛关闭前几秒钟发送警报/警告。 通知/警报/警报可以发送到: 屏幕警报 电子邮件 移动应用 MT4烛台计时器指示器为什么有用 那么烛台计时器什么时候有用呢?如果你长期交易,你可能不需要蜡烛计时器指示器,因为你的参赛不会受到一分钟或一小时的太大影响。但是,如果你在短时间内是黄牛或交易员,那么你知道时机非常重要。 外汇市场24小时开放,只在周末关门,有些策略可能会受到您入仓时出现错误时机的严重影响。 MT4蜡烛计时器指示器可以显示当前蜡烛中的剩余时间,以便为下一次蜡烛打开做好准备。 可以从这一指标中受益的一些情况例子有: 预定消息传出 地理市场开闭 预定发生的事件,通常是金融、经济或政治事件
Trend Oscillator mw
DMITRII GRIDASOV
趋势振荡器 - 是一种高级自定义 Crypto_Forex 指标,高效的交易工具! - 使用高级新计算方法 - 参数“计算价格”有 20 个选项。 - 有史以来最平滑的振荡器。 - 绿色表示上升趋势,红色表示下降趋势。 - 超卖值:低于 5,超买值:超过 95。 - 使用此指标,有很多机会升级标准策略。 - 具有 PC 和移动警报。 .................................................................................................................... // 出色的交易机器人和指标可在此处获取: https://www.mql5.com/en/users/def1380/seller 这是仅在此 MQL5 网站上提供的原创产品。
EZZ Elite Zig Zag is an indicator for the MetaTrader 4 terminal. This indicator traces the peak of the trend based on the market reversal, thus showing various opportunities in the financial market. EZZ Elite Zig Zag is a visual tool, intuitive, and easy to understand and use.  Test it Yourself by Downloading it for Free. Author Paulo Rocha all rights reserved
ZhiBiCCI MT4
Qiuyang Zheng
【ZhiBiCCI】指标适合所有的周期使用,也适合所有的市场品种。 【ZhiBiCCI】绿色实线是逆转看涨背离。绿色虚线是经典的看涨背离。 【ZhiBiCCI】向红色实线是反向看跌背离。红色虚线是古典看跌背离。 【ZhiBiCCI】可以在参数里面设置(Alert、Send mail、Send notification),设置为(true)就可以发送即时信号到警报窗口、电子邮件、即时消息。 参数设置说明: 【displayAlert】:这是警报开关,设置成true,如果出现箭头就会自动警报提示;设置成false,则不会警报提示。 【sendmail_NO_OFF】:这是发送邮件的开关,设置成true,如果出现箭头就会发送邮件到你在MT4设置好的邮箱里面;设置成false,则不会发邮件。 【sendnotification_NO_OFF】:这是发送即时消息的开关,设置成true,如果出现箭头就会发送消息到你的移动设备;设置成false,则不会发消息。 更多好用的指标网址: https://www.mql5.com/en/users/zhengqiuyang/seller
Crypto_Forex 指标“主要趋势修正直方图”适用于 MT4,无需重绘。 - 主要趋势修正直方图指标旨在检测大趋势。 - 指标可以采用 2 种颜色:红色表示看跌趋势,蓝色表示看涨趋势(可以更改颜色)。 - 至少 10 个连续的相同颜色的直方图列表示新趋势的开始。 - 指标具有内置的移动和 PC 警报。 - 参数“周期”负责指标的灵敏度。 如何使用指标: 1) 检查至少 10 个连续的相同颜色的直方图列,这意味着新趋势的开始(蓝色 - 表示看涨,红色 - 表示看跌)。 2) 然后,如果出现 1 或 2 个相反颜色的列,然后将其变回主要趋势的颜色 - 那就是趋势修正。 3) 修正后,可以考虑:在主要上涨趋势的情况下开立买入交易,在主要下跌趋势的情况下开立卖出交易。 // 出色的交易机器人和指标可在此处获得: https://www.mql5.com/en/users/def1380/seller 这是仅在此 MQL5 网站上提供的原创产品。
Super Reversal Pattern
Parfait Mujinga Ndalika
Super Reversal Pattern Indicator Unlock the power of advanced pattern recognition with our Super Reversal Pattern Indicator. Designed for traders seeking precision and reliability, this indicator identifies one of the most effective reversal patterns in technical analysis, offering a significant edge in your trading strategy. Key Features: Non-Repainting Accuracy: Enjoy the confidence of non-repainting technology. Once a Super Reversal Pattern is detected, it remains static, providing consiste
ProTrading Arrow
Nedyalka Zhelyazkova
5 (1)
" A NEW TRADING METHOD… AN AMAZING TRADING INDICATOR! " Additional Bonus : You get the Forex Trend Commander indicator for FREE! It should not be forgotten that trading is not an event, but a process. This process has no end, i.e. it should never stop completely and completely. To lock in a profit from market movements you need to implement the strategy in practice, in most cases it takes much longer than planning it. ProTrading Arrow indicator is an advanced reversal system that can be played
这个多时间框架和多符号指示器提醒 Heiken Ashi 平滑颜色变化。作为奖励,它还可以扫描赫尔移动平均线趋势(颜色)的变化。结合您自己的规则和技术,该指标将允许您创建(或增强)您自己的强大交易系统。 特征 可以同时监控您的市场报价窗口中可见的所有交易品种。将该指标仅应用于一张图表,并立即监控整个市场。 可以监控从 M1 到 MN 的每个时间范围,并在识别出颜色变化时向您发送实时警报。支持所有 Metatrader 本地警报类型。 该指示器包括一个交互式面板。当您单击面板中的信号时,将打开带有相关交易品种和时间范围的新图表。请看下面的截图。 选择延迟一个或多个条形的警报以确认颜色(趋势)变化。 该指标可以将信号写入一个文件,EA 可以使用该文件进行自动交易。比如 这个产品 。 输入参数 输入参数的描述和解释可以在 这里 找到。 重要的 请注意,由于具有多功能性,既不会在安装指标的图表上绘制买入/卖出建议,也不会绘制线条和箭头。强烈建议将指标放在干净(空)图表上,不要在其上放置任何其他可能干扰扫描仪的指标或智能交易系统。
Crypto_Forex 指标 HTF Ichimoku 适用于 MT4。 - Ichimoku 指标是最强大的趋势指标之一。HTF 表示 - 更高时间框架。 - 此指标非常适合趋势交易者以及与价格行动条目的组合。 - HTF Ichimoku 指标允许您将更高时间框架的 Ichimoku 附加到当前图表。 - 上升趋势 - 红线高于蓝线(并且两条线都在云层上方)/ 下降趋势 - 红线低于蓝线(并且两条线都在云层下方)。 - 仅当价格突破 Ichimoku 云层顶部边界时才打开买入订单。 - 仅当价格突破 Ichimoku 云层底部边界时才打开卖出订单。 - HTF Ichimoku 指标提供了捕捉大趋势的机会。 // 出色的交易机器人和指标可在此处获取: https://www.mql5.com/en/users/def1380/seller 它是仅在此 MQL5 网站上提供的原创产品。
Auto Fibo Pro m
DMITRII GRIDASOV
“Auto FIBO Pro” Crypto_Forex 指标 - 是交易中的绝佳辅助工具! - 指标自动计算并放置在图表斐波那契水平和局部趋势线(红色)上。 - 斐波那契水平指示价格可能反转的关键区域。 - 最重要的水平是 23.6%、38.2%、50% 和 61.8%。 - 您可以将其用于反转剥头皮或区域网格交易。 - 还有很多机会可以使用 Auto FIBO Pro 指标来改进您当前的系统。 - 它具有信息价差掉期显示 - 它显示所连接的外汇对的当前价差和掉期。 - 显示屏还显示账户余额、净值和保证金。 - 可以将信息价差掉期显示定位在图表的任何角落: 0 - 左上角,1 - 右上角,2 - 左下角,3 - 右下角。 // 出色的交易机器人和指标可在此处获得: https://www.mql5.com/en/users/def1380/seller 这是仅在此 MQL5 网站上提供的原创产品。
Crypto_Forex 指标“晨星模式”适用于 MT4。 - 指标“晨星模式”是价格行为交易的非常强大的指标:无需重绘,无延迟。 - 指标检测图表上的看涨晨星模式:图表上的蓝色箭头信号(见图片)。 - 带有 PC、手机和电子邮件警报。 - 还有它的兄弟 - 看跌“黄昏之星模式”指标可用(点击以下链接)。 - 指标“晨星模式”非常适合与支撑/阻力位结合使用。 ................................................................................................................. // 出色的交易机器人和指标可在此处获得: https://www.mql5.com/en/users/def1380/seller 这是仅在此 MQL5 网站上提供的原创产品。
Trendiness Index
Libertas LLC
5 (3)
"The trend is your friend" is one of the best known sayings in investing, because capturing large trendy price movements can be extremely profitable. However, trading with the trend is often easier said than done, because many indicators are based on price reversals not trends. These aren't very effective at identifying trendy periods, or predicting whether trends will continue. We developed the Trendiness Index to help address this problem by indicating the strength and direction of price trend
VR Cub
Vladimir Pastushak
VR Cub 这是获得高质量切入点的指标。该指标的开发是为了促进数学计算并简化对仓位入场点的搜索。多年来,该指标所针对的交易策略已被证明其有效性。交易策略的简单性是其巨大的优势,即使是新手交易者也能成功进行交易。 VR Cub 计算开仓点以及获利和止损目标水平,这显着提高了效率和易用性。查看使用以下策略进行交易的屏幕截图,了解简单的交易规则。 设置、设置文件、演示版本、说明、问题解决,可以从以下位置获取 [博客] 您可以在以下位置阅读或撰写评论 [关联] 版本为 [MetaTrader 5] 计算入场点的规则 开仓 要计算入场点,您需要将 VR Cub 工具从最后一个高点拉伸到最后一个低点。 如果第一个点在时间上早于第二个点,交易者等待柱线收于中线上方。 如果第一个点在时间上晚于第二个点,交易者等待柱线收于中线下方。 根据上述条件,严格在 柱线收盘 后建仓。 换句话说,如果我们在小时图上进行交易,那么从最高点到最低点的时间距离必须超过24小时,最高点和最低点之间的点数必须大于或等于平均价格变动每天。 维持和改变市场地位 可以有多个未平仓头寸;每个头寸都可以单独修改。 VR Cub
PZ Penta O MT4
PZ TRADING SLU
The Penta-O is a 6-point retracement harmonacci pattern which usually precedes big market movements. Penta-O patterns can expand and repaint quite a bit. To make things easier this indicator implements a twist: it waits for a donchian breakout in the right direction before signaling the trade. The end result is an otherwise repainting indicator with a very reliable trading signal. The donchian breakout period is entered as an input. [ Installation Guide | Update Guide | Troubleshooting | FAQ | A
Master scalping M1
Nataliia Marchuk
Master Scalping M1 is an innovative indicator that uses an algorithm to quickly and accurately determine the trend.The indicator calculates the time of opening and closing positions, the indicator's algorithms allow you to find the ideal moments to enter a deal (buy or sell an asset), which increase the success of transactions for most traders. Benefits of the indicator: Easy to assemble, does not overload the chart with unnecessary information. Can be used as a filter for any strategy. Works on
What are Heiken Ashi Candles? Heiken Ashi, derived from the Japanese term 'Heikin Ashi,' translates to average price bars. It's an indicator depicting price bars on a chart. Formula for Heiken Ashi candles: - Heiken Ashi opening price: (previous candle's opening + closing price) / 2 - Closing price Heiken Ashi: (opening + high + low + closing) / 4 - Heiken Ashi peak: Max of high, opening, or closing price - Heiken Ashi bottom price: Min of low, opening, or closing price How to Read Heiken A
MetaTrader 4(MT4)的 "两条移动平均线交叉 "指标是一个技术分析工具,显示两条移动平均线并在移动平均线相互交叉时发出通知。 该指标计算并绘制两条移动平均线,其中一条较快,另一条较慢。当较快的移动平均线穿过较慢的移动平均线时,它被认为是一个看涨信号,表明潜在的趋势逆转或新的上升趋势的开始。相反,当较快的移动平均线穿过较慢的移动平均线下方时,它是一个看跌信号,表明潜在的趋势逆转或新的下降趋势的开始。 该指标可以自定义使用不同类型的移动平均线,如简单移动平均线(SMA),指数移动平均线(EMA),平滑移动平均线(SMMA),或线性加权移动平均线(LWMA)。交易者还可以调整每条移动平均线的周期,以适应他们的交易风格和偏好。 除了绘制移动平均线外,该指标在发生交叉时还会产生警报。交易者可以设置声音或视觉警报,或者在交叉发生时收到电子邮件或推送通知。这一功能可以帮助交易者保持对潜在交易机会的了解,即使他们没有积极监测图表。 两条移动平均线交叉 "指标是一个多功能和易于使用的工具,对新手和有经验的交易者都有价值。它可以用来识别趋势,发现潜在的进入和退出点,并产生交易信号。 特点
BreakEven Line is a very useful and easy to use indicator. In case of multiple positions opened on the same instrument, the indicator shows the breakeven point where it is possible to close the positions. Its graphic simplicity makes it an unobtrusive and customizable tool. You can enable/disable a line on a chart, so you can make the indicator invisible. Inputs Show cumulative BE (line on/off) Breakeven line color (to change the line color) Breakeven line style Breakeven line width Show short B
PullbackMatrix provides the key information of the trading transactions when it finds the right market moment based on its built-in logic algorithm. The high accuracy signals including Trading Symbol, Entry Price, Entry Time, TakeProfit, Stoploss, and more. And that's all will be available instantly in your chart panel, drawing the position lines and also sending signal notification to email, mobile phone, and screen popup. More important is that also saves signals into a .csv file which is usef
The Th3Eng PipFinite indicator is based on a very excellent analysis of the right trend direction with perfect custom algorithms. It show the true direction and the best point to start trading. With StopLoss point and Three Take Profit points. Also it show the right pivot of the price and small points to order to replace the dynamic support and resistance channel, Which surrounds the price. And Finally it draws a very helpful Box on the left side on the chart includes (take profits and Stop loss
Stepping Trend
Mpendulo Chiliza
The Stepping Trend Indicator     The Steppi ng Trend indicator uses the  average true range  (ATR indicator) in its calculation. This gives you control to set your own average true range period, I set the Default as 10.   Indicator Details. Green Arrow Up: This means you are at the starting point of a new bullish trend, it’s time to buy.   Red  Arrow  Down : This means you are at the starting point of a new  bearish  trend, it’ s time to sell .   What if you miss the Arrow Signal?   No prob
Trade with Gann on your side!! MASTER CIRCLE 360 CIRCLE CHART, originally created by Gann admitted that this is “The Mother of all charts”. It is one of the last studies that this great trader left for us. The numeric tab le is apparently quite simple like all the tables and is based on square numbers, the SQUARE OF 12 and is by evolution, one of the most important square numbers. Here we can find CYCLE, PRICE AND TIME thanks to angles and grades, to show past and future support and resistance.
RSI Speed mp
DMITRII GRIDASOV
Crypto_Forex MT4 指标“ RSI SPEED ”——卓越的预测工具,无需重绘。 - 该指标基于物理方程计算。RSI SPEED 是 RSI 本身的一阶导数。 - RSI SPEED 非常适合顺着主趋势方向进行剥头皮交易。 - 建议结合合适的趋势指标使用,例如 HTF MA(如图所示)。 - RSI SPEED 指标显示 RSI 本身方向变化的速度——它非常敏感。 - 建议将 RSI SPEED 指标用于动量交易策略:如果 RSI SPEED 指标的值小于 0:价格动量下降;如果 RSI SPEED 指标的值大于 0:价格动量上升。 - 指标内置移动端和 PC 端警报。 // 优秀的交易机器人和指标可在此处获取: https://www.mql5.com/en/users/def1380/seller 这是仅在 MQL5 网站上提供的原创产品。
Title : Market Bias Indicator - Oscillator-Based Trading Tool Introduction : Discover the potential of the "Market Bias Indicator," a revolutionary oscillator-based trading tool designed for precise market analysis. If you're in search of a robust alternative to traditional bias indicators, your quest ends here. Market Bias Indicator offers unparalleled accuracy in identifying market sentiment and is your gateway to confident trading decisions. Recommended Trading Pairs : Market Bias Indicator i
KopierMaschine - локальный копировщик сделок между различными счетами MetaTrader 4 и MetaTrader 5 в любом направлении расположенных на одном компьютере с интуитивно понятным интерфейсом. Направления копирования: MT4 --> MT5 MT4 --> MT4 MT5 --> MT5 MT5 --> MT4 для копирования между терминалами MetaTrader 4 и MetaTrader   5 необходимо приобрести версию продукта KopierMaschine  для  MetaTrader   5 Особенности Программа работает в двух режимах Master и Slave На один подчиненный счет можно копировать
该产品的买家也购买
Gann Made Easy
Oleg Rodin
4.79 (121)
Gann Made Easy 是一个专业且易于使用的外汇交易系统,它基于使用先生理论的最佳交易原则。 W.D.江恩。该指标提供准确的买入和卖出信号,包括止损和获利水平。您甚至可以使用推送通知在旅途中进行交易。 购买后请联系我!我将免费与您分享我的交易技巧和丰厚的红利指标! 您可能已经多次听说过江恩交易方法。通常 Gann 的理论不仅对于新手交易者而且对于那些已经有一定交易经验的人来说都是非常复杂的东西。这是因为江恩的交易方法在理论上并不那么容易应用。我花了几年时间来完善这些知识,并将最好的原则应用到我的外汇指标中。 该指标非常易于应用。您所需要的只是将其附加到您的图表并遵循简单的交易建议。该指标不断进行市场分析工作并寻找交易机会。当它检测到一个好的入口点时,它会为您提供一个箭头信号。该指标还显示止损和获利水平。 换句话说,当您像先生一样进行交易时,该指标会为您提供最佳江恩建议。江恩亲自告诉你此时此刻该做什么。但最好的部分是您不需要了解任何有关江恩交易原则的知识,因为该指标会为您完成整个市场分析工作。
Cycle Maestro
Stefano Frisetti
NOTE: CYCLEMAESTRO is distributed only on this website, there are no other distributors. Demo version is for reference only and is not supported. Full versione is perfectly functional and it is supported CYCLEMAESTRO , the first and only indicator of Cyclic Analysis, useful for giving signals of TRADING, BUY, SELL, STOP LOSS, ADDING. Created on the logic of Serghei Istrati and programmed by Stefano Frisetti ; CYCLEMAESTRO is not an indicator like the others, the challenge was to interpret only t
Gold Stuff
Vasiliy Strukov
4.86 (259)
Gold Stuff 是专为黄金设计的趋势指标,也可用于任何金融工具。 该指标不会重绘,也不会滞后。 推荐时间框架 H1。 在它指标工作全自动专家顾问 EA Gold Stuff。 你可以在我的个人资料中找到它。 重要! 购买后立即与我联系,以获得说明和奖金!   您可以免费收到我们的强力支持和趋势扫描指标的副本,请私信。大部头书! 购买后立即联系我以获得设置和个人奖励!   设置 绘制箭头 - 打开关闭。 在图表上绘制箭头。 警报 - 打开关闭声音警报。 电子邮件通知 - 打开关闭。 电子邮件通知。 Puch-notification - 打开关闭。 推送通知。 接下来,调整色域。 Gold Stuff 是专为黄金设计的趋势指标,也可用于任何金融工具。 该指标不会重绘,也不会滞后。 推荐时间框架 H1。 在它指标工作全自动专家顾问 EA Gold Stuff。 你可以在我的个人资料中找到它。 购买后立即联系我以获得设置和个人奖励!   设置 绘制箭头 - 打开关闭。 在图表上绘制箭头。 警报 - 打开关闭声音警报。 电子邮件通知 - 打开关闭。 电子邮件通知。 Puch
Trend Screener
STE S.S.COMPANY
4.78 (93)
趋势指标,趋势交易和过滤的突破性独特解决方案,所有重要趋势功能都内置在一个工具中! 它是 100% 非重绘多时间框架和多货币指标,可用于所有符号/工具:外汇、商品、加密货币、指数、股票。 限时优惠:支撑和阻力筛选指标仅售 50美元,终身有效。(原价 250 美元)(优惠延长) 趋势筛选器是有效的指标趋势跟踪指标,它在图表中提供带有点的箭头趋势信号。 趋势分析器指标中可用的功能: 1.趋势扫描仪。 2. 具有最大利润分析的趋势线。 3.趋势货币强度计。 4. 带有警报的趋势反转点。 5. 带有警报的强趋势点。 6. 趋势箭头 每日分析示例,每日信号表现...等与我们的趋势筛选指标,可以在这里找到: 点击这里 限时优惠:Trend Screener Indicator 仅售 50 美元且终身可用。原价 125$) 通过访问我们的 MQL5 博客,您可以找到我们所有的高级指标以及分析示例、每日信号表现...等。 : 点击这里 我们的趋势系统由 2 个指标组成: 1. Trend Screener Indicator:显示趋势仪表盘、图表中的趋势线、入场点...等。 2. Trend
Scalper Inside PRO
Alexey Minkov
4.77 (65)
!SPECIAL SALE! An exclusive indicator that utilizes an innovative algorithm to swiftly and accurately determine the market trend. The indicator automatically calculates opening, closing, and profit levels, providing detailed trading statistics. With these features, you can choose the most appropriate trading instrument for the current market conditions. Additionally, you can easily integrate your own arrow indicators into Scalper Inside Pro to quickly evaluate their statistics and profitability
FX Volume
Daniel Stein
4.6 (35)
FX Volume:从经纪商视角洞察真实市场情绪 简要概述 想要提升您的交易策略? FX Volume 可提供零售交易者和经纪商的持仓实时数据——远早于诸如 COT 之类的延迟报告。不论您希望获得持续稳定的收益,还是想在市场中多一分制胜的砝码, FX Volume 都能帮您识别重大失衡、确认突破以及完善风险管理。立即开启体验,让真实的成交量数据为您的交易决策带来革新! 1. 为什么 FX Volume 对交易者格外有用 极具准确度的早期预警 • 快速捕捉有多少交易者正在买入或卖出某个货币对——比大多数人提前一步。 • FX Volume 是 唯一 能够整合多家零售经纪商真实成交量数据并以简洁方式呈现的工具。 强力风险管理 • 及时识别多头或空头仓位的巨大不平衡,这往往预示着潜在的趋势反转,帮助您更自信地设置止损和目标位。 • 独家而真实的数据让每一次交易决策更具可靠性。 优化进场与出场点 • 发现“过度集中”的交易(大多数交易者都在同一方向),并通过真实成交量来确认突破。 • 避免依赖常见指标可能带来的误导信号,而是利用真实的实时成交量。 适配各种交易策略 • 将 FX
Algo Pumping MT4
Ihor Otkydach
5 (7)
PUMPING STATION – 您的专属“全包式”交易策略 我们为您推出PUMPING STATION —— 一款革命性的外汇指标,它将使您的交易变得更加有趣且高效。这不仅仅是一个辅助工具,而是一套完整的交易系统,具备强大的算法,帮助您开始更加稳定的交易。 购买本产品,您将免费获得: 专属设置文件:用于自动配置,实现最大化性能。 逐步视频教程:学习如何使用PUMPING STATION策略进行交易。 Pumping Utility:专为PUMPING STATION打造的半自动交易机器人,让交易变得更加方便和简单。 购买后请立即联系我,我将为您提供所有额外资源的访问权限。 PUMPING STATION如何工作: 趋势监控:能够即时识别市场趋势方向。趋势是您最好的朋友。 进场信号:图表上的箭头会提示您何时进场以及交易方向。 明确的交易目标:指标会自动识别最佳的平仓时机。 回调交易:内置的基于布林带的价格通道可检测修正结束并发出新趋势开始的信号。 效率分析:如果当前设置效果较差,系统会自动提示。只需调整PUMPING STATION,即可获得最佳性能。 功能强大: 推送和邮件通知:即
TPSproTREND PrO
Roman Podpora
4.68 (25)
VERSION MT5        —        ИНСТРУКЦИЯ RUS           —        INSTRUCTIONS  ENG 主要功能: 准确的输入信号,无需渲染! 如果出现信号,它仍然相关!这是与重提指标的一个重要区别,重提指标可以提供信号然后改变信号,这可能导致存款资金的损失。现在您可以以更高的概率和准确度进入市场。还有一个功能是在箭头出现后为蜡烛着色,直到达到目标(止盈)或出现反转信号。 显示止损/获利区域 为了提高搜索切入点时的视觉清晰度,创建了一个模块,该模块最初显示买入/卖出区域,在该区域中搜索进入市场的最佳点。用于处理止损水平的附加智能逻辑有助于随着时间的推移减小其大小,从而降低进入交易(移动 sl)时的初始风险。 显示较高时间范围内的最小值/最大值(MTF 模式) 添加了一项功能,可以显示较高时间间隔的最小/最大校正位置,并显示趋势变化。此外,MIN/MAX 现在有编号,显示修正内容。 风险回报率 (RR) 使用指标算法,可以检测精确的入场点,平均风险回报比超过1k2。这也伴随着视觉效果,例如,收到信号后会出现蜡烛的彩色草图。 无论价
Advanced Supply Demand
Bernhard Schweigert
4.91 (294)
现在优惠 33%! 任何新手或专业交易者的最佳解决方案! 该指标是一款独特、高质量、且价格合理的交易工具,因为我们已经整合了许多专有功能和新公式。 依据此更新,您将能够显示双重时间帧区域。 您不仅可以显示一个较高的时间帧,还可以同时显示图表时间帧,加上更高的时间帧:显示嵌套时区。 供需双方所有交易者都会喜欢它。 :) 重要信息披露 高级供需的最大潜力,请访问 https://www.mql5.com/zh/blogs/post/720245   想象您的交易如何得以改善,是因为您能够精准定位入场或目标位吗? 构建于新的底层算法,它可以更轻松地识别出买卖双方之间的潜在失衡。 这是因为它以图形方式展示供需最强劲区域,及其过去的表现(显示旧区域)。 这些功能旨在帮助您更轻松地发现最佳入场区域和价位。 现在您可以针对您的交易品种和时间帧来优化和编辑区域强度! 高级供需指标适用于所有产品和时间帧。 它是一个新的公式,非常新的功能是两个区域强度函数可由用户输入进行调整! 这在交易中是一大优势。 当您学习如何使用专有功能,例如带有价格游离最小 X 因子的区域强度时,您能够判断该区域强劲与否。 供需
System Trend Pro
Aleksandr Makarov
5 (2)
Special offer! https://www.mql5.com/ru/users/bossik2810 System Trend Pro - This is the best trend trading indicator!!! The indicator no repaint!!!  The indicator has   MTF   mode, which adds confidence to trading on the trend (   no repaint   ). How to trade? Everything is very simple, we wait for the first signal (big arrow), then wait for the second signal (small arrow) and enter the market in the direction of the arrow. (See screens 1 and 2.) Exit on the opposite signal or take 20-30 pips,
Currency Strength Exotics
Bernhard Schweigert
4.88 (32)
目前8折优惠! 对任何新手或专家交易者来说都是最好的解决方案! 这个指标是专门用来显示任何符号的货币强度,如异国货币对、商品、指数或期货。它是同类产品中的第一个,任何符号都可以添加到第9行,以显示黄金、白银、石油、DAX、US30、MXN、TRY、CNH等的真实货币强度。这是一个独特的、高质量的、负担得起的交易工具,因为我们已经纳入了一些专有的功能和一个新的公式。想象一下,你的交易将如何改善,因为你能够准确地确定新趋势或剥头皮机会的触发点? 用户手册:点击这里   https://www.mql5.com/en/blogs/post/708876 它适用于所有时间框架。你将很快能够看到TREND! 根据新的基础算法设计,它使识别和确认潜在交易变得更加容易。这是因为它以图形方式显示了8种主要货币和一种符号的强弱。 该指标显示了8种主要货币(澳元加元瑞士法郎欧元英镑日元新西兰美元)的强弱线,再加上一个符号! 该指标显示了符号的真实价值。例如:对于XAUUSD(黄金):价格以美元报价。如果黄金在上涨,你怎么能知道是黄金的强势还是美元的弱势?只有当黄金走强时,我们才会进行交易。该指
目前八折优惠! 对任何新手或专家交易者来说都是最好的解决方案! 这个仪表板软件适用于28种货币对。它基于我们的两个主要指标(高级货币强度28和高级货币冲动)。它对整个外汇市场提供了一个伟大的概述。它显示高级货币强度值,货币运动速度和28个外汇对在所有(9)时间段的信号。想象一下,当你可以使用图表上的单一指标观察整个市场,以确定趋势和或剥头皮的机会时,你的交易将得到改善 我们已经在这个指标中建立了一些功能,使你更容易识别强势和弱势货币,同时识别和确认潜在的交易。该指标以图形方式显示货币的强势或弱势是增加还是减少,以及它在所有时间段的表现。 增加的新功能是动态市场斐波那契水平,它适应当前的市场条件变化,这是一个已经在我们的高级货币强度28和高级货币冲动指标中使用的成熟的加分项。 在交易时,总是将弱势货币和强势货币配对,这个新指标将帮助你做到这一点。 用户手册:点击这里  https://www.mql5.com/en/blogs/post/708783 特点  显示每个时间段的ACS28和GAP-speed(冲动)的货币强度值。 列:颜色代码以7种颜色显示货币强度:强势
GOLD Impulse with Alert
Bernhard Schweigert
4.6 (10)
这个指标是我们2个产品 Advanced Currency IMPULSE with ALERT  +   Currency Strength Exotics 的一个超级组合。 它适用于所有时间框架,并以图形方式显示8种主要货币和一种符号的强势或弱势冲动! 该指标专门用于显示任何符号的货币强度加速,如黄金、异国货币对、商品、指数或期货。这是它的第一个指标,任何符号都可以被添加到第9行,以显示黄金、白银、石油、DAX、US30、MXN、TRY、CNH等的真实货币强度加速(冲动或速度)。 建立在新的基础算法上,它使识别和确认潜在的交易更加容易。这是因为它以图形方式显示了一种货币的强势或弱势是否正在加速,并测量了这种加速的速度--把它想象成你汽车中的速度表。当你加速时,事情显然会发生得更快,这在外汇市场上也是一样的,即如果你配对的货币正在向相反的方向加速,你就会发现一个潜在的有利可图的交易。 动态市场斐波那契28水平被用作警报触发器,将适应市场活动。如果冲动击中黄色触发线,你将收到警报。然后你就知道作为一个交易员应该做什么。货币对和方向已经给出。只需点击警报按钮,就可以切换到该货
M1 Arrow
Oleg Rodin
5 (17)
M1 Arrow - 基于市场的两个基本原则的盘中策略。 该算法基于使用附加过滤器对交易量和价格波动的分析。该指标的智能算法仅在两个市场因素合二为一时才会发出信号。该指标使用较高时间框架的数据计算 M1 图表上某个范围的波浪。为了确认波浪,该指标使用了成交量分析。 从理论上讲,该指标可以与其他时间框架一起使用,但您需要考虑到该指标最初是为在 M1 上交易而开发的这一事实。 该指标是一个现成的交易系统。交易者所需要的只是跟随信号。此外,该指标可以成为您自己的交易系统的基础。交易仅在分钟图表上进行。 尽管指标使用 MTF 原理,但指标算法尽可能稳定。 购买后,一定要写信给我!我将与您分享我的交易设置和建议!祝您交易成功!感谢您的关注!
Trend Arrow Super
Aleksandr Makarov
5 (2)
Special offer! https://www.mql5.com/ru/users/bossik2810 Trend Arrow Super The indicator not repaint or change its data. A professional, yet very easy to use Forex system. The indicator gives accurate BUY\SELL signals. Trend Arrow Super is very easy to use, you just need to attach it to the chart and follow simple trading recommendations. Buy signal: Arrow + Histogram in green color, enter immediately on the market to buy. Sell signal: Arrow + Histogram of red color, enter immediately on the m
FX Power MT4 NG
Daniel Stein
4.94 (18)
FX Power:分析货币强度,助您做出更明智的交易决策 概述 FX Power 是一款专业工具,帮助您全面了解主要货币和黄金在任何市场条件下的真实强度。通过识别强势货币用于买入,弱势货币用于卖出, FX Power 简化了交易决策,并帮助您发现高概率的交易机会。不论您是想跟随趋势还是通过极端的 Delta 值预测反转,这款工具都能完美适应您的交易风格。别再盲目交易——用 FX Power 让您的交易更加智慧。 1. 为什么 FX Power 对交易者极具价值 实时货币和黄金强度分析 • FX Power 实时计算并显示主要货币和黄金的相对强度,助您全面了解市场动态。 • 监控领先或落后资产,轻松识别值得交易的货币对。 全面的多时间框架视图 • 跟踪短期、中期和长期时间框架的货币和黄金强度,以便将您的交易策略与市场趋势保持一致。 • 无论是快进快出的短线交易还是更长期的投资策略, FX Power 都能为您提供所需的信息。 Delta 动态分析用于趋势和反转 • 极端 Delta 值常常预示反转机会,而平缓的 Delta 变化则确认趋势延续。 • 使用 Delta 分析,轻
StalkeR Arrow
Abdulkarim Karazon
5 (3)
StalkeR Arrow 是一个箭头指标,可在柱形开盘/柱内发出买入和卖出信号,该指标基于价格行为模式和分形 该指标为每个买入和卖出信号提供 tp 和 sl ,tp 和 sl 以线的形式出现在每个信号的上方和下方,它们会延伸直至形成新的信号。 该指标具有回溯测试面板/仪表板,可提供历史信号的赢/输统计数据,该指标不会重新绘制或背面绘制。 参数 : StalkeR 周期:箭头周期,数字越大,信号越少 spread : 将使用以点为单位的点差值来计算面板上的盈利和亏损 止损 ATR x : atr 乘法中的止损值 止盈 ATR x : atr 乘法中的 TP 值 ATR period : 用于计算 tp 和 sl 的 atr 周期 TP/SL 线颜色和宽度 箭头颜色和宽度 面板/仪表板位置。 警报/电子邮件/通知
Easy Breakout
Mohamed Hassan
5 (12)
After your purchase, feel free to contact me for more details on how to receive a bonus indicator called VFI, which pairs perfectly with Easy Breakout for enhanced confluence!   Easy Breakout is a powerful price action trading system built on one of the most popular and widely trusted strategies among traders: the Breakout strategy ! This indicator delivers crystal-clear Buy and Sell signals based on breakouts from key support and resistance zones. Unlike typical breakout indicators, it levera
Golden Trend Indicator
Noha Mohamed Fathy Younes Badr
5 (10)
Golden Trend indicator  is The best indicator for predicting trend movement this indicator never lags and never repaints and never back paints    and give  arrow buy and sell    before the candle appear  and it will help you and  will make your trading decisions clearer its work on all currencies and  gold and crypto and all time frame This unique  indicator uses very secret algorithms to catch the  trends, so you can trade using this indicator and see the trend clear on charts  manual guide and
Dynamic Forex28 Navigator
Bernhard Schweigert
5 (5)
Dynamic Forex28 Navigator - 下一代外汇交易工具。 当前 49% 折扣。 Dynamic Forex28 Navigator 是我们长期流行的指标的演变,将三种功能合二为一: 高级货币强度 28 指标 (695 条评论)+ 高级货币 IMPULSE 带警报 (520 条评论)+ CS28 组合信号(奖励)。 有关指标的详细信息 https://www.mql5.com/en/blogs/post/758844 下一代强度指标提供什么? 您喜欢的原始指标的一切,现在通过新功能和更高的精度进行了增强。 主要特点: 专有货币强度公式。  所有时间范围内的平滑和准确的强度线。 非常适合识别趋势和精确进入。 动态市场斐波那契水平(市场斐波那契)。  此指标独有的独特功能。 斐波那契应用于货币强度,而不是价格图表。 适应实时市场活动以获得准确的反转区域。 实时市场动量。  第 9 行显示市场是活跃还是被动。 对于定时交易至关重要。 全面的警报和显示。  每种货币最强的买入和卖出动量。 ​​28 对的双重动量买入和卖出。 超买/超卖警告外部范围和止损。 反转
TPSpro RFI Levels
Roman Podpora
4.85 (27)
反转区域 / 峰值交易量 / 主要参与者的活跃区域 =       TS TPSPRO系统 俄语使用说明     /       指示     英语     /       Version MT5 该指标的每位购买者还可免费获得: 6 个月内可访问 RFI SIGNALS 服务的交易信号 - 根据 TPSproSYSTEM 算法准备的切入点。 定期更新的培训材料 - 让您沉浸在策略中并提高您的专业水平。 工作日每天 24 小时提供支持,并可以访问封闭的交易者聊天室 - 沟通、协助和市场情况分析。 作者设定的文件——自动指标设置,无需额外努力即可实现最大效果。 主要功能: 显示卖家和买家的活跃区域! 指标显示所有正确的买入和卖出第一脉冲水平/区域。当这些水平/区域被激活时,即开始寻找切入点的地方,水平会改变颜色并填充特定颜色。还会出现箭头,以便更直观地了解情况。 LOGIC AI - 激活模板时显示用于搜索入口点的区域(圆圈) 为了提高视觉清晰度,添加了使用人工智能搜索入口点的显示区域的功能。 显示更高时间范围内的级别/区域(MTF 模式) 添加了使用更高时间间隔显示级别/区域的功能
Stratos Pali
Michela Russo
5 (3)
Stratos Pali Indicator   is a revolutionary tool designed to enhance your trading strategy by accurately identifying market trends. This sophisticated indicator uses a unique algorithm to generate a complete histogram, which records when the trend is Long or Short. When a trend reversal occurs, an arrow appears, indicating the new direction of the trend. Important Information Revealed Leave a review and contact me via mql5 message to receive My Top 5 set files for Stratos Pali at no cost! Dow
Hit Rate Top Bottom Signal
Martin Alejandro Bamonte
命中率顶部底部信号 命中率顶部底部信号 命中率顶部底部信号 提供了一种完全创新的方法。 它非常适合那些希望预先评估信号在特定 TP-SL 下的表现以及在哪些货币对/时间框架(TF)中效果最佳的人。 命中率顶部底部信号 策略是 任何交易员和任何交易类型 的重要工具,因为它不仅发出 精确且不重绘的信号 ,明确指示何时交易以及交易方向,而且还 详细记录每个货币对和时间框架的命中率 ,并预设止盈(TP)和止损(SL)。 这使得能够提前知道信号的有效性比率 ,对于良好的风险管理和精确的交易至关重要。 该策略的独特之处在于它专注于在波动的反转点进行检测,而不是在整个行情中,这使得信号的发出频率比传统的顶部底部信号更高,专注于 市场每一个重要波动的关键时刻。 这种以百分比显示 信号历史效果与SL/TP比率结合的能力 使得这项策略成为安全交易的最佳选择,让交易员能够基于数据做出决策。 依靠一个不仅清晰直接而且历史记录良好的信号,我们正在使用市场上最好的策略之一。 如何使用该系统进行交易? 打开多个货币对并在每个货币对上加载指标。现在,分析每个货币对,以确定哪些货币对和时间框架(TF)信号效果
Market Structure Break Out
Ashkan Hazegh Nikrou
5 (3)
Market Structure Break Out(MSB) 是一款为 MT4 和 MT5 平台 设计的高级工具,帮助交易者以结构的角度观察市场走势。它通过箭头和警报提示,标示出趋势方向和反转方向的关键 交易信号 。 其一大亮点功能是能够绘制 持续的供需区域 ,让交易者清晰了解关键价格区域。此外, 实时回测功能 使用户能够在图表上直接查看该指标在历史中的表现,增强了信号的透明度与可信度。 产品当前价格为 69 美元,仅限时优惠,下一个 Market Structure 的价格将为 99 美元。 MT5 版本的产品在此: https ://www .mql5 .com /en /market /product /124690 该指标正在持续更新。 我们努力提供基于市场结构的高精度进场和出场点。当前版本为1.6,以下是最新的更新内容,欢迎加入我们: 买卖目标: 清晰了解买入和卖出仓位的最佳止盈水平。 最新MSB方向: 通过显示最近的市场结构突破方向,保持最新动态,做出更好的决策。 增强视觉模式: 使用新的美观模式自定义您的图表,包括浅色、深色或个性化主题。 实时回测开关: 通过屏幕上的
Currency Strength Wizard
Oleg Rodin
4.86 (49)
货币强度向导是一个非常强大的指标,为您提供成功交易的一体化解决方案。该指标使用多个时间范围内所有货币的数据来计算这个或那个外汇对的力量。此数据以易于使用的货币指数和货币电力线的形式表示,您可以使用它们来查看这种或那种货币的力量。 您所需要的只是将指标附加到您要交易的图表上,该指标将向您显示您交易的货币的真实强度。该指标还向您显示买卖量压力的极值,您可以在顺势交易时利用这些压力。该指标还显示了基于斐波那契的可能目标。该指标可用于各种交易时间范围。该指标支持各种货币对的交易。 该指标为您提供所有类型的警报,包括推送通知。 购买后请联系我。我将与您分享我的交易技巧,并免费为您提供丰厚的红利指标! 祝您交易愉快,获利丰厚!
Quantum Trend Sniper Indicator MT4
Bogdan Ion Puscasu
4.68 (40)
介绍   量子趋势狙击指标 ,突破性的 MQL5 指标,正在改变您识别和交易趋势反转的方式!由拥有超过13年交易经验的资深交易员团队开发,     量子趋势狙击指标   旨在通过其创新的方式以极高的准确度识别趋势反转,将您的交易之旅推向新的高度。 ***购买量子趋势狙击指标,即可免费获得量子突破指标!*** 当量子突破指标识别出趋势反转时,它会向您发出警报和信号箭头,并建议您三个止盈水平。 它既适合新手交易者,也适合专业交易者。 量子 EA 通道:       点击这里 MT5版本:       点击这里 建议: 时间范围:  所有时间范围。为了获得最佳结果,我们建议在 M15、M30 和 H1 时间范围内使用它。 货币对:欧元兑美元、英镑兑美元、澳元兑美元、欧元兑英镑, EURAUD, XAUUSD 账户类型:ECN、Raw 或 Razor,点差极低 经纪时间:任意 经纪商:IC Markets、Pepperstone with Raw 和 Razor 的点差最低 建议止损:50 点 建议止盈水平:20 点、50 点和 100 点 规格: 不重漆! 最多
IQ FX Gann Levels
INTRAQUOTES
5 (2)
IQ FX Gann Levels a precision trading indicator based on W.D. Gann’s square root methods. It plots real-time, non-repainting support and resistance levels to help traders confidently spot intraday and scalping opportunities with high accuracy. William Delbert Gann (W.D. Gann) was an exceptional market analyst, whose trading technique was based on a complex blend of mathematics, geometry, astrology, and ancient mathematics which proved to be extremely accurate. Download the Metatrader 5 Version M
Chart Patterns All in One
Davit Beridze
4.68 (19)
以演示模式试用 "Chart Patterns All in One" 并获得奖励。试用后,请发送消息给我以领取奖励。 购买后留言即可获得8个高质量的指标作为赠品。 Chart Patterns All-in-One 指标帮助交易者可视化技术分析中常用的各种图表形态。它帮助识别潜在的市场行为,但不保证盈利。建议在购买前在模拟模式下测试该指标。 当前优惠 : “Chart Patterns All in One” 指标享受 50% 折扣。 包含的形态 : 1-2-3 形态 :通过三个关键点(高点或低点)检测市场反转。 买入 :连续两个低点后出现较低的高点。 卖出 :连续两个高点后出现较高的低点。 可视化 :线条和箭头连接识别的点。 双顶和双底 :当价格形成两个连续的高点(双顶)或低点(双底)且它们大致相等时,表明反转趋势。 双顶 :看跌反转。 双底 :看涨反转。 可视化 :线条连接峰值或低谷,箭头标记反转点。 三顶和三底 :与双顶/双底类似,但有三个连续的高点或低点,信号更强的反转趋势。 三顶 :看跌反转。 三底 :看涨反转。 可视化 :线条和箭头标记形态。 三角形 :在趋势延续前识别
Advanced Currency Strength28 Indicator
Bernhard Schweigert
4.9 (652)
目前26%的折扣 任何新手或专家交易者的最佳解决方案! 这个指标是一个独特的、高质量的、可负担得起的交易工具,因为我们纳入了一些专有的功能和一个新的公式。只需一个图表,你就可以读出28个外汇对的货币强度!想象一下,你的交易将如何得到改善,因为你的交易是在你的手中进行的。想象一下,你的交易将如何改善,因为你能够准确地确定新趋势或剥头皮机会的触发点? 用户手册:点击这里  https://www.mql5.com/en/blogs/post/697384 这是第一本,原版的! 不要买一个毫无价值的崇拜者的克隆品。 特别的 子窗口中的箭头显示强劲的货币势头GAP将指导你的交易! 当基础货币或报价货币处于超卖/超买区域(外盘斐波那契水平)时,在个人图表的主窗口中出现警告信号。 当货币力量从外围区间回落时,回撤/反转警报。 十字星模式的特别警报 可选择多个时间框架,以快速查看趋势! 货币强度线在所有的时间框架中都非常平稳,当使用较高的时间框架来识别总体趋势,然后使用较短的时间框架来确定精确的入口时,效果非常好。你可以根据自己的意愿选择任何时间框架。每个时间框架都由其自身进行了优化。
PRO Renko System
Oleg Rodin
5 (26)
PRO Renko Arrow Based System for trading renko charts.  准确的信号交易任何外汇工具. 另外,我将免费提供系统的附加模块! PRO Renko系统是RENKO图表上高度准确的交易系统。该系统是通用的。 该交易系统可应用于各种交易工具。 该系统有效地中和了所谓的市场噪音,打开了获得准确反转信号的通道。 该指标易于使用,只有一个参数负责产生信号。 您可以很容易地使算法适应您感兴趣的交易工具和renko酒吧的大小。 我很乐意通过提供任何咨询支持来帮助所有客户有效地使用该指标。 祝您交易成功!购买后,立即写信给我! 我将与您分享我的建议和我的renko发电机。 另外,我将免费提供系统的附加模块!
作者的更多信息
UniversalEA
Sergey Deev
3.4 (5)
The Expert Advisor allows you to build a trading system based on a custom indicator. It performs automated opening/closing of deals based on the signals of an indicator that places values ​​other than 0 and EMPTY_VALUE in the buffer. The EA polls the values ​​of the specified indicator buffers, opens/closes and accompanies trades according to the specified parameters. The Expert Advisor implements the following trade support functions: - installation for the transaction SL and TP; - calculation
The indicator detects and displays М. Gartley's Butterfly pattern. The pattern is plotted by the extreme values of the ZigZag indicator (included in the resources, no need to install). After detecting the pattern, the indicator notifies of that by the pop-up window, a mobile notification and an email. The pattern and wave parameters are displayed on the screenshots. The default parameters are used for demonstration purposes only in order to increase the amount of detected patterns. Parameters z
RenkoZigZag
Sergey Deev
The indicator displays Renko bars on the chart and uses them to plot the ZigZag - trend lines connecting the local Lows and Highs of the price movement. Renko - specialized display of the price action, in which the graph is displayed not every bar of the time frame, but only under the condition that the price had passed more than the specified number of points. Renko bars are not bound to a time frame, so the indicator can work on any time frame with the same efficiency. This implementation of t
EA Locking Grid
Sergey Deev
5 (1)
Semiautomatic EA for trading based on the averaging and locking strategy. The trader sends signals for opening grids by using the buttons on the chart. The EA opens a market order, places a grid of limit orders in the same direction with lot multiplication according to specified parameters and a locking stop order in the opposite direction with the volume equal to the sum of all the previous ones. Once the price passes the specified breakeven level, the EA places a stop loss at the open price+sp
The indicator displays the data of the Stochastic oscillator from a higher timeframe on the chart. The main and signal lines are displayed in a separate window. The stepped response is not smoothed. The indicator is useful for practicing "manual" forex trading strategies, which use the data from several screens with different timeframes of a single symbol. The indicator uses the settings that are identical to the standard ones, and a drop-down list for selecting the timeframe. Indicator Paramet
The indicator displays the data of the candles from a higher timeframe on the chart. Only the candle body (by the open and close prices) is displayed. The candlesticks are colored depending on the difference between the open and close prices. After removing the indicator from the chart, the objects used by it are deleted automatically. Indicator Parameters TimeFrame - time frame (drop-down list) BearColor - bearish candle color (standard dialog) BullColor - bullish candle color (standard dialog
MTF MACD
Sergey Deev
The indicator displays the data of a standard MACD indicator from a higher timeframe. The product features notifications of crossing the zero or signal line by the histogram. Parameters TimeFrame - indicator timeframe (dropdown list) MacdFast - fast line period MacdSlow - slow line period MacdSignal - signal line period MacdPrice - price type (dropdown list) AlertCrossZero - enable notifications of crossing the zero line AlertCrossSignal - enable notifications of crossing the signal line UseNot
The indicator displays the moving average of a higher timeframe on the chart. The indicator parameters TimeFrame - time frame of the moving average (drop-down list) MaPeriod - moving average period MaMethod - moving average method (drop-down list) MaShift - moving average shift MaPrice - moving average price (drop-down list)
MTF ATR
Sergey Deev
The indicator displays the data of the Average True Range (ATR) from a higher timeframe on the chart. It allows you to see the scope of the movement without having to switch to another screen terminal The indicator parameters TimeFrame - time frame of the data (drop-down list) can not be lower than current AtrPeriod - period of the Average True Range indicator a higher timeframe range
MTF ADX
Sergey Deev
5 (1)
The indicator displays the data of the standard ADX indicator from a higher timeframe on the chart. Several indicators with different timeframe settings can be placed on a single chart. The indicator parameters TimeFrame - time frame of the data (drop-down list) can not be lower than current AdxPeriod - period of the indicator for a higher timeframe AdxPrice - prices for the calculation of the indicator data from a higher timeframe
MACD Divergence
Sergey Deev
2.5 (2)
The indicator detects divergence signals - the divergences between the price peaks and the MACD oscillator values. The signals are displayed as arrows in the additional window and are maintained by the messages in a pop-up window, e-mails and push-notifications. The conditions which formed the signal are displayed by lines on the chart and in the indicator window. Indicator Parameters MacdFast - fast MACD line period MacdSlow - slow MACD line period MacdSignal - MACD signal line period MacdPric
The indicator detects and displays М. Gartley's Butterfly pattern. The pattern is plotted by the extreme values of the ZigZag indicator (included in the resources, no need to install). After detecting the pattern, the indicator notifies of that by the pop-up window, a mobile notification and an email. The pattern and wave parameters are displayed on the screenshots. The default parameters are used for demonstration purposes only in order to increase the amount of detected patterns. Parameters z
The indicator displays the price movement on the chart, which is smoothed by the root mean square function. The screenshot shows the moving average with period 20, the smoothed root mean square (red) and simple SMA (yellow). The indicator parameters MAPeriod - Moving average period MaPrice - applied price (drop down list, similar to the standard MovingAverage average) BarsCount - number of processed bars (reduces download time when attaching to the chart and using in programs).
SqrtDev
Sergey Deev
The indicator displays the standard price deviation from the root mean moving average line in the additional window. The screenshot displays the standard indicator (the lower one) and SqrtDev (the upper one). Parameters SqrtPeriod - root mean line and standard deviation period. SqrtPrice - applied price (drop-down list). BarsCount - amount of processed bars (reduces the download time when applying to a chart and using in programs).
Harmonic 50
Sergey Deev
The indicator detects and displays the 5-0 harmonic pattern on the chart according to the scheme provided in the screenshot. The pattern is plotted by the extreme values of the ZigZag indicator (included in the resources, does not require additional installation). After detecting the pattern, the indicator notifies of that by the pop-up window, a mobile notification and an email. The indicator highlights not only the complete figure, but also the time of its formation. During the formation the f
The indicator detects and displays the AB=CD harmonic pattern on the chart according to the scheme provided in the screenshot. The pattern is plotted by the extreme values of the ZigZag indicator (included in the resources, does not require additional installation). After detecting the pattern, the indicator notifies of that by the pop-up window, a mobile notification and an email. The indicator highlights not only the complete figure, but also the time of its formation. During the formation the
The indicator detects and displays the White Swan and Black Swan harmonic pattern on the chart according to the scheme provided in the screenshot. The pattern is plotted by the extreme values of the ZigZag indicator (included in the resources, does not require additional installation). After detecting the pattern, the indicator notifies of that by the pop-up window, a mobile notification and an email. The indicator highlights not only the complete figure, but also the time of its formation. Duri
The indicator detects and displays Shark harmonic pattern (see the screenshot). The pattern is plotted by the extreme values of the ZigZag indicator (included in the resources, no need to install). After detecting the pattern, the indicator notifies of that by a pop-up window, a mobile notification and an email. The indicator highlights the process of the pattern formation and not just the complete pattern. In the former case, it is displayed in the contour triangles. After the pattern is comple
The indicator detects and displays 3 Drives harmonic pattern (see the screenshot). The pattern is plotted by the extreme values of the ZigZag indicator (included in the resources, no need to install). After detecting the pattern, the indicator notifies of that by a pop-up window, a mobile notification and an email. The indicator highlights the process of the pattern formation and not just the complete pattern. In the former case, it is displayed in the contour triangles. After the pattern is com
The indicator detects and displays Cypher harmonic pattern also known as Anti-Butterfly (see the screenshot). The pattern is plotted by the extreme values of the ZigZag indicator (included in the resources, no need to install). After detecting the pattern, the indicator notifies of that by a pop-up window, a mobile notification and an email. The indicator highlights the process of the pattern formation and not just the complete pattern. In the former case, it is displayed in the contour triangle
The indicator displays ZigZag lines from a higher timeframe (see the example in the screenshot). The red thin line is the current timeframe's ZigZag, while a thicker yellow line is the higher timeframe's one. The indicator is repainted as the data is updated. Parameters Depth, Dev, Back - ZigZag parameters; BarsCount - amount of processed bars (reduces the initial download time and decreases the load when using in an EA); TimeFrame - indicator timeframe (cannot be lower than the current one).
RenkoMaSignals
Sergey Deev
1 (1)
The indicator displays Renko bars on the chart, plots two moving averages by them and generates buy/sell signals based on the conditions displayed in the screenshots and described below: the buy signal is formed if the fast moving average is above the slow moving average, from 4 to 10 consecutive bullish Renko bars are displayed, followed by no more than 2 bearish and one bullish Renko bars; the sell signal is formed if the fast moving average is below the slow moving average, from 4 to 10 conse
RenkoMacdSignals
Sergey Deev
1 (1)
The indicator displays renko bars on a chart, use them to plot MACD histogram and provides buy/sell signals: signal of MACD histogram crossing its signal line; signal of MACD histogram crossing the line 0. Renko is a non-trivial price display method. Instead of displaying each bar within a time interval, only the bars where the price moved a certain number of points are shown. Renko bars do not depend on a time interval, therefore the indicator works on any timeframe without losing its efficienc
RenkoMaStoch
Sergey Deev
1 (1)
The indicator displays renko bars on a chart, uses them to plot the fast and slow moving average and Stochastic, as well as it provides buy/sell signals: a buy signal is generated when the fast moving is above the slow one, and the signal line of Stochastic crosses the lower level from bottom up; a sell signal is generated when the fast moving is below the slow one, and the signal line of Stochastic crosses the upper level from top to bottom; Renko is a non-trivial price display method. Instead
The indicator displays Renko bars on the chart, uses them to plot the ZigZag - trend lines connecting the local Lows and Highs of the price movement, and highlights them based on the Gartley patterns, showing the potential price reversal points. Renko - specialized display of the price action, in which the graph is displayed not every bar of the time frame, but only under the condition that the price had passed more than the specified number of points. Renko bars are not bound to a time frame, s
RenkoMACD Divergence
Sergey Deev
1 (1)
The indicator displays renko bars on a chart, uses them to plot the MACD oscillator and determines the divergence conditions (divergences of price movements and oscillator values). The buy/sell signal is formed if the next High/Low price is not confirmed by the oscillator values. The ZigZag indicator is used to evaluate the extremums. Only the last 3 peaks are taken into account (see the screenshot). If peak 1 is higher than peak 2 or peak 3, and at the same time the macd value is lower, then a
RenkoABCD
Sergey Deev
The indicator displays renko bars on a chart and uses them to create ZigZag indicator - trend lines connecting local price movement Highs and Lows. The indicator, in turn, is used to create AB=CD displaying potential price reversal points. Renko is a non-trivial price display method. Instead of displaying each bar within a time interval, only the bars where the price moved a certain number of points are shown. Renko bars do not depend on a time interval, therefore the indicator works on any time
RenkoSarMA
Sergey Deev
The indicator calculates and displays renko bars using MA and PSAR data as well as provides buy/sell signals. Renko is a non-trivial price display method. Instead of displaying each bar within a time interval, only the bars where the price moved a certain number of points are shown. Renko bars do not depend on a time interval, therefore the indicator works on any timeframe without losing its efficiency. Buy signal forms when PSAR readings are moving down, MA is moving up, the price is closing ab
RenkoMaPriceChannel
Sergey Deev
1 (1)
The indicator displays Renko bars on the chart, uses their data to calculate and display the moving average, PriceChannel and generates buy/sell signals. Renko is a non-trivial price display method. Instead of displaying each bar within a time interval, only the bars where the price moved a certain number of points are shown. Renko bars do not depend on a time interval, therefore the indicator works on any timeframe without losing its efficiency. The PriceChannel indicator displays the upper, lo
The indicator displays Renko bars on the chart, uses their data to calculate and display the Bollinger Bands, MACD oscillator and generates buy/sell signals. Renko is a non-trivial price display method, in which a bar within a time interval is shown on the chart only if the price has moved a certain number of points. Renko bars do not depend on a time interval, therefore the indicator works on any timeframe without losing its efficiency. When attached to a chart, the indicator checks for presenc
筛选:
sunnychow
9051
sunnychow 2018.12.16 13:31 
 

用户没有留下任何评级信息

Maksym Mudrakov
30074
Maksym Mudrakov 2016.08.31 07:29 
 

用户没有留下任何评级信息

vahid jannati
2040
vahid jannati 2016.03.04 17:20 
 

用户没有留下任何评级信息

回复评论
版本 1.1 2021.11.18
Обновление под новый билд