• 概述
  • 评论 (22)
  • 评论 (118)
  • 新特性

Chart Patterns All in One

4.68

以演示模式试用 "Chart Patterns All in One" 并获得奖励。试用后,请发送消息给我以领取奖励。

购买后留言即可获得8个高质量的指标作为赠品。

Chart Patterns All-in-One 指标帮助交易者可视化技术分析中常用的各种图表形态。它帮助识别潜在的市场行为,但不保证盈利。建议在购买前在模拟模式下测试该指标。

当前优惠: “Chart Patterns All in One” 指标享受 50% 折扣。
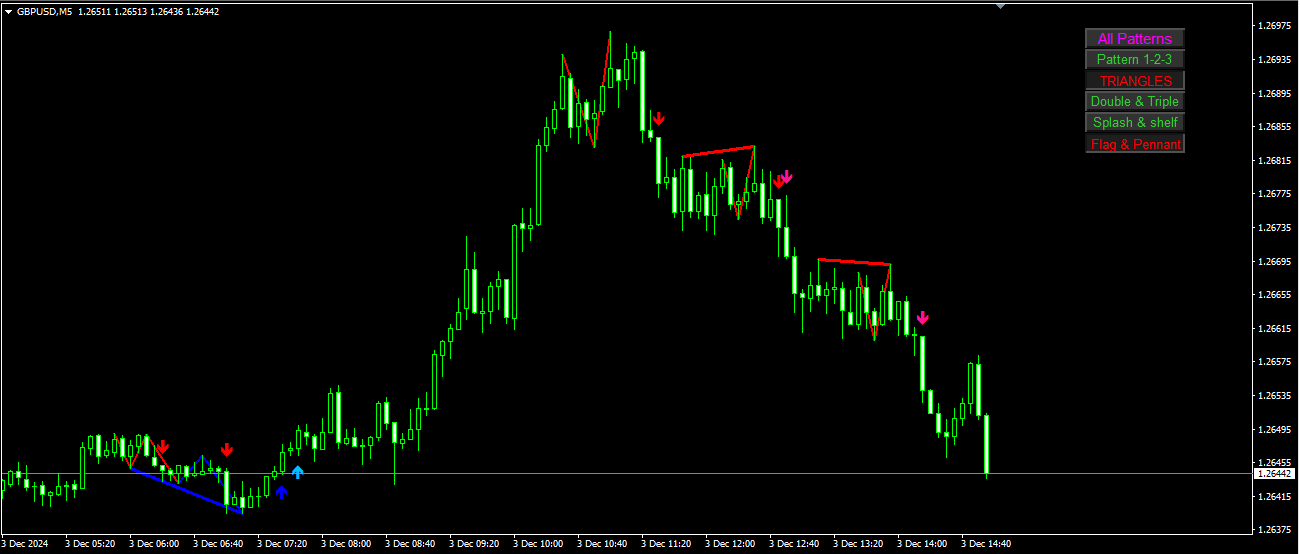
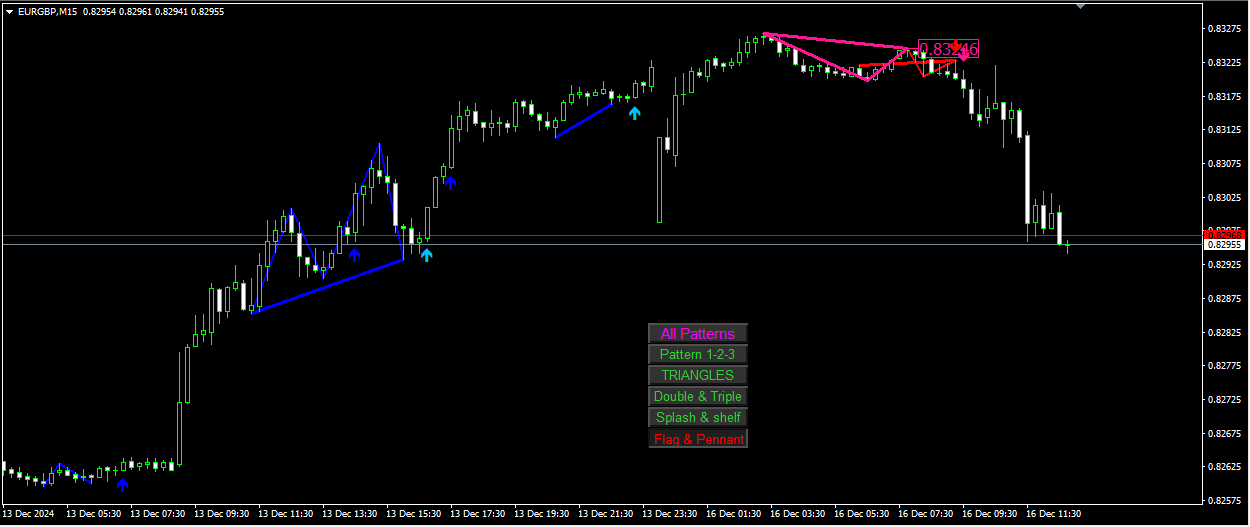
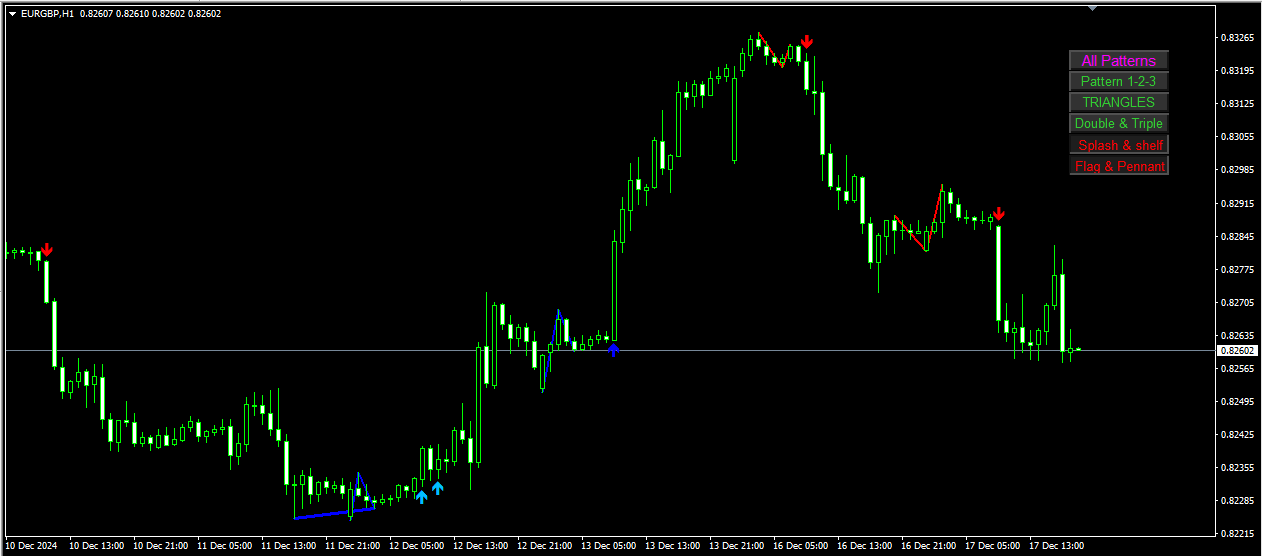
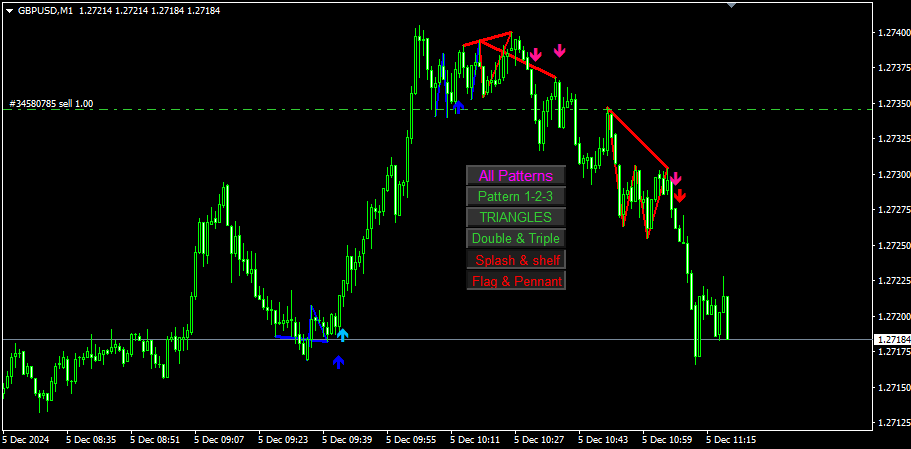
包含的形态

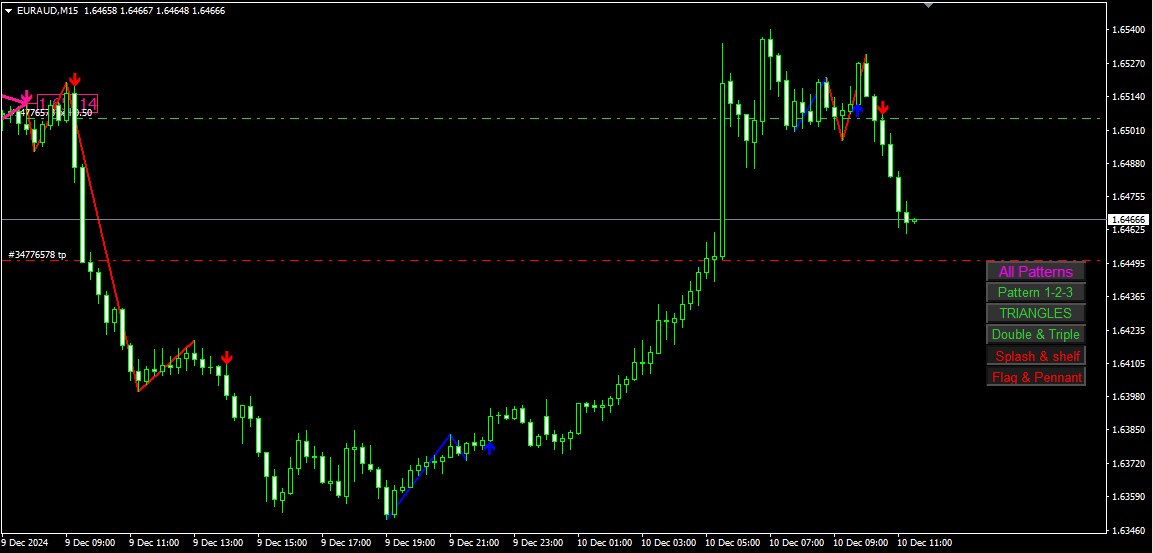
  • 1-2-3 形态:通过三个关键点(高点或低点)检测市场反转。

    • 买入:连续两个低点后出现较低的高点。
    • 卖出:连续两个高点后出现较高的低点。
    • 可视化:线条和箭头连接识别的点。
  • 双顶和双底:当价格形成两个连续的高点(双顶)或低点(双底)且它们大致相等时,表明反转趋势。

    • 双顶:看跌反转。
    • 双底:看涨反转。
    • 可视化:线条连接峰值或低谷,箭头标记反转点。
  • 三顶和三底:与双顶/双底类似,但有三个连续的高点或低点,信号更强的反转趋势。

    • 三顶:看跌反转。
    • 三底:看涨反转。
    • 可视化:线条和箭头标记形态。
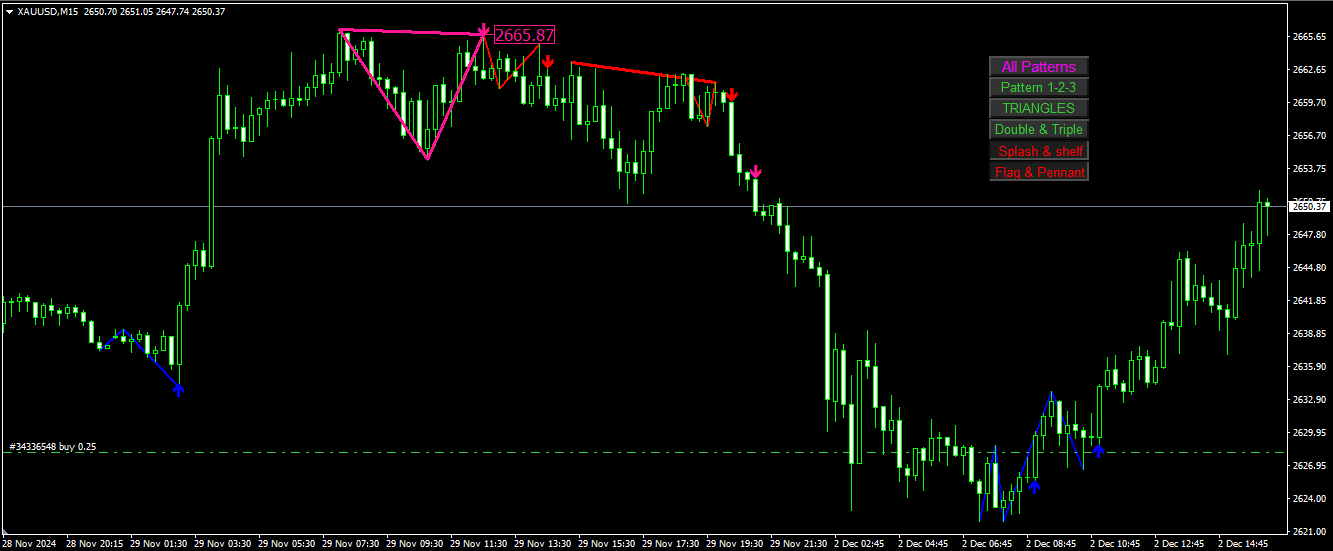
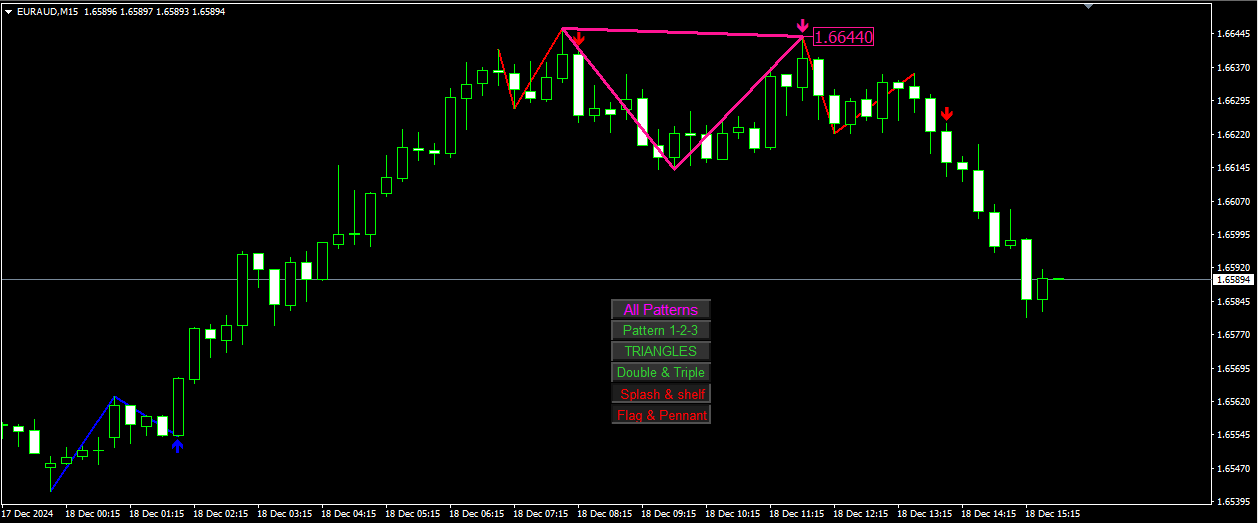
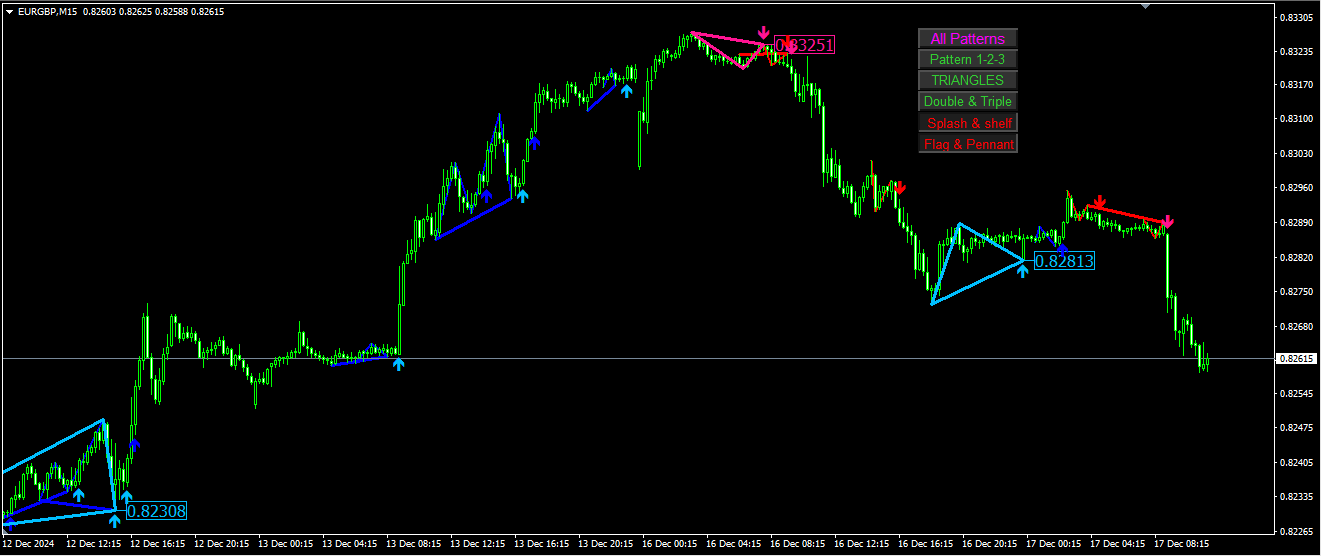
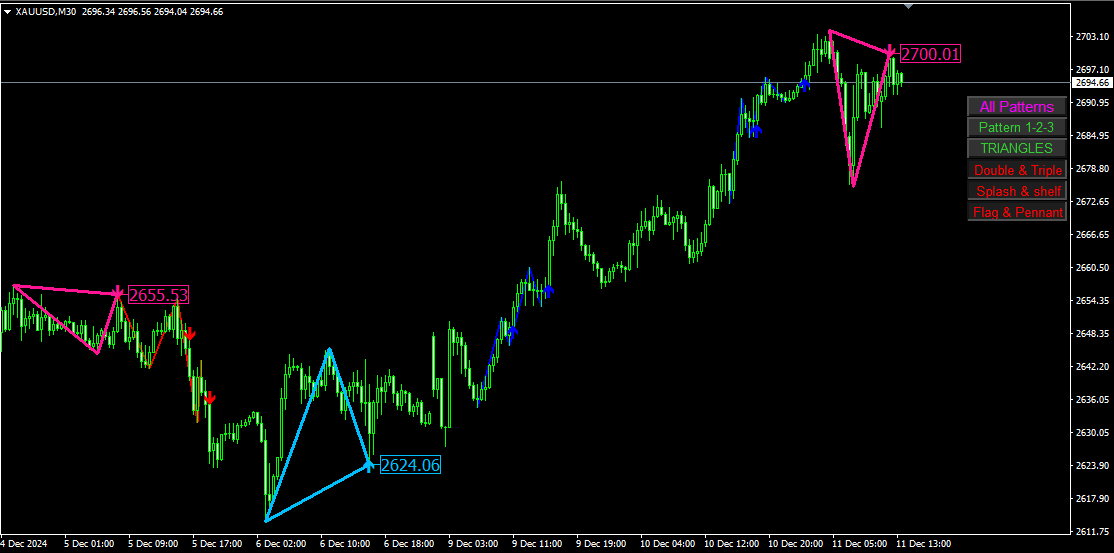
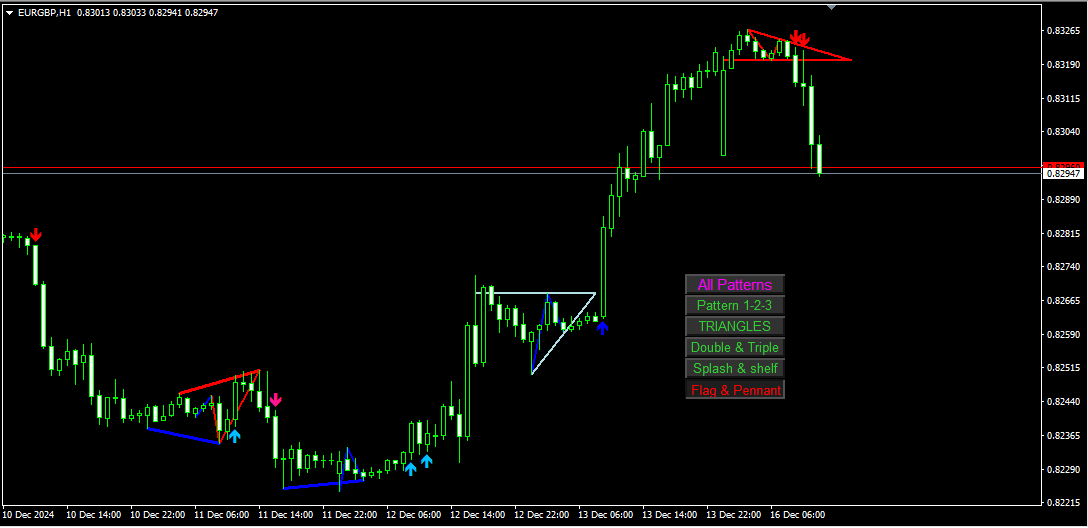
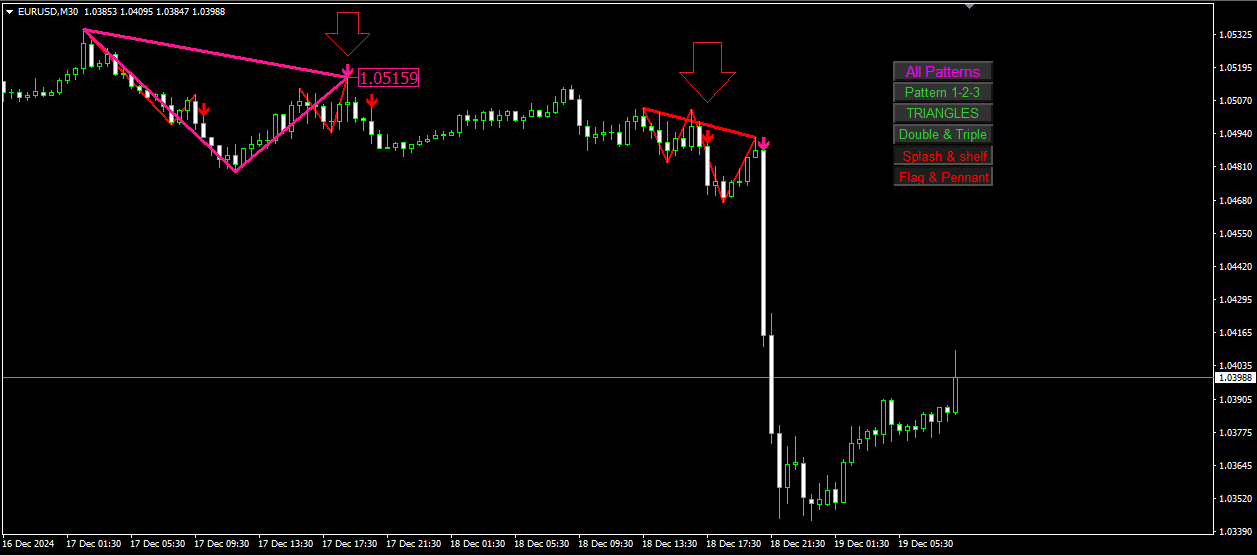
  • 三角形:在趋势延续前识别整合期(基于 Zig-Zag,有时可能会延迟出现或消失)。

    • 上升三角形:看涨延续。
    • 下降三角形:看跌延续。
    • 可视化:在图表上绘制三角形,并用箭头标记突破点。
    • 尽管由于 Zig-Zag 的原因可能会出现延迟或消失,但该形态仍然有效。有关详细信息,请观看视频。
  • Splash 和 Shelf:识别急剧的价格波动(Splash)后随之而来的整合阶段(Shelf),这可能表明潜在的突破。

    • Splash:急剧波动。
    • Shelf:Splash 之后的整合。
    • 可视化:为 Splash 和 Shelf 形态绘制趋势线。
  • 旗形和三角旗:短期延续形态,表明趋势在短暂停顿后恢复。

    • 看涨旗形:看涨趋势的延续。
    • 看跌旗形:看跌趋势的延续。
    • 三角旗:形成一个小的对称三角形的延续形态。
    • 可视化:形状和箭头标记形态及突破点。

功能

  • 切换形态:使用图表按钮轻松启用或禁用特定形态。
  • 自定义设置:调整颜色、线条宽度和特定形态的设置。
  • 提醒和通知:设置在检测到形态时的提醒。

可视化

  • 线条和箭头:清晰地显示形态。
  • 交互按钮:直接在图表上切换形态的可见性。

这个多合一指标简化了多个图表形态的分析,为 MT4 用户提供了一个灵活且可定制的工具。

评论 22
Lasse Michael Holm
1499
Lasse Michael Holm 2025.02.16 12:10 
 

It is a very accurate indicator. I really love it!!

ERWIN FONKE
363
ERWIN FONKE 2025.02.11 12:25 
 

i am only using the triangle signals of this indicator which are 90% accurate and are always winners. After my rent is over i will buy it

optioneer7
154
optioneer7 2025.01.10 15:57 
 

I dont like writing Reviews , this Time I HAVE to = During NFP when 99% of all fukkin indicators FAIL - - - NOT this ONE ! I made mucho2 $$$ + Davit ist da Best = https://www.forexfactory.com/attachment/image/4876627?d=1736694710

________ da NFP + FOMC [ google it ] ist da Most Feared Economics events , FEARED by REAL Time FX_Traders 4sure !

https://www.mql5.com/en/market/product/120552?source=Site+Profile#!tab=comments&comment=55655536&page=6

推荐产品
Auto Fibo Pro m
DMITRII GRIDASOV
“Auto FIBO Pro” Crypto_Forex 指标 - 是交易中的绝佳辅助工具! - 指标自动计算并放置在图表斐波那契水平和局部趋势线(红色)上。 - 斐波那契水平指示价格可能反转的关键区域。 - 最重要的水平是 23.6%、38.2%、50% 和 61.8%。 - 您可以将其用于反转剥头皮或区域网格交易。 - 还有很多机会可以使用 Auto FIBO Pro 指标来改进您当前的系统。 - 它具有信息价差掉期显示 - 它显示所连接的外汇对的当前价差和掉期。 - 显示屏还显示账户余额、净值和保证金。 - 可以将信息价差掉期显示定位在图表的任何角落: 0 - 左上角,1 - 右上角,2 - 左下角,3 - 右下角。 // 出色的交易机器人和指标可在此处获得: https://www.mql5.com/en/users/def1380/seller 这是仅在此 MQL5 网站上提供的原创产品。
Super Reversal Pattern
Parfait Mujinga Ndalika
Super Reversal Pattern Indicator Unlock the power of advanced pattern recognition with our Super Reversal Pattern Indicator. Designed for traders seeking precision and reliability, this indicator identifies one of the most effective reversal patterns in technical analysis, offering a significant edge in your trading strategy. Key Features: Non-Repainting Accuracy: Enjoy the confidence of non-repainting technology. Once a Super Reversal Pattern is detected, it remains static, providing consiste
Infinity Trend Pro
Yaroslav Varankin
1 (1)
This is a trend indicator without redrawing Developed instead of the binary options strategy (by the color of the Martingale candlestick) Also works well in forex trading When to open trades (binary options) A signal will appear in the place with a candle signaling the current candle It is recommended to open a deal for one candle of the current timeframe M1 and M5 When a blue dot appears, open a deal up When a red dot appears, open a trade down. How to open trades on Forex. When a signal is rec
Owl smart levels
Sergey Ermolov
4.24 (37)
MT5版本  |  FAQ Owl Smart Levels Indicator   是一個完整的交易系統,包含   Bill Williams   的高級分形、構建正確的市場波浪結構的 Valable ZigZag 以及標記準確入場水平的斐波那契水平等流行的市場分析工具 進入市場和地方獲利。 策略的详细说明 指示灯使用说明 顾问-贸易猫头鹰助手助理 私人用户聊天 ->购买后写信给我,我会将您添加到私人聊天中,您可以在那里下载所有奖金 力量在於簡單! Owl Smart Levels   交易系統非常易於使用,因此適合專業人士和剛開始研究市場並為自己選擇交易策略的人。 策略和指標中沒有隱藏的秘密公式和計算方法,所有策略指標都是公開的。 Owl Smart Levels 允許您快速查看進入交易的信號,突出顯示下訂單的水平並向您發送有關已出現信號的通知。 優點很明顯: 清楚地顯示主要和更高時間框架的趨勢方向。 指示儀器信號的出現。 標記開單、止損設置和固定利潤的水平。 沒有多餘的,只有必要的結構! ZigZag   表示全球趨勢的方向,因此也表示貿易方向。 市場反轉點的短線清楚地表明在什
PinBar Hunter
Dmitrijs Ivanajevs
PinBar Hunter — Your reliable assistant for trading the Pin Bar pattern! High Accuracy Signals This indicator automatically identifies bullish and bearish pin bars, instantly displaying clear arrows on the chart for convenient entry into trades. Flexible Signal Filters Utilize built-in time and Moving Average (MA) filters to receive only the highest quality and most reliable trading signals. Convenient Information Panel All indicator settings and current statuses are always at han
Crypto_Forex 指标“3 Black Crows 模式”适用于 MT4。 - 指标“3 Black Crows 模式”对于价格行为交易非常强大:无需重绘,无延迟。 - 指标检测图表上的看跌“3 Black Crows”模式:图表上的红色箭头信号(见图片)。 - 带有 PC、手机和电子邮件警报。 - 它的兄弟 - 看涨“3 White Soldiers 模式”指标也可用(请点击以下链接)。 - 指标“3 Black Crows 模式”非常适合与支撑/阻力位结合使用。 .................................................................................................................... // 更多出色的专家顾问和指标可在此处获得: https://www.mql5.com/en/users/def1380/seller 它是仅在此 MQL5 网站上提供的原创产品。
VR Cub
Vladimir Pastushak
VR Cub 这是获得高质量切入点的指标。该指标的开发是为了促进数学计算并简化对仓位入场点的搜索。多年来,该指标所针对的交易策略已被证明其有效性。交易策略的简单性是其巨大的优势,即使是新手交易者也能成功进行交易。 VR Cub 计算开仓点以及获利和止损目标水平,这显着提高了效率和易用性。查看使用以下策略进行交易的屏幕截图,了解简单的交易规则。 设置、设置文件、演示版本、说明、问题解决,可以从以下位置获取 [博客] 您可以在以下位置阅读或撰写评论 [关联] 版本为 [MetaTrader 5] 计算入场点的规则 开仓 要计算入场点,您需要将 VR Cub 工具从最后一个高点拉伸到最后一个低点。 如果第一个点在时间上早于第二个点,交易者等待柱线收于中线上方。 如果第一个点在时间上晚于第二个点,交易者等待柱线收于中线下方。 根据上述条件,严格在 柱线收盘 后建仓。 换句话说,如果我们在小时图上进行交易,那么从最高点到最低点的时间距离必须超过24小时,最高点和最低点之间的点数必须大于或等于平均价格变动每天。 维持和改变市场地位 可以有多个未平仓头寸;每个头寸都可以单独修改。 VR Cub
这是一个预测蜡烛收盘价的指标。 该指标主要用于 D1 图表。 该指标适用于传统外汇交易和二元期权交易。 该指标可以用作独立的交易系统,也可以作为您现有交易系统的补充。 该指标分析当前蜡烛,计算蜡烛本身内部的某些强度因素,以及前一根蜡烛的参数。 因此,该指标预测市场走势的进一步方向和当前蜡烛的收盘价。 由于这种方法,该指标既适用于短期盘中交易,也适用于中长期交易。 该指标允许您设置指标在分析市场情况期间将产生的潜在信号的数量。 在指标设置中有一个特殊的参数。 此外,该指标可以通过图表上的消息、电子邮件以及推送通知的形式通知新信号。感谢您的关注!交易愉快! 购买后一定要写信给我! 我会给你我的交易指标的建议! 还可以获得奖金!
Signal From Level
Yaroslav Varankin
Binary Options Support Resistance Indicator This indicator is designed for binary options trading and effectively shows retracements from support and resistance levels. Signals appear on the current candle. A red arrow pointing downwards indicates a potential selling opportunity, while a blue arrow pointing upwards suggests buying opportunities. All that needs adjustment is the color of the signal arrows. It is recommended to use it on the M1-M5 timeframes as signals are frequent on these timef
Alpha Trend sign Alpha Trend sign 是我么长期以来非常受欢迎的交易工具,它可以验证我们的交易系统,并且明确的提示交易信号,并且信号不会漂移。 主要功能: •  根据市场显示活跃区域,根据指标可以很直观的判断当前行情是属于趋势行情,还是震荡行情。    并根据指标的指示箭头切入市场,绿色箭头提示买入,红色箭头提示卖出。 •  建议使用5分钟以上的时间周期进行交易,避免因为小周期波动出现频繁的交易信号。 •  您也可以开启信号提示,以免错过最佳的交易时机。 •  本指标不但可以很好的预测趋势行情,也可以在宽幅震荡行情中获利。 •  本指标本着大道至简的原则,适合不同阶段的交易者使用。 注意事项: •  Alpha Trend sign 有明确的进出场信号,不建议逆势操作,以免造成损失。 •  Alpha Trend sign 是特别成熟的指标,我们团队人手一个,使用它可以实现稳定盈利。     
Trend Oscillator mw
DMITRII GRIDASOV
趋势振荡器 - 是一种高级自定义 Crypto_Forex 指标,高效的交易工具! - 使用高级新计算方法 - 参数“计算价格”有 20 个选项。 - 有史以来最平滑的振荡器。 - 绿色表示上升趋势,红色表示下降趋势。 - 超卖值:低于 5,超买值:超过 95。 - 使用此指标,有很多机会升级标准策略。 - 具有 PC 和移动警报。 .................................................................................................................... // 出色的交易机器人和指标可在此处获取: https://www.mql5.com/en/users/def1380/seller 这是仅在此 MQL5 网站上提供的原创产品。
Crypto_Forex 指标“晨星模式”适用于 MT4。 - 指标“晨星模式”是价格行为交易的非常强大的指标:无需重绘,无延迟。 - 指标检测图表上的看涨晨星模式:图表上的蓝色箭头信号(见图片)。 - 带有 PC、手机和电子邮件警报。 - 还有它的兄弟 - 看跌“黄昏之星模式”指标可用(点击以下链接)。 - 指标“晨星模式”非常适合与支撑/阻力位结合使用。 ................................................................................................................. // 出色的交易机器人和指标可在此处获得: https://www.mql5.com/en/users/def1380/seller 这是仅在此 MQL5 网站上提供的原创产品。
ZhiBiCCI MT4
Qiuyang Zheng
【ZhiBiCCI】指标适合所有的周期使用,也适合所有的市场品种。 【ZhiBiCCI】绿色实线是逆转看涨背离。绿色虚线是经典的看涨背离。 【ZhiBiCCI】向红色实线是反向看跌背离。红色虚线是古典看跌背离。 【ZhiBiCCI】可以在参数里面设置(Alert、Send mail、Send notification),设置为(true)就可以发送即时信号到警报窗口、电子邮件、即时消息。 参数设置说明: 【displayAlert】:这是警报开关,设置成true,如果出现箭头就会自动警报提示;设置成false,则不会警报提示。 【sendmail_NO_OFF】:这是发送邮件的开关,设置成true,如果出现箭头就会发送邮件到你在MT4设置好的邮箱里面;设置成false,则不会发邮件。 【sendnotification_NO_OFF】:这是发送即时消息的开关,设置成true,如果出现箭头就会发送消息到你的移动设备;设置成false,则不会发消息。 更多好用的指标网址: https://www.mql5.com/en/users/zhengqiuyang/seller
The indicator displays the data of the Stochastic oscillator from a higher timeframe on the chart. The main and signal lines are displayed in a separate window. The stepped response is not smoothed. The indicator is useful for practicing "manual" forex trading strategies, which use the data from several screens with different timeframes of a single symbol. The indicator uses the settings that are identical to the standard ones, and a drop-down list for selecting the timeframe. Indicator Paramet
Chart Patterns Detect 15 patterns (Ascending Triangle, Descending Triangle, Rising Wedge, Falling Wedge, Bullish Flag, Bearish Flag, Bullish Rectangle, Bearish Rectangle Symmetrical triangle, Head and Shoulders, Inverted Head and Shoulders, Triple top, Triple Bottom, Double Top, Double Bottom) Use historical data to calculate the probability of each pattern to succeed (possibility to filter notification according to the chance of success) gives graphic indication about the invalidation level and
Gold Phoenix
Yaroslav Varankin
The perfect tool for Scalng in the Forex markets You can trade both from signal to signal and using take profit  The algorithm does not use Zigzag!  No redrawing!  This is a channel instrument that uses a moving average as a filter. Moving Average  There are 2 parameters for the settings Ma Period = 5 period Moving Average  Channel 1.0 distance of channel lines from the chart Price Signal Filter - calculation of signal opening and filter There is a complete set of Alert There is a multi-timefram
斐波那契折返和扩展画线工具 适用于MT4平台的斐波那契折返和扩展画线工具,适合于使用黄金分割交易的交易者 优点:没有多余的线,没有过长的线,易于观察发现交易的机会 试用版: https://www.mql5.com/zh/market/product/35884 主要功能: 1.可以直接画出多组斐波那契折返,可以看出重要折返点之间的关系; 2.可以画出斐波那契扩展,比率有三种0.618,1,1.618 3.画出的斐波那契折返和扩展均可左右移动,有数值显示,方便观察 4.可通过数字键切换周期 使用指南和功能键: 1.按 [ 或R画折返,按需要画折返,最多云持8组折返; 2.按 ] 或E画扩展; 3.按 \ 删除当前周期下的所有扩展和折返,其余周期的不受影响 4.如何左右移动折返和扩展 (1)点击第一组折返的F5字符,可以左右移动折返; (2)点击COP的字符 ,可以左右移动扩展; 5. (1)点击第一组折返的F5字符,按del 可以删除这组折返; (2)点击COP的字符, 按del 可以删除这组扩展; 6.修改折返和扩展(随着市场的运行,焦点或者反弹点需要修改)
Crypto_Forex 指标“带动态超卖/超买区域的强力指数”适用于 MT4,无需重绘。 - 强力指数是将价格和成交量数据合并为一个值的顶级指标之一。 - 从动态超买区域进行卖出交易,从动态超卖区域进行买入交易,效果非常好。 - 该指标非常适合将动量交易纳入趋势方向。 - 动态超买区域 - 高于黄线。 - 动态超卖区域 - 低于蓝线。 - 强力指数本身是强大的振荡器 - 可测量用于移动价格的能量。 - 带有 PC 和移动警报。 ................................................................................................................. // 出色的交易机器人和指标可在此处获得: https://www.mql5.com/en/users/def1380/seller 它是仅在此 MQL5 网站上提供的原创产品。
Trend Bilio
Ivan Simonika
Trend Bilio - an arrow indicator without redrawing shows potential market entry points in the form of arrows of the corresponding color: upward red arrows suggest opening a buy, green down arrows - selling. The entrance is supposed to be at the next bar after the pointer. The arrow indicator Trend Bilio visually "unloads" the price chart and saves time for analysis: no signal - no deal, if an opposite signal appears, then the current deal should be closed. It is Trend Bilio that is considered
Wave Trend MT4
Diego Arribas Lopez
MT5 Version   Wave Trend MT4 Wave Trend is an oscillator, which helps identifing in a extremely accurate manner market reversals. The Oscillator being obove the overbought level and a cross down of the fast into the slow MA usually indicates a good SELL signal. If the oscillators is below the oversold level and the fast MA crosses over the slower MA usually highlights a good BUY signal. The Wave Trend indicator can be also used when divergences appear against the price, indicating the current mo
Atomic Analyst
Issam Kassas
5 (2)
首先值得强调的是,该交易指标是非重绘、非延迟的指标,这使其成为手动和机器人交易的理想选择。 用户手册:设置、输入和策略。 Atomic Analyst是一种PA价格行动指标,利用价格的力量和动量来寻找市场上更好的机会。配备了高级过滤器,可帮助去除噪音和假信号,并提高交易潜力。使用多层复杂的指标,Atomic Analyst扫描图表,并将复杂的数学计算转化为任何初学者都能理解并用来做出一致交易决策的简单信号和颜色。 “Atomic Analyst”是专为新手和经验丰富的交易者量身定制的综合交易解决方案。它将高级指标和一流功能融合为一体的交易策略,使其成为所有类型交易者的多功能选择。 日内交易和剥头皮策略:专为快速准确的日内交易和短期交易而设计。 日内和摆动交易策略:可用作追求价格大幅波动的日内和摆动交易者的可靠工具。 多货币和市场:凭借其可靠的精度,在不同的工具和市场上运作。 多个时间框架:可在多个时间框架上使用,性能良好。 稳定性:所有指标均不重绘、不重绘和不滞后,确保可靠的信号。 信号清晰度:提供箭头信号,用于清晰的入场和出场点。 实时警报:通过交易入场、SL和TP警报通知交易者
The Th3Eng PipFinite indicator is based on a very excellent analysis of the right trend direction with perfect custom algorithms. It show the true direction and the best point to start trading. With StopLoss point and Three Take Profit points. Also it show the right pivot of the price and small points to order to replace the dynamic support and resistance channel, Which surrounds the price. And Finally it draws a very helpful Box on the left side on the chart includes (take profits and Stop loss
Trendiness Index
Libertas LLC
5 (3)
"The trend is your friend" is one of the best known sayings in investing, because capturing large trendy price movements can be extremely profitable. However, trading with the trend is often easier said than done, because many indicators are based on price reversals not trends. These aren't very effective at identifying trendy periods, or predicting whether trends will continue. We developed the Trendiness Index to help address this problem by indicating the strength and direction of price trend
Insider Scalper Binary This tool is designed to trade binary options. for short temporary spends. to make a deal is worth the moment of receiving the signal and only 1 candle if it is m1 then only for a minute and so in accordance with the timeframe. for better results, you need to select well-volatile charts.... recommended currency pairs eur | usd, usd | jpy .... the indicator is already configured, you just have to add it to the chart and trade .... The indicator signals the next candle.
Noize Absorption Index MT4
Ekaterina Saltykova
5 (1)
Noize Absorption Index - is the manual trading system that measures the difference of pressure between bears forces and bulls forces. Green line - is a noize free index that showing curent situation. Zero value of index shows totally choppy/flat market.Values above zero level shows how powerfull bullish wave is and values below zero measures bearish forces.Up arrow appears on bearish market when it's ready to reverse, dn arrow appears on weak bullish market, as a result of reverse expectation. S
Gvs Undefeated Trend   indicator is designed for trend and signal trading. This indicator generates trend signals.  It uses many algorithms and indicators to generate this signal. It tries to generate a signal from the points with the highest trend potential. This indicator is a complete trading product. This indicator does not need any additional indicators.  You can only trade with this indicator. The generated signals are displayed on the graphical screen.  Thanks to the alert features you ca
Trend Line Chart Pattern Signals  Is a traders Tool for Signals based on Strong  Patterns Formed By a pair of robust trend lines. They FOR WITH DIFFERENT POPULAR PATTERNS ON CHARTS LIKE – TRIANGLES, FLAGS,RANGE , ASCENDING TRIANGLES, DESCENDING PATTERNS, PENNANTS ETC. The TREND LINES  form  dynamically  on running bars. The  sensitivity  of the trend lines can be changed by custom settings. The  Buy and Sell Signals Generate upon Break Of the Trend Line + "Close" of the same bar above the previo
Power Renko MT4
Pierce Vallieres
Power Renko is an indicator which plots Renko bricks underneath the chart using a histogram. You can select the brick size and the timeframe of the Renko bricks as well as whether or not to use the close price or the high/low price of the candles. Renko bricks are based on price alone, not time, therefor the Renko bricks will not be aligned with the chart's time. They are extremely useful for trend trading and many different strategies can be formed from them. Buffers are provided allowing you t
Trend Ray
Andriy Sydoruk
The indicator shows the potential trend direction by cyclical-wave dependence. Thus, all the rays of the intersection will be optimal rays, in the direction of which the price is expected to move, taking into account the indicator period. Rays can be used as a direction for potential market movement. But we must not forget that the approach must be comprehensive, the indicator signals require additional information to enter the market.
Alpha Trend
Evgeny Belyaev
3.33 (3)
Alpha Trend is a trend indicator for the MetaTrader 4 platform; it has been developed by a group of professional traders. The Alpha Trend indicator finds the most probable tendency reversal points, which allows making trades at the very beginning of a trend. This indicator features notifications, which are generated whenever a new signal appears (alert, email, push-notification). This allows you to open a position in a timely manner. Alpha Trend does not redraw, which makes it possible to evalua
该产品的买家也购买
Enigmera
Ivan Stefanov
5 (7)
ENIGMERA: 市场的核心 重要提示:MQL5.com 演示版本在策略测试器中运行,可能无法完全反映 Enigmera 的功能。请查看描述、截图和视频了解详细信息。如有任何问题,请随时联系我! 该指标的代码已完全重写。版本 3.0 增加了新功能并修复了自指标发布以来积累的错误。 简介 这个指标和交易系统是金融市场的一种独特方法。ENIGMERA 使用分形周期来精确计算支撑和阻力水平。它展示了真实的积累阶段,并提供了方向和目标。无论是在趋势中还是在修正中,这个系统都能工作。 它是如何工作的 指标的大部分功能通过图表左侧的按钮控制,使得能够快速响应不同的市场情况。 按钮 ON/OFF – 显示或隐藏整个指标。 Channel – 激活支撑通道,显示可接受的偏差范围。 Dev1 (第一偏差) – 指示价格在支撑偏差内的波动,信号表示市场正在整合或积累力量。 Dev2 (第二偏差) – 显示价格在偏差之间的波动,表示趋势形成和方向。 Dev3 (第三偏差) – 表示趋势的显著加速和高波动性。 45deg (45度) – 显示市场的节奏和相对于 45 度线的运动稳定性。 Tgt1/2
Scalper Inside PRO
Alexey Minkov
4.76 (63)
!SPECIAL SALE! An exclusive indicator that utilizes an innovative algorithm to swiftly and accurately determine the market trend. The indicator automatically calculates opening, closing, and profit levels, providing detailed trading statistics. With these features, you can choose the most appropriate trading instrument for the current market conditions. Additionally, you can easily integrate your own arrow indicators into Scalper Inside Pro to quickly evaluate their statistics and profitability
向您介绍一款优秀的技术指标——Grabber,它是一套即开即用的“全包式”交易策略。 在一个代码中集成了强大的市场技术分析工具、交易信号(箭头)、提醒功能和推送通知。 每位购买该指标的用户还可免费获得以下内容: Grabber辅助工具:用于自动管理已开仓位 视频操作指南:逐步教学如何安装、设置和使用该指标进行交易 原创Set文件:可快速自动配置,帮助实现最佳交易效果 忘掉其他策略吧!只有Grabber能够真正激励你在交易中攀登新高峰! Grabber策略的主要特点: 交易周期:从M5到H4 适用资产:任意,但我推荐我亲自测试过的品种(GBPUSD、GBPCAD、GBPCHF、AUDCAD、AUDUSD、AUDSGD、AUDCHF、NZDUSD、NZDCAD、EURCAD、EURUSD、EURAUD、EURGBP、EURCHF、USDCAD、USDSGD) 交易时间:全天候 24/7 交易效果:我分享自己的真实交易结果,并在此教学如何操作: https://www.mql5.com/ru/market/product/134563?source=Site+Market+MT5+Indic
Dynamic Forex28 Navigator
Bernhard Schweigert
5 (5)
Dynamic Forex28 Navigator - 下一代外汇交易工具。 当前 49% 折扣。 Dynamic Forex28 Navigator 是我们长期流行的指标的演变,将三种功能合二为一: 高级货币强度 28 指标 (695 条评论)+ 高级货币 IMPULSE 带警报 (520 条评论)+ CS28 组合信号(奖励)。 有关指标的详细信息 https://www.mql5.com/en/blogs/post/758844 下一代强度指标提供什么? 您喜欢的原始指标的一切,现在通过新功能和更高的精度进行了增强。 主要特点: 专有货币强度公式。  所有时间范围内的平滑和准确的强度线。 非常适合识别趋势和精确进入。 动态市场斐波那契水平(市场斐波那契)。  此指标独有的独特功能。 斐波那契应用于货币强度,而不是价格图表。 适应实时市场活动以获得准确的反转区域。 实时市场动量。  第 9 行显示市场是活跃还是被动。 对于定时交易至关重要。 全面的警报和显示。  每种货币最强的买入和卖出动量。 ​​28 对的双重动量买入和卖出。 超买/超卖警告外部范围和止损。 反转
FX Volume
Daniel Stein
4.59 (34)
FX Volume:从经纪商视角洞察真实市场情绪 简要概述 想要提升您的交易策略? FX Volume 可提供零售交易者和经纪商的持仓实时数据——远早于诸如 COT 之类的延迟报告。不论您希望获得持续稳定的收益,还是想在市场中多一分制胜的砝码, FX Volume 都能帮您识别重大失衡、确认突破以及完善风险管理。立即开启体验,让真实的成交量数据为您的交易决策带来革新! 1. 为什么 FX Volume 对交易者格外有用 极具准确度的早期预警 • 快速捕捉有多少交易者正在买入或卖出某个货币对——比大多数人提前一步。 • FX Volume 是 唯一 能够整合多家零售经纪商真实成交量数据并以简洁方式呈现的工具。 强力风险管理 • 及时识别多头或空头仓位的巨大不平衡,这往往预示着潜在的趋势反转,帮助您更自信地设置止损和目标位。 • 独家而真实的数据让每一次交易决策更具可靠性。 优化进场与出场点 • 发现“过度集中”的交易(大多数交易者都在同一方向),并通过真实成交量来确认突破。 • 避免依赖常见指标可能带来的误导信号,而是利用真实的实时成交量。 适配各种交易策略 • 将 FX
Golden Trend Indicator
Noha Mohamed Fathy Younes Badr
4.9 (10)
Golden Trend indicator  is The best indicator for predicting trend movement this indicator never lags and never repaints and never back paints    and give  arrow buy and sell    before the candle appear  and it will help you and  will make your trading decisions clearer its work on all currencies and  gold and crypto and all time frame This unique  indicator uses very secret algorithms to catch the  trends, so you can trade using this indicator and see the trend clear on charts  manual guide and
- Lifetime update free Contact me for instruction, add group and any questions! Related Products:  Bitcoin Expert , Gold Expert - Non-repaint - I just sell my products in Elif Kaya profile, any other websites are stolen old versions, So no any new updates or support. Introduction The breakout and retest strategy is traded support and resistance levels. it involves price breaking through a previous level.  The break and retest strategy is designed to help traders do two main things, the first is
Algo Pumping MT4
Ihor Otkydach
5 (2)
PUMPING STATION – 您的专属“全包式”交易策略 我们为您推出PUMPING STATION —— 一款革命性的外汇指标,它将使您的交易变得更加有趣且高效。这不仅仅是一个辅助工具,而是一套完整的交易系统,具备强大的算法,帮助您开始更加稳定的交易。 购买本产品,您将免费获得: 专属设置文件:用于自动配置,实现最大化性能。 逐步视频教程:学习如何使用PUMPING STATION策略进行交易。 Pumping Utility:专为PUMPING STATION打造的半自动交易机器人,让交易变得更加方便和简单。 购买后请立即联系我,我将为您提供所有额外资源的访问权限。 PUMPING STATION如何工作: 趋势监控:能够即时识别市场趋势方向。趋势是您最好的朋友。 进场信号:图表上的箭头会提示您何时进场以及交易方向。 明确的交易目标:指标会自动识别最佳的平仓时机。 回调交易:内置的基于布林带的价格通道可检测修正结束并发出新趋势开始的信号。 效率分析:如果当前设置效果较差,系统会自动提示。只需调整PUMPING STATION,即可获得最佳性能。 功能强大: 推送和邮件通知:即
Easy Breakout
Mohamed Hassan
5 (10)
After your purchase, feel free to contact me for more details on how to receive a bonus indicator called VFI, which pairs perfectly with Easy Breakout for enhanced confluence!   Easy Breakout is a powerful price action trading system built on one of the most popular and widely trusted strategies among traders: the Breakout strategy ! This indicator delivers crystal-clear Buy and Sell signals based on breakouts from key support and resistance zones. Unlike typical breakout indicators, it levera
TPSproTREND PrO
Roman Podpora
4.68 (25)
VERSION MT5        —        ИНСТРУКЦИЯ RUS           —        INSTRUCTIONS  ENG 主要功能: 准确的输入信号,无需渲染! 如果出现信号,它仍然相关!这是与重提指标的一个重要区别,重提指标可以提供信号然后改变信号,这可能导致存款资金的损失。现在您可以以更高的概率和准确度进入市场。还有一个功能是在箭头出现后为蜡烛着色,直到达到目标(止盈)或出现反转信号。 显示止损/获利区域 为了提高搜索切入点时的视觉清晰度,创建了一个模块,该模块最初显示买入/卖出区域,在该区域中搜索进入市场的最佳点。用于处理止损水平的附加智能逻辑有助于随着时间的推移减小其大小,从而降低进入交易(移动 sl)时的初始风险。 显示较高时间范围内的最小值/最大值(MTF 模式) 添加了一项功能,可以显示较高时间间隔的最小/最大校正位置,并显示趋势变化。此外,MIN/MAX 现在有编号,显示修正内容。 风险回报率 (RR) 使用指标算法,可以检测精确的入场点,平均风险回报比超过1k2。这也伴随着视觉效果,例如,收到信号后会出现蜡烛的彩色草图。 无论价
Gold Venamax MT4
Sergei Linskii
5 (1)
Gold Venamax   - 這是最好的股票技術指標。 此指標演算法分析資產的價格變動並反映波動性和潛在的進入區域。 指標特點: 這是一個帶有 Magic 和兩個趨勢箭頭塊的超級指標,可實現舒適且有利可圖的交易。 圖表上顯示用於切換方塊的紅色按鈕。 Magic 在指標設定中進行設置,以便您可以將指標安裝在顯示不同區塊的兩個圖表上。 Gold Venamax 可以放置在具有不同箭頭緩衝區(GV 和 SD)的兩個圖表上。 為此,您需要在設定中選擇不同的 Magic,例如,一個具有 Magic = 999,另一個具有 Magic = 666。接下來,您可以使用圖表上的紅色按鈕選擇箭頭緩衝區。 進入的最佳訊號 = 遵循兩個緩衝區的訊號箭頭(GV 和 SD)+ 所有三個 MA 線(紅色或藍色)的方向 + TMA 通道邊界(下或上) 。 TMA 通道邊界(下限或上限)也可用於鎖定利潤和/或以較短的停損位進行逆勢風險交易。 此指標的優點: 1. 此指示器產生高精度訊號。 2. 確認 SD 緩衝區的箭頭訊號為非重繪。只有當趨勢強勁時,GV 緩衝區的確認箭頭訊號才能重建。 3. 您可以在
Volatility Trend System - a trading system that gives signals for entries. The volatility system gives linear and point signals in the direction of the trend, as well as signals to exit it, without redrawing and delays. The trend indicator monitors the direction of the medium-term trend, shows the direction and its change. The signal indicator is based on changes in volatility and shows market entries. The indicator is equipped with several types of alerts. Can be applied to various trading ins
目前八折优惠! 对任何新手或专家交易者来说都是最好的解决方案! 这个仪表板软件适用于28种货币对。它基于我们的两个主要指标(高级货币强度28和高级货币冲动)。它对整个外汇市场提供了一个伟大的概述。它显示高级货币强度值,货币运动速度和28个外汇对在所有(9)时间段的信号。想象一下,当你可以使用图表上的单一指标观察整个市场,以确定趋势和或剥头皮的机会时,你的交易将得到改善 我们已经在这个指标中建立了一些功能,使你更容易识别强势和弱势货币,同时识别和确认潜在的交易。该指标以图形方式显示货币的强势或弱势是增加还是减少,以及它在所有时间段的表现。 增加的新功能是动态市场斐波那契水平,它适应当前的市场条件变化,这是一个已经在我们的高级货币强度28和高级货币冲动指标中使用的成熟的加分项。 在交易时,总是将弱势货币和强势货币配对,这个新指标将帮助你做到这一点。 用户手册:点击这里  https://www.mql5.com/en/blogs/post/708783 特点  显示每个时间段的ACS28和GAP-speed(冲动)的货币强度值。 列:颜色代码以7种颜色显示货币强度:强势
Lux Trend
Mohamed Hassan
5 (3)
After purchase, please contact me to get your trading tips + more information for a great bonus!   Lux Trend is a professional strategy based on using Higher Highs and Lower Highs to identify and draw Trendline Breakouts! Lux Trend  utilizes two Moving Averages to confirm the overall trend direction before scanning the market for high-quality breakout opportunities, ensuring more accurate and reliable trade signals. This is a proven trading system used by real traders worldwide, demonstrating
TPSpro RFI Levels
Roman Podpora
4.85 (27)
指示       俄罗斯 -        英语   建议 与指示器一起使用     -       TPSpro 趋势专业版 -   Version MT5 主要功能: 向卖家和买家显示活跃区域! 该指标显示所有正确的初始买入和卖出脉冲水平/区域。激活这些水平/区域后,开始寻找切入点,水平会改变颜色并填充特定阴影。此外,还会显示箭头,以便更直观地了解情况。 显示更高时间范围内的级别/区域(MTF 模式) 添加了使用更高时间间隔显示级别/区域的功能。此外,该指标还具有自动趋势检测功能(   TPSproTREND PRO   )。 用于交易的单独专业的逐步算法。 该算法专为日内交易而设计,既可顺势交易,也可逆势交易。每个活动模板均提供详细说明。 适用于多种时间范围 。 TPSpro RFI 水平指标可用于图表上的任何时间范围,从一分钟(M1)开始一直到每月(MN)。 图形和声音警报。 该指标提供图形和声音指示,确保您不会错过交易入场信号。还提供手机通知。 简单有效的主动模式扫描仪。 这是一个非常紧凑的活动模式扫描仪,当模式在一个方向上在所有时间范围内激活时,它会自动警报并向您的手机发送
Introduction to X3 Chart Pattern Scanner X3 Cherart Pattern Scanner is the non-repainting and non-lagging indicator detecting X3 chart patterns including Harmonic pattern, Elliott Wave pattern, X3 patterns, and Japanese Candlestick patterns. Historical patterns match with signal patterns. Hence, you can readily develop the solid trading strategy in your chart. More importantly, this superb pattern scanner can detect the optimal pattern of its kind. In addition, you can switch on and off individu
Gold Trend 4
Sergei Linskii
黄金趋势   - 这是一个很好的股票技术指标。该指标算法分析资产的价格走势,并反映波动性和潜在进入区。 最佳指标信号: - 卖出 = 红色柱状图 + 红色短指针 + 同方向黄色信号箭头。 - 买入 = 蓝色柱状图 + 蓝色多头指针 + 同方向水蓝色信号箭头。 该指标的优点 1. 该指标生成的信号准确度高。 2. 只有当趋势发生变化时,才能重新绘制已确认的箭头信号。 3. 您可以在任何经纪商的 MetaTrader 4 交易平台上进行交易。 4. 您可以交易任何资产(货币、金属、加密货币、股票、指数等)。 5. 最好在 H1 时间框架(中期交易)上进行交易。 6. 在指标设置中可更改个别参数(TF、颜色等),以便每位交易者都能轻松定制适合自己的指标。 7. 该指标既可作为交易系统的主要补充,也可作为独立的交易系统使用。   注意:交易的入場準確性和盈利能力僅取決於交易者的技能。 任何指標都只是交易者的助手,而不是行動指南。黃金法則 - 根據趨勢開單,獲利並等待下一個最佳訊號。 MetaTrader 5 黄金趋势指标版本  祝大家交易好运,稳定盈利!
Advanced Currency IMPULSE with ALERT
Bernhard Schweigert
4.9 (484)
目前31%的折扣!! 对任何新手或专家交易者来说都是最好的解决方案! 这个指标是一个独特的、高质量的、负担得起的交易工具,因为我们已经纳入了一些专有的功能和一个秘密的公式。只需一张图表,它就能给出所有28种货币对的警报。想象一下,你的交易将如何改善,因为你能够准确地确定新趋势或剥头皮机会的触发点 建立在新的基础算法上,它使识别和确认潜在交易变得更加容易。这是因为它以图形方式显示了一种货币的强势或弱势是否正在加速,并测量了这种加速的速度--把它想象成你汽车中的速度表。当你加速时,事情显然会发生得更快,这在外汇市场上也是一样的,即如果你配对的货币正在向相反的方向加速,你就会发现一个潜在的有利可图的交易。 货币动量的垂直线和箭头将指导你的交易! 动态的市场斐波那契23水平被用作警报触发器,将适应市场活动。如果冲动触及黄色触发线,您将在MetaTrader或您的电子邮件或推送警报中收到警报。然后你就知道作为一个交易员应该做什么。货币对和方向已经给出。只要点击警报按钮,就可以切换到该货币对或打开一个新的图表,以便进一步分析。警报级别可以通过用户输入来改变,可以选择3个敏感度级别。 尽
Linear Trend Predictor — 结合切入点和方向支撑线的趋势指标。按照突破高/低价通道的原理运作。该指标算法过滤市场噪音,考虑波动性和市场动态。 指示器功能  使用平滑方法,显示市场趋势和开立买入或卖出订单的切入点。  适合通过分析任何时间范围内的图表来确定短期和长期的市场走势。  输入参数可适应任何市场和时间范围,允许交易者独立定制指标。  设定的指示信号不会消失,也不会重新绘制——它是在蜡烛收盘时确定的。也可以在当前蜡烛上使用它,更早地接收信号,但信号可能会改变。  几种类型的通知以箭头组合。  该指标既可以作为独立的交易系统使用,也可以作为其他交易系统的补充。  可供任何经验水平的交易者使用。 主要参数 Volatility Smoothing Level - 指标的主要参数,允许您配置指标以实现舒适的操作。 它的数字范围是 1 到 100,从而增加了您可以获得更长趋势运动的平滑度。 通过少量的数字,您可以获得短期走势并快速退出交易。 使用指标进行交易的时刻:  红线和箭头表示下降趋势和卖出开盘信号。止损应根据前一个上分形来设置。  黄线和箭头
Best Currency Strength Indicator
Tumelo Patrick Rakotsoane
4.5 (46)
Advanced Currency Strength Indicator The Advanced Divergence Currency Strength Indicator. Not only it breaks down all 28 forex currency pairs and calculates the strength of individual currencies across all timeframes , but, You'll be analyzing the WHOLE forex market in 1 window (In just 1 minute) . This indicator is very powerful because it reveals the true movements of the market.  It is highly recommended to  analyze charts knowing the performance of individual currencies or the countries eco
基於江恩理論手動建構修正區域的指標。這些區域是透過數學計算確定的,使用從 M1 開始到 D1 結束的不同時間範圍的特殊係數。此指標適用於貨幣對和金屬,以及加密貨幣甚至股票 利用該指標,您可以根據市場週期輕鬆建立購買/銷售支援區域,並在接近這些區域時做出交易決策。 這將使您了解從買入/賣出支撐區域的價格變動方向。 另外,借助該指標,您可以確定上升/下降週期的中斷並確定切入點。 適合剝頭皮交易、短期交易和中期交易。這完全取決於您的交易風格。 非常容易使用。僅使用四個鍵即可建造區域。 區域是根據圖表上突出的高點/低點手動建立的 若要建立購買支撐區域,您需要將滑鼠遊標放在明確定義的高點上,然後按「2」鍵。 在圖表上安裝兩個指標副本,使用當前時間範圍的設定和下面時間範圍的設定來比較價格走勢,因為 m1 上可能有一個上升週期,而 m5 上可能有一個下降週期,反之亦然 若要建立銷售支撐區域,您需要將滑鼠遊標放在明確定義的低點上,然後按「1」鍵。 為了確定潛在的目標區域,使用鍵“3” - 從低到高表示目標購買區域,使用鍵“4” - 從高到高表示目標銷售區域。 您所需要的只是一個乾
With this system you can spot high-probability trades in direction of strong trends. You can profit from stop hunt moves initiated by the smart money! Important Information How you can maximize the potential of the scanner, please read here: www.mql5.com/en/blogs/post/718109 Please read also the blog about the usage of the indicator: Professional Trading With Strong Momentum. With this system you have 3 reliable edges on your side: A strong trend (=high probability of continuation) A deep pull
波浪同步器是波浪分析的可视化指标。结合蜡烛图运动序列并构建定向波浪,与市场一起产生同步运动。 每个波浪的开始都以信号箭头开始,还有警报。 该指标永远不会重绘或移动先前历史记录上的箭头。 信号箭头出现在蜡烛图的收盘价。 适用于任何交易工具和时间框架。 易于使用和配置,仅包含 2 个输入参数:选择与所选参数一起使用的时间框架和计算 MA 线的方法。 推荐的参数可以移动 1-2 个周期。 红色箭头方向用于购买交易资产。 蓝色箭头方向用于出售交易资产。 ----------------------------------------------------------------------------------------------
Cycle Sniper
Elmira Memish
4.39 (36)
NEW YEAR SALE PRICE FOR LIMITED TIME!!! Please contact us after your purchase and we will send you the complimentary indicators to complete the system Cycle Sniper is not a holy grail but when you use it in a system which is explained in the videos, you will feel the difference. If you are not willing to focus on the charts designed with Cycle Sniper and other free tools we provide, we recommend not buying this indicator. We recommend watching the videos about the indiactor and system before pu
Advanced Currency Strength28 Indicator
Bernhard Schweigert
4.9 (652)
目前26%的折扣 任何新手或专家交易者的最佳解决方案! 这个指标是一个独特的、高质量的、可负担得起的交易工具,因为我们纳入了一些专有的功能和一个新的公式。只需一个图表,你就可以读出28个外汇对的货币强度!想象一下,你的交易将如何得到改善,因为你的交易是在你的手中进行的。想象一下,你的交易将如何改善,因为你能够准确地确定新趋势或剥头皮机会的触发点? 用户手册:点击这里  https://www.mql5.com/en/blogs/post/697384 这是第一本,原版的! 不要买一个毫无价值的崇拜者的克隆品。 特别的 子窗口中的箭头显示强劲的货币势头GAP将指导你的交易! 当基础货币或报价货币处于超卖/超买区域(外盘斐波那契水平)时,在个人图表的主窗口中出现警告信号。 当货币力量从外围区间回落时,回撤/反转警报。 十字星模式的特别警报 可选择多个时间框架,以快速查看趋势! 货币强度线在所有的时间框架中都非常平稳,当使用较高的时间框架来识别总体趋势,然后使用较短的时间框架来确定精确的入口时,效果非常好。你可以根据自己的意愿选择任何时间框架。每个时间框架都由其自身进行了优化。
MTF Supply Demand Zones
Georgios Kalomoiropoulos
4.82 (22)
下一代自动化供需区。适用于任何图表的创新算法。所有区域都是根据市场的价格行为动态创建的。 两种类型的警报 --> 1) 当价格触及区域时 2) 当新区域形成时 你不会再得到一个无用的指标。您将获得一个完整的交易策略和经过验证的结果。     新的功能:     价格触及供需区时发出警报     创建新的供应/需求区时发出警报     推送通知警报     以点为单位的区域宽度标签     关于 MTF 的又一个时间表。因此,现在您将能够看到高于当前 3 个时间帧,而不是高于当前 2 个时间帧     启用/禁用警报/区域/MTF 功能的按钮 您获得的优势:     消除交易中的情绪。     客观化您的交易条目。     通过高概率设置提高您的利润。     节省绘图区域的时间。     像专业人士一样交易金融市场。     任何市场的即时多时间框架分析。 你在图表上看到了什么?     蓝色和红色矩形是当前时间范围的供需区。     虚线样式线是当前上方第一个时间范围内的供需区域。     实线样式线是当前上方第二个时间范围内的
Currency Strength Exotics
Bernhard Schweigert
4.87 (31)
目前8折优惠! 对任何新手或专家交易者来说都是最好的解决方案! 这个指标是专门用来显示任何符号的货币强度,如异国货币对、商品、指数或期货。它是同类产品中的第一个,任何符号都可以添加到第9行,以显示黄金、白银、石油、DAX、US30、MXN、TRY、CNH等的真实货币强度。这是一个独特的、高质量的、负担得起的交易工具,因为我们已经纳入了一些专有的功能和一个新的公式。想象一下,你的交易将如何改善,因为你能够准确地确定新趋势或剥头皮机会的触发点? 用户手册:点击这里   https://www.mql5.com/en/blogs/post/708876 它适用于所有时间框架。你将很快能够看到TREND! 根据新的基础算法设计,它使识别和确认潜在交易变得更加容易。这是因为它以图形方式显示了8种主要货币和一种符号的强弱。 该指标显示了8种主要货币(澳元加元瑞士法郎欧元英镑日元新西兰美元)的强弱线,再加上一个符号! 该指标显示了符号的真实价值。例如:对于XAUUSD(黄金):价格以美元报价。如果黄金在上涨,你怎么能知道是黄金的强势还是美元的弱势?只有当黄金走强时,我们才会进行交易。该指
成交量突破震荡指标是一种以震荡指标的形式将价格变动与成交量趋势相匹配的指标。 我想将成交量分析整合到我的策略中,但大多数成交量指标都令我失望, 例如 OBV、资金流量指数、A/D,还有成交量加权 Macd 和许多其他指标。 因此,我为自己编写了这个指标,我对它的实用性感到满意,因此我决定将其发布到市场上。 主要特点: 它突出显示了价格在成交量增加(突破)支持下朝某个方向移动的阶段。 它突出显示了成交量增加停止并因此市场收缩的阶段。 它突出显示了价格和成交量均未移动的阶段,尤其是在时间范围(<=15 分钟)的日内交易中,因此市场已为未来的运行做好准备。 当其他 EA 交易程序发出的虚假信号不受交易量增加的支持时,可过滤掉这些信号。 它使趋势和范围阶段可视化变得非常容易 输入参数: 计算设置: 计算类型:快速、正常、慢速,用于监控短期、中期和长期,保持在同一时间范围内。 计算周期:计算周期 交易量设置: 交易量类型:TickVolume(主要用于外汇)和RealVolume(用于股票市场) 信号设置: 信号周期:信号线周期 突破水平:突破信号的阈值水平 警报设置 警报类型:收盘
Gaussian Channel MT4
Diego Arribas Lopez
5 (1)
MT5 Version Gaussian Channel MT4 Gaussian Channel MT4 is the first indicator in the market that uses Ehlers Gaussian Filter methods to define trends. Nowadays, this Gaussian Channel is highly known as a method to support HOLD techniques in crypto. If the price is above the channel the trend is strong, if it comes back to the channel this can react as a resistance and indicate the beginning of a bear market (or Winter) if the price breaks below it. Eventhough the use of this channel focuses on h
Master Pullback
TDINVEST LLP
5 (3)
- 50% OFF - Telegram group : https://t.me/+5RIceImV_OJmNDA0 MT5 version : https://www.mql5.com/en/market/product/85917?source=Site+Market+Product+Page Master Pullback is a complete system that gives unique trading opportunities and a clear indication of the market: trend, signals as well as stop loss and take profit levels. This system has been designed to be as simple as possible and detects extreme overbought and oversold zones, support and resistance levels, as well as the major trend. You p
作者的更多信息
Steady Ranger EA
Davit Beridze
3 (2)
Steady Ranger EA – 智能安全的通道交易 回测: 使用提供的 set 文件(位于“评论”部分)在“仅开盘价”模式下进行测试。 视频: 观看字幕版以获得完整理解。 为什么选择 Steady Ranger EA? 一款长期稳定、风险可控的交易系统,专注于安全性和一致性,而非夸大收益。 多层止损保护: 结合单笔交易止损和“总亏损限制”控制回撤。 通道交易策略: 在通道极端水平开仓,依据信号平仓,同时严格控制风险。 自适应仓位调整: 通过动态调整手数避免过度风险。 多时间框架过滤: 规避强趋势行情下的不必要交易。 可靠且经过验证: 经过长期稳定测试,适用于实盘交易。 EA 如何工作? EA 依据价格通道开仓,并根据信号、止损或风控机制平仓。避免过度曝险,限制最大持仓规模,以确保稳健交易。 主要输入参数 交易设置: 初始手数、手数倍增、止损、止盈。 风险管理: 保本水平、跟踪止损、最大持仓量。 市场条件: 最大点差、滑点容忍度、最小订单间距。 交易时间: 可自定义的交易时间、交易时段结束后的清仓选项。 指标与过滤: 布林带、RSI、波动率过滤、多时间框架设置。 挂单选项: 支持挂
PRO Trend Divergence
Davit Beridze
5 (2)
此指标适用于实时图表,不适用于测试器。 PRO Trend Divergence 指标是一款先进的技术分析工具,专注于检测 趋势延续背离 ,这是一种表明当前趋势可能会持续的信号。与传统指标强调趋势反转不同,这款工具帮助交易者识别趋势依然强劲的市场状态,即使在短暂回调或小幅调整时也是如此。 趋势延续背离 出现在价格沿趋势方向移动时(上升趋势中的更高低点或下降趋势中的更低高点),但所选指标却出现背离,确认趋势可能继续。 PRO Trend Divergence 指标使交易者能够自信地跟随趋势,减少过早退出的风险。 特点与优势 多指标支持 支持 MACD、RSI、Stochastic、CCI、Momentum、OBV、VW-MACD、CMF 和 MFI。 图表上的可视信号 显示背离线条,并支持颜色和样式的自定义。 关键枢轴点集成 利用关键的高点和低点来优化信号,减少噪音。 灵活高效 提供信号确认、筛选和时间周期选择的自定义参数。
RSI Entry Points
Davit Beridze
5 (5)
RSI Entry Points is the upgrade of the standard RSI indicator to avoid lagging. Indicator draws the clouds and the arrows to have clear picture where price is and what to wait for. Why standard RSI is lagging? because mostly we do not use it correctly and it is with very weak visual flexibility, less informative. With my current upgrade I tried to Fix both problems same time and I got much better results and more exact entries than standard RSI has. I Made RSI line Dynamic, it gets more flexible
Period Cross RSI
Davit Beridze
5 (6)
Check my p a id tools they   work  perfect! "Period Cross RSI" Is a New indicator idea that shows crosses of two RSI lines with different periods which creates ascending and descending zones for confirmation of long and short trading. This indicator is brend new and will be upgraded further, for now I recommend to use it as a confirmation, filter indicator for determination of long/short trading zones, not as a signaler indicator for now. Further upgrades can make it as a signaler indicator as w
FREE
MRA Index
Davit Beridze
5 (5)
MRA Index 指标概述 赠品优惠: 购买该指标即可免费获得“MRA Index EA”。 优化策略: 对于剥头皮交易,我基于过去 12 个月的数据进行优化,并在接下来的一个月内使用这些设置。这种方法已被证明非常有效。 重要说明: 默认设置仅供可视化使用,未经过盈利优化。正确的优化指南仅提供给购买者。 关于“MRA Index”指标: “MRA Index”是一款多功能外汇指标,可帮助交易者识别潜在的市场趋势和入场点。它具有一个专门的通道和在该通道内移动的动态混合线,用于生成买入和卖出信号。 主要特点: 动态混合线: 在通道内移动,并作为生成交易信号的基础。 买入和卖出箭头: 基于混合线与通道的特定交互生成,指示潜在的市场反转。 自定义功能: 交易者可以通过调整各种输入参数来优化指标以适应其策略。 可选过滤器: ATR(平均真实范围): 可启用或禁用,以调整灵敏度。 布林带(BB): 帮助根据价格走势过滤信号。 FTR 过滤器: 提供带有颜色编码的市场趋势可视化功能。 自定义选项: 该指标提供多个输入参数,具有灵活性,包括 ATR、MFI、RSI、布林带和标准差的设置。此外,交易者
测试演示版没有任何意义。你不会通过查看闪烁的数字了解任何信息。这是一个仪表盘。请尝试理解其理念,接下来我会帮助你完成所有内容。 符号必须用逗号(,)分隔,并按照你经纪商的显示格式输入参数,以确保它们能在仪表盘中识别。这些符号将被用于指标分析。 只需点击一次,即可直接从仪表盘打开任何货币对和任何时间周期。 MA Speedometer Dashboard 是一款功能强大的MetaTrader 4 (MT4) 指标,旨在通过动态市场分析增强交易策略。它提供强大的功能,用于识别市场趋势、在横盘市场中交易以及退出平淡市场条件,这一切基于移动平均线的角度。作为特别赠品,客户还会获得一款特别版本的MA Speedometer指标,这是 MA Speedometer Dashboard 的基础。 主要特点: 综合趋势分析:仪表盘使用移动平均线(MA)的角度来检测潜在的市场趋势。交易者可以通过颜色编码信号轻松发现强劲上升或下降趋势的开始: - 绿色:表示强劲上升趋势的开始,提供入场机会。 - 红色:表示强劲下降趋势的开始,也提供了入场机会。 - 黄色:表示横盘或平淡市场,提示潜在的退出点。
Filtered TMA Arrows
Davit Beridze
4.25 (4)
Check my p a id tools they   work  perfect please r ate Here is an Upgraded version with Bonus Ea in case of purchase it costs 30$ only and you get Ea as Bonus:  https://www.mql5.com/en/market/product/96835 This indicator is experimetal, it shows TMA channel arrows with Volatility filter built in to avoid lagging. Try to experiment with it, search for better conditions of use. It is possible to adjust different timeframes for TMA and for Volatility filter Same time on the current chart, so it ma
FREE
Adjustable Pin Bar
Davit Beridze
4.67 (3)
Check my p a id tools they   work  perfect please r ate Adjustable PIN BAR indicator is usefull tool alowing to search for pin bars you wish to find on the price chart, it has 2 parameters to filter out what type of pin bars you wish to search for: 1) MinTailProc 75% (default) which means to show pin bars that has minimum size of the Nose (Tail) as 75% of full candle size. If Upper Nose (Tail) size of the candle is minimum 75% of the candle size fully than candle is painted in RED. If Lower Nose
FREE
MA Speedometer MT5
Davit Beridze
5 (3)
Non standard attitude to the standard moving average indicator. The essence of the indicator is to determine the strength and speed of the price direction by determining the tilt angle of the moving average. A point is taken on the fifteenth MA candle and a point on the last closed MA candle, a straight line is drawn between them, it is movable and on a hemisphere shows an angle of inclination from 90 degrees to -90. above 30 degrees is the buying area, below -30 degrees is the selling area. abo
SpeedAngle
Davit Beridze
SpeedAngle 指标 是一款先进的 MetaTrader 4 工具,可计算价格运动角度,提供动态视觉提示和可自定义的警报,帮助交易者识别趋势反转和动量变化。 主要功能 基于角度的趋势分析: 通过用户定义的周期计算角度,显示价格动量和方向。 动态视觉效果: 显示根据角度阈值变化颜色的彩色圆圈: 高于 LevelMax: 表示强劲的上升动量。 低于 LevelMin: 表示强劲的下降动量。 在范围内: 表明价格整合或轻微波动。 可自定义警报: 提供“从极值”或“从中间”两种场景的警报,并支持声音、电子邮件和推送通知。 买入/卖出箭头: 可选箭头显示潜在交易信号。 高度可配置: 调整阈值、颜色、警报设置等。 优点 简化市场分析: 通过视觉提示和警报快速识别关键价格条件。 节省时间: 警报通知您交易机会,无需时刻监控图表。 适合任何策略: 可用于短线交易、波段交易和趋势跟随策略。 输入参数亮点 计算: 定义回溯周期( StartBar )和历史数据限制( MaxBarsHistory )。 视觉效果: 自定义圆圈和线条颜色。 警报: 启用声音、电子邮件或推送通知。 阈值: 设置 Leve
MA Speedometer
Davit Beridze
4.6 (10)
Dashboard for Ma Speedometer:  https://www.mql5.com/en/market/product/116784 Non standard attitude to the standard moving average indicator. The essence of the indicator is to determine the strength and speed of the price direction by determining the tilt angle of the moving average. A point is taken on the fifteenth MA candle and a point on the last closed MA candle, a straight line is drawn between them, it is movable and on a hemisphere shows an angle of inclination from 90 degrees to -90. a
RSI Entry Points MT5
Davit Beridze
5 (1)
RSI Entry Points is the upgrade of the standard RSI indicator to avoid lagging. Indicator draws the clouds and the arrows to have clear picture where price is and what to wait for. Why standard RSI is lagging? because mostly we do not use it correctly and it is with very weak visual flexibility, less informativity. With my current upgrade I tried to Fix both problems same time and I got much better results and more exact entries than standard RSI has. To make yourself sure check out the screens
Check my paid tools they work great and I share Ea's based on them for free please r ate The Dual Timeframe RSI (Relative Strength Index) indicator is a novel trading tool that allows traders to monitor RSI readings from two different timeframes on a single chart. This dual perspective enables traders to identify potential trend confirmations and divergences more effectively. For instance, a trader might use a 1-hour RSI alongside a daily RSI to ensure that short-term trades align with the broa
FREE
Indicator shows buy/sell arrows depending on volatility factor. Indicator does not repaint! It works on any pair and any timeframe. It is well tested through strategy builders and shows quite interesting results as a good filter indicator and as independent signaler as well (check the screenshots). It is possible to search for a lot of interesting parameters for profitable trading, some of which are shown on the screenshots. There are next inputs in indicator settings: N-volatility period; Level
This EA is Created just for RSI Entry points Indicator ( https://www.mql5.com/en/market/product/67581 Test, to show indicators profitable parameters and to give potential buyers possibility to backtest indicator Entries. EA opens Buy orders on Buy Arrows and Sell orders on Sell Arrows of the indicator, orders are closed on opposite signals. EA is not created for Live automated trading, thats not the goal to sell EA, but any ways if you like it and need it, you can rent. Default settings are fo
MFI Modern PRO
Davit Beridze
4.92 (38)
Def ault settings   are just for visu alis ation, it c an not be profit able with it.  Get a Free EA as a Bonus when you Purchase the Indicator! Plus, Receive 4 Interesting Additional Indicators. Recommended set files for backtesting the indicator on recommended pairs are available in the comments section (last page). Please note that this product is exclusively sold on the MQL5 market. Any other sources offering it are scams, and the author bears no responsibility. To receive the bonus gifts,
Re ad First Before Testing. This Ea goes as a Bonus to  MFI Modern PRO indicator users only. Set files generated  after upgrade you can check in comments section. This Expert advisor is based on MFI Modern PRO indicator   https://www.mql5.com/en/market/product/80765 just to  give possibility to indicator users for fastly test the indicator Before buying. In comments section recommended set files are uploaded by which you can prove yourself that backtest data from indicator overview are real. Thi
MA Revolution
Davit Beridze
5 (1)
MA Revolution is upgraded version of standard Moving   A verage. With the current upgrade moving average line got more sensitive with different market conditions. It gets more flexible by decreasing default period step by step while market is sharp and incrasing period back to default period step by step while market is normal again. testing of the ide a shows th at this upgr aded version gives much more acur acy for detecting m arket direction, ch anges in direction are shown much e arly th an
Laguerre Scrat
Davit Beridze
5 (1)
In case you get Laguerre S crat indicator, you will get Laguerre Scrat Ea as a Gift. To get Ea  and det a iled m anu al PDF contact me PM. Default settings are for usd/cad H4 For St able Long term Profits Laguerre Scrat is a trading system based on 4 indicator combinations in the shape of one indicator. Laguerre indicator (upgraded), CCI, Bollinger bands and market volatility factor. It generates arrows in the indicator window and nuts on the price chart, doubling arrows for a better view where
Fiter
Davit Beridze
5 (2)
购买此指标的用户将免费获得基于 Fiter 指标的EA作为奖励。(观看视频了解EA的实际操作。)请评论以获取EA。 Fiter 是一个混合指标,它将指数移动平均线 (EMA) 与经过ATR调节的RSI线(黄色)结合使用,同时配合传统的移动平均线(红色)。这两条线的交叉点生成的交易信号比经典的两条简单移动平均线的交叉信号更平滑、更可靠,帮助交易者更好地捕捉市场趋势。 回测结果证明了这种方法的有效性,显示出比简单移动平均线交叉更优越的表现。历史数据表明,Fiter 能够很好地适应各种市场条件,成为在实际手动交易中识别主要趋势的有力工具。 想要体验不同之处,请查看截图或在策略测试器中运行该指标。指标还包括警报功能,及时通知您可能的交易信号,帮助您抓住每一个重要的市场机会。
after getting indic ator cont act me for Bonus E a. Non Repaint TMA channel with special conditioned arrows on price cross of channel lines plus market Volatility factor, which makes product much more accurate than any usual tma channel indicators.  It is proven to be profitable with Ea built based on it which you will get as a BONUS in case of indicator purchase. Good luck.
Sure, here is the shortened version in Chinese: MetaTrader 4 (MT4)的K线形态指标 这个可定制的指标可以识别主要的多头和空头K线形态,帮助交易者进行技术分析和决策。 主要功能: 形态识别 : 多头 :锤子线、吞没形态、早晨之星、三只白兵、多头母子线、倒锤子线。 空头 :流星线、吞没形态、黄昏之星、三只黑乌鸦、空头母子线、上吊线。 自定义选项 :根据策略启用或禁用特定形态。通过箭头显示形态(蓝色代表多头,红色代表空头),可调大小和间距。 移动平均线集成 :可选的自定义移动平均线(周期、方法、时间框架)。 警报系统 :屏幕消息、声音、推送通知和电子邮件警报,用于提醒检测到的形态。 多形态检测: 形态聚合 :在同一根K线上显示多个形态,信号更强。 多头聚合 :多个蓝色箭头表示更强的上涨趋势。 空头聚合 :多个红色箭头表示更强的下跌趋势。 混合形态 :同时出现多头和空头形态表明市场不确定性。 此指标通过清晰的视觉表现增强了交易决策,帮助交易者更好地捕捉市场的反转和趋势延续,提升整体交易表现。
Candle Info"指标适用于MetaTrader 4 (MT4),帮助交易者直接在图表上分析和可视化关键蜡烛形态。通过识别如更高高点 (HH)、更低低点 (LL)、更高低点 (HL) 和更低高点 (LH) 等形态,提供市场趋势和潜在价格走势的洞察。 主要功能: 蜡烛形态: 识别并标记HH、LL、HL、LH,以及诸如HH & HL(看涨趋势)和LL & LH(看跌趋势)的组合。 交易时段过滤: 允许根据主要交易时段(东京、伦敦、纽约、悉尼)过滤形态,便于集中关注重要的市场时间。 警报: 可配置的屏幕、推送、邮件和声音警报,提醒交易者新形态。 自定义: 调整文字颜色、大小,并选择显示哪些时段或形态。 非常适合趋势交易和基于时段的策略,"Candle Info"指标简化了市场分析,帮助交易者更快做出明智的决策。
Indicator shows buy/sell arrows depending on volatility factor. Indicator does not repaint! It works on any pair and any timeframe. It is well tested through strategy builders and shows quite interesting results as a good filter indicator and as independent signaler as well (check the screenshots). It is possible to search for a lot of interesting parameters for profitable trading, some of which are shown on the screenshots. There are next inputs in indicator settings: N-volatility period; Level
筛选:
Lasse Michael Holm
1499
Lasse Michael Holm 2025.02.16 12:10 
 

It is a very accurate indicator. I really love it!!

Davit Beridze
9277
来自开发人员的回复 Davit Beridze 2025.02.16 12:19
hello, thank you!
ERWIN FONKE
363
ERWIN FONKE 2025.02.11 12:25 
 

i am only using the triangle signals of this indicator which are 90% accurate and are always winners. After my rent is over i will buy it

Davit Beridze
9277
来自开发人员的回复 Davit Beridze 2025.02.11 12:28
thanks Erwin! I am happy that you like it!
optioneer7
154
optioneer7 2025.01.10 15:57 
 

I dont like writing Reviews , this Time I HAVE to = During NFP when 99% of all fukkin indicators FAIL - - - NOT this ONE ! I made mucho2 $$$ + Davit ist da Best = https://www.forexfactory.com/attachment/image/4876627?d=1736694710

________ da NFP + FOMC [ google it ] ist da Most Feared Economics events , FEARED by REAL Time FX_Traders 4sure !

https://www.mql5.com/en/market/product/120552?source=Site+Profile#!tab=comments&comment=55655536&page=6

Davit Beridze
9277
来自开发人员的回复 Davit Beridze 2025.01.10 18:42
Thank you for your review! You have a reputation for being a critical evaluator, which can be intimidating for developers. I'm glad you found my tool worth trying!
Thuận Vũ
86
Thuận Vũ 2025.01.10 07:41 
 

Very good as now!! Great indicator

Davit Beridze
9277
来自开发人员的回复 Davit Beridze 2025.01.10 08:39
thanks! it is great to get review after few months of purchasing!
Robert W.
60
Robert W. 2024.12.28 12:14 
 

I recently purchased the Chart Pattern Indicator. Before sharing my thoughts on it, I wanted to thoroughly test it to see if it lives up to the claims made by its developer, Davit. Now, after using it for some time, I can confidently say that this is a superb indicator. It has met my expectations and has become an invaluable part of my trading plan. I understand that we all have different approaches to the markets; however, this indicator seems versatile enough to support a wide variety of trading strategies. For me, the most beneficial feature has been the multi-timeframe confirmation. Davit is both supportive and easy to communicate with, making the overall experience even better. This indicator is solid, well-designed, and effective. Further, the cost is entirely reasonable for the value it provides.

Davit Beridze
9277
来自开发人员的回复 Davit Beridze 2024.12.28 12:16
thanks Robert
KT-Daisangen
182
KT-Daisangen 2024.12.18 09:05 
 

It is often the first sign of a trend reversal. It seems that you can enter the pullback of the higher time frame with this sign. If you're interested, check it out in the demo and you'll see that it's great.

Davit Beridze
9277
来自开发人员的回复 Davit Beridze 2024.12.18 10:24
thanks for rating my product
mila
220
mila 2024.12.09 18:28 
 

Great work by the developer.I use this indicator on the 1 and 4 hour TF. The indicator gives very accurate signals.Thank you Davit.

Davit Beridze
9277
来自开发人员的回复 Davit Beridze 2024.12.09 18:55
thanks mila
Ravi Chandiran
624
Ravi Chandiran 2024.12.02 10:22 
 

Excellent Indicator!

Davit Beridze
9277
来自开发人员的回复 Davit Beridze 2024.12.02 11:08
Thanks Ravi
luvico972
122
luvico972 2024.11.19 03:53 
 

Hi Davit ! It's done ! PRO Trend Divergence + Chart Patterns All in One. I need your HELP now ! WHAOUH DAVIT !! 2000 $ in 1 Hour !! on GOLD

Maintenant il faut que j'en comprenne vraiment le fonctionnement

5000 $ On GOLD ! now !

Davit Beridze
9277
来自开发人员的回复 Davit Beridze 2024.12.02 11:08
Thank you Luvico :)
Elrick Harris Jr
125
Elrick Harris Jr 2024.11.14 21:54 
 

Great indicator that I use to scalp gold and other pairs. Very reliable, once you get the hang of it profits will come 😊

Davit Beridze
9277
来自开发人员的回复 Davit Beridze 2024.12.02 11:07
thanks Elrick!
stucan
418
stucan 2024.10.27 16:07 
 

I'm more of a fan of automated trading. However, this indicator is definitely unbeatable when it comes to the price/performance ratio. I can definitely recommend this indicator.

Davit Beridze
9277
来自开发人员的回复 Davit Beridze 2024.10.27 18:55
thanks
leo-leo13
19
leo-leo13 2024.09.20 08:45 
 

用户没有留下任何评级信息

Davit Beridze
9277
来自开发人员的回复 Davit Beridze 2024.10.13 12:36
thanks
babaxa
19
babaxa 2024.09.20 08:02 
 

用户没有留下任何评级信息

Davit Beridze
9277
来自开发人员的回复 Davit Beridze 2024.10.13 12:36
thanks
JoaoSilva7
37
JoaoSilva7 2024.09.19 12:44 
 

Mostly i liked the triangles and pennant patterns, i have enabled them into my charts and they are a good tool for market analysis.

Davit Beridze
9277
来自开发人员的回复 Davit Beridze 2024.10.13 12:36
thanks
Mikeladze Roland
21
Mikeladze Roland 2024.09.17 10:55 
 

I’ve been testing before purchase and using the Chart Patterns All in One indicator for a while now, and I have to say it’s an excellent tool—especially if you understand how to properly use all the features it offers. One thing to be aware of: the triangles are based on the ZigZag indicator, which means they can sometimes disappear or appear later as the price action evolves. This is a natural behavior of any ZigZag-based tool, and it’s clearly mentioned in the product description. However, there’s a smart way to make the most of these triangles: by using a confirmation timeframe. This means before you take a trade based on a triangle signal, you first confirm it on a higher timeframe. By doing this, you can significantly improve the reliability of the signals, even when dealing with patterns that may repaint. That said, it’s important to note that the ZigZag-based triangles are just one of the many patterns available in this indicator. The other patterns—such as the 1-2-3, Double Top/Bottom, and others—do not repaint and work flawlessly. To sum it up, this is a great indicator from Mr. Beridze for those who know how to appreciate good, professional, and effective work. It’s an essential tool to understand what’s happening on your chart and the direction of price. 5 stars for this!

Davit Beridze
9277
来自开发人员的回复 Davit Beridze 2024.10.13 12:36
thanks
NN
794
NN 2024.09.16 00:46 
 

The 'Chart Patterns All in One' indicator repaints! SCAM!!!!! In the comments section, I can prove to you that it repaints by comparing screenshots of the same chart. When I added the indicator on a different day, it repainted. It even went back in time (from 23:40 back to 22:55). First, there was the BLUE triangle for BUY, and then the PINK triangle for SELL. Maybe $50 isn't much to you, but for some people living in less developed countries, it’s tough to lose such an amount on a product that doesn't work. What he is doing isn't right. I even tried contacting him, but instead some other person contacted me telling me that the Developer cannot communicate on MQL, and I need to contact him in Telegram. Ever heard such nonsense? If you study the comments section of this indicator, you’ll notice that only the developer (Davit Beridze) uploaded posts and praised the performance of his own indicator. You won’t find a single user praising it. I really doubt this developer is honest or that his other products work well. So be aware!

Davit Beridze
9277
来自开发人员的回复 Davit Beridze 2024.12.02 18:05
this is working indicator, it is not scam according users feedback. :) your review is something like description of CRIME not a technical indicator. Chart Patterns All in One contains collection of 8 patterns from which Triangles are just 1 part out of 8 and it can sometimes disappear or be late of few bars (This is Mentioned in Overview). But despite of this Zig-Zag based characteristic it still shows profit if use independently or with confirmation of signal on higher timeframe. It is shown in video as well that it can show profit independently. All other 7 patterns has NO such moment and they work well. there are hundreds of variations for using combinations of all patterns together. I don't know if you search for the Grail (it does not exist) but if you search for good indicator here it is, if you are not lazy to research and use it. It is not honest to write such review and say anything about other indicators of mine even without trying them. Also I had technical problem with MQL5 to send message, So my users contacted you to contact me through mail or telegram but you did not contact me to solve your problem you just write this illogical review.
George Heck
410
George Heck 2024.09.12 07:01 
 

Davit is a fantastic guy to talk with. We chatted for a few days about different strategies and indicators he would recommend. This indicator is quite confusing and rather hard to use. BE AWARE THIS INDICATOR WILL REPAINT. A signal may be there on the chart for a buy triangle one moment, but switch over to a sell triangle if the buy is broken. Not saying it's bad, just saying you should know of the repainting.

Davit Beridze
9277
来自开发人员的回复 Davit Beridze 2024.12.31 15:11
thanks George. Yes triangles have such character as it is based on Zig-Zag and it is mentioned in Overview. All other Patterns have no such Problem. But even Triangles with its repaint character can be profitable independently or with confirmation on higher timeframes. I am showing this possibility with EA that works based on Triangles only. Thanks again!
fangfang
100
fangfang 2024.09.07 19:21 
 

I personally think that triangles are very useful as a tool for determining direction. As long as you are not greedy, weekly profits are more lucrative than working. The author is very meticulous, and the user manual covers languages from various countries. The overall experience is great.

Davit Beridze
9277
来自开发人员的回复 Davit Beridze 2024.09.08 10:17
Thanks
Junichi Isono
868
Junichi Isono 2024.08.27 01:40 
 

It is a very accurate indicator. I'm waiting for a sign on the 4-hour timeframe and looking for an entry point on the 15-minute timeframe, and both signs are valid.

Davit Beridze
9277
来自开发人员的回复 Davit Beridze 2024.09.08 10:17
thanks
สุกิจฏิพันธ์
214
 

用户没有留下任何评级信息

Davit Beridze
9277
来自开发人员的回复 Davit Beridze 2024.07.27 14:40
welcome. thanks
12
回复评论
版本 2.6 2024.11.14
bug fixed
版本 2.5 2024.11.13
Bug with Alerts Fixed
版本 2.2 2024.08.16
With this update when you chose some patterns to show from Panel, Changing Timeframes will not turn ON all patterns on panel, for example if you need to check triangles pattern only on different timeframes you will not need to turn OFF other patterns from panel every time you change timeframe. Chosen pattern will stay ON
版本 2.1 2024.08.09
Double Top-Bottom and Triple Top-Bottom arrows fixed, it was showing arrows from current bar which is working process and appearing and disappearing on current bar is normal, but some traders understand that as "Repaint" which is not true. Now Arrow appears on closed bar so no working process show up any more.
版本 1.20 2024.07.27
Now "Control Panel" is movable, you can drag it to any place you wish on the chart. Alerts are given now on closed bar, after signal is formed. not on current bar!
版本 1.1 2024.07.24
Few bugs fixed and Added Max Bar option to make indicator appear that parts which possible to do that way. this way it gets softer, in case you wish to check more history back on chart just increase that number in options, default it is set to 1000.