Angular Trend Lines MT5
- 指标
- Vitalyi Belyh
- 版本: 5.0
- 激活: 10
趋势指标是用于金融市场交易的技术分析领域之一。
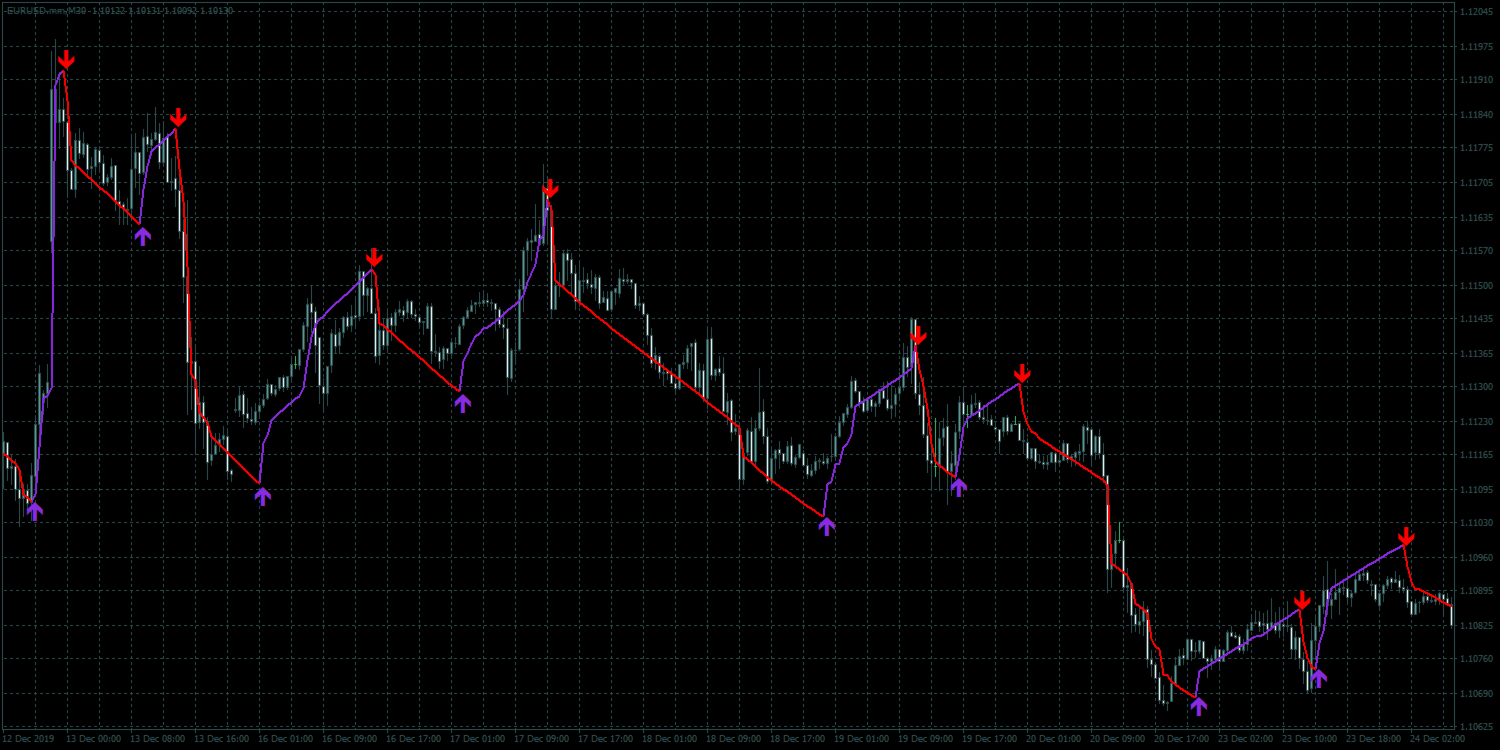
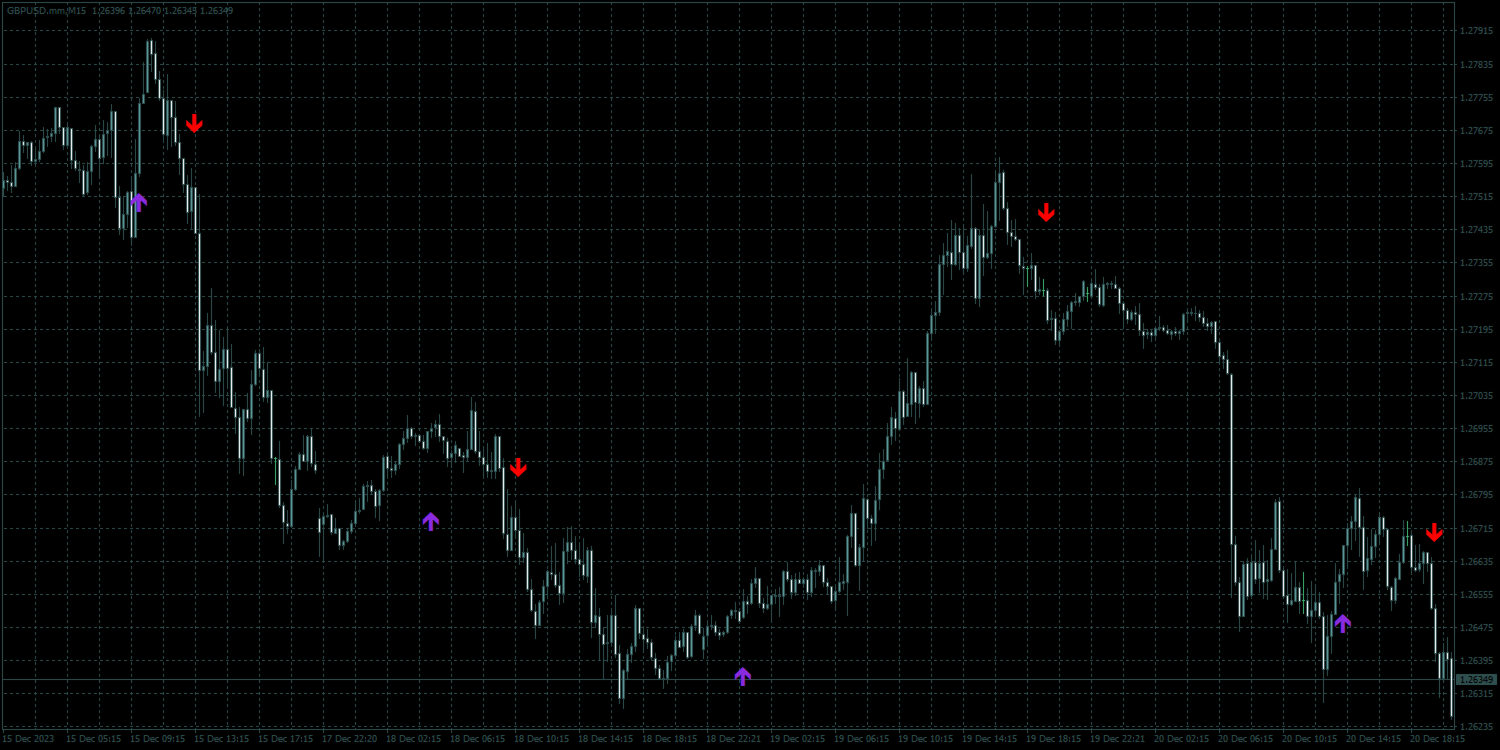
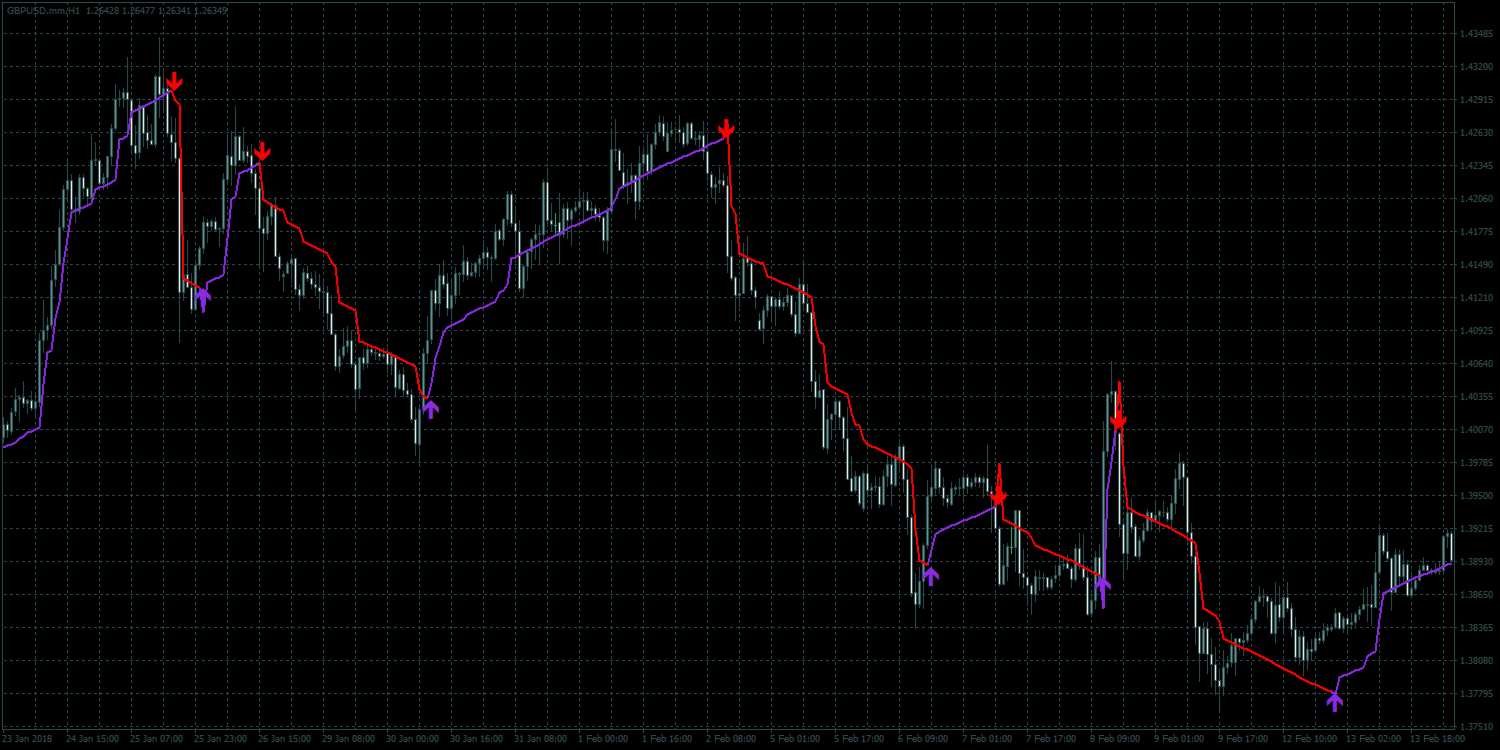
Angular Trend Lines - 全面确定趋势方向并产生入场信号。除了平滑蜡烛的平均方向
它还利用趋势线的倾斜角度。构建江恩角度的原理被当作倾斜角度的基础。
技术分析指标结合了烛台平滑和图表几何。
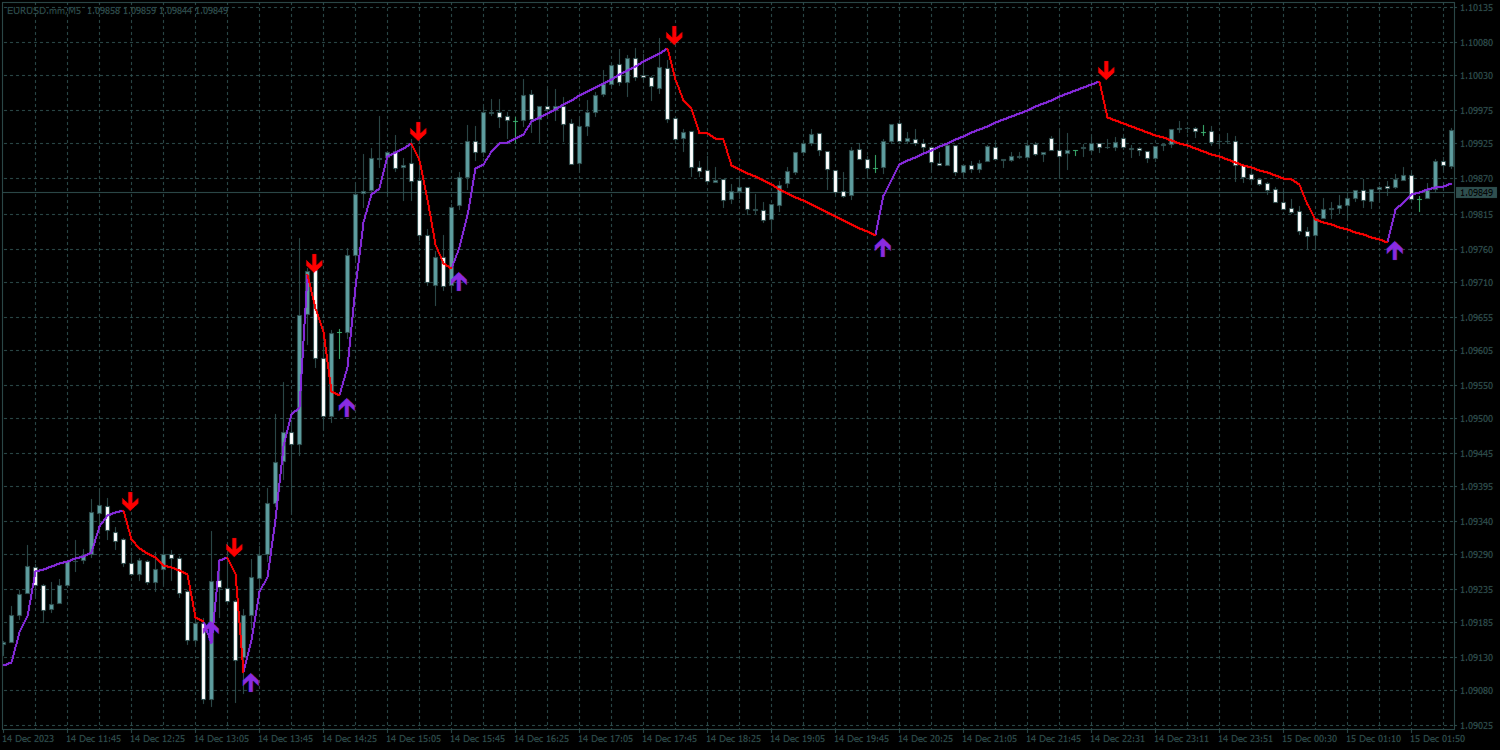
趋势线和箭头有两种类型:红线和箭头表示看涨方向。紫线和箭头表示看跌方向。
指示器功能
该指标使用简单、参数配置方便,可用于趋势分析和接收开仓信号。
指示器不会重新绘制,箭头出现在蜡烛的收盘处。
当信号发生时提供多种类型的警报。
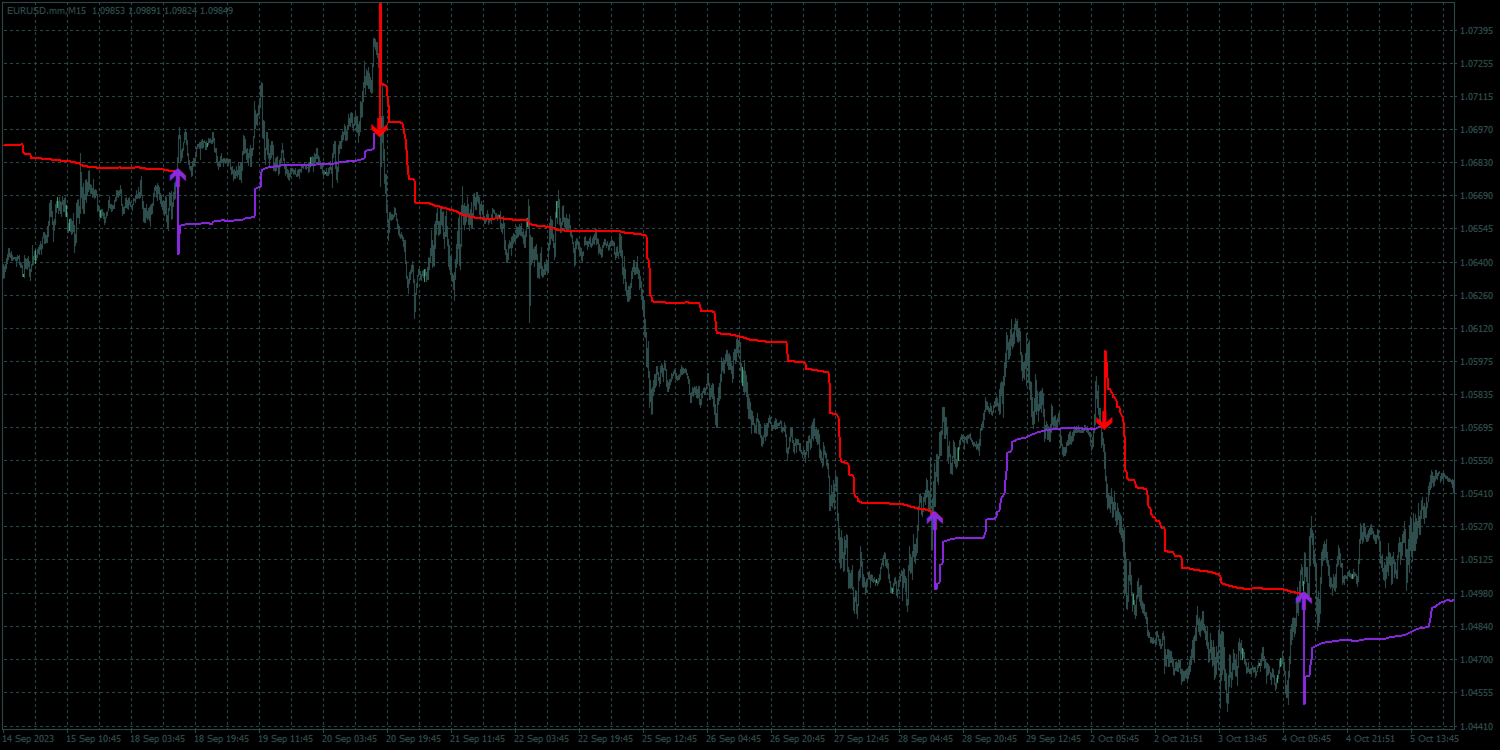
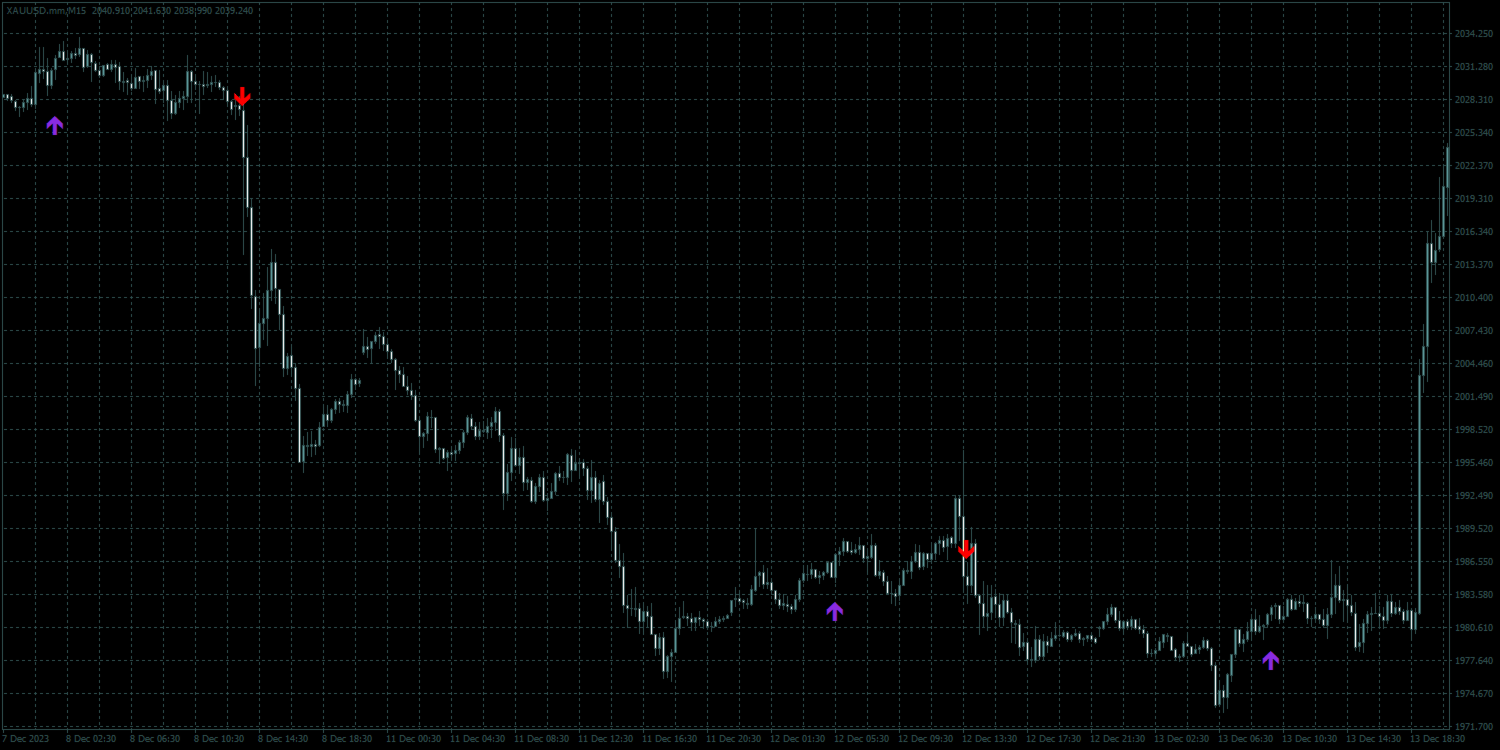
可用于任何金融工具(外汇、加密货币、金属、股票、指数)。
该指标可以在任何时间范围和图表上发挥作用。
该指标采用轻量级算法,不加载处理器,确保在多个窗口中使用。
根据时间范围和交易方法选择参数。
主要输入参数
Period - 用于分析计算的蜡烛数量。
Angle ——趋势线的斜率。
Angular Trend Lines - 全面确定趋势方向并产生入场信号。除了平滑蜡烛的平均方向
它还利用趋势线的倾斜角度。构建江恩角度的原理被当作倾斜角度的基础。
技术分析指标结合了烛台平滑和图表几何。
趋势线和箭头有两种类型:红线和箭头表示看涨方向。紫线和箭头表示看跌方向。
指示器功能
该指标使用简单、参数配置方便,可用于趋势分析和接收开仓信号。
指示器不会重新绘制,箭头出现在蜡烛的收盘处。
当信号发生时提供多种类型的警报。
可用于任何金融工具(外汇、加密货币、金属、股票、指数)。
该指标可以在任何时间范围和图表上发挥作用。
该指标采用轻量级算法,不加载处理器,确保在多个窗口中使用。
根据时间范围和交易方法选择参数。
主要输入参数
Period - 用于分析计算的蜡烛数量。
Angle ——趋势线的斜率。