Vitalyi Belyh / 卖家
已发布的产品

趋势指标是用于金融市场交易的技术分析领域之一。
Angular Trend Lines - 全面确定趋势方向并产生入场信号。除了平滑蜡烛的平均方向
它还利用趋势线的倾斜角度。构建江恩角度的原理被当作倾斜角度的基础。
技术分析指标结合了烛台平滑和图表几何。
趋势线和箭头有两种类型:红线和箭头表示看涨方向。紫线和箭头表示看跌方向。
指示器功能
该指标使用简单、参数配置方便,可用于趋势分析和接收开仓信号。
指示器不会重新绘制,箭头出现在蜡烛的收盘处。
当信号发生时提供多种类型的警报。
可用于任何金融工具(外汇、加密货币、金属、股票、指数)。
该指标可以在任何时间范围和图表上发挥作用。
该指标采用轻量级算法,不加载处理器,确保在多个窗口中使用。
根据时间范围和交易方法选择参数。
主要输入参数
Period - 用于分析计算的蜡烛数量。
Angle ——趋势线的斜率。

Linear Trend Predictor — 结合切入点和方向支撑线的趋势指标。按照突破高/低价通道的原理运作。该指标算法过滤市场噪音,考虑波动性和市场动态。
指示器功能
使用平滑方法,显示市场趋势和开立买入或卖出订单的切入点。 适合通过分析任何时间范围内的图表来确定短期和长期的市场走势。 输入参数可适应任何市场和时间范围,允许交易者独立定制指标。 设定的指示信号不会消失,也不会重新绘制——它是在蜡烛收盘时确定的。 几种类型的通知以箭头组合。 该指标既可以作为独立的交易系统使用,也可以作为其他交易系统的补充。 可供任何经验水平的交易者使用。
主要参数
Volatility Smoothing Level - 指标的主要参数,允许您配置指标以实现舒适的操作。
它的数字范围是 1 到 100,从而增加了您可以获得更长趋势运动的平滑度。
通过少量的数字,您可以获得短期走势并快速退出交易。
使用指标进行交易的时刻:
红线和箭头表示下降趋势和卖出开盘信号。止损应根据前一个上分形来设置。 黄线和箭头表示上升趋势和买入开盘信号。止损应根据前一个下分形来设置。

Volatility Trend System - a trading system that gives signals for entries. The volatility system gives linear and point signals in the direction of the trend, as well as signals to exit it, without redrawing and delays.
The trend indicator monitors the direction of the medium-term trend, shows the direction and its change. The signal indicator is based on changes in volatility and shows market entries.
The indicator is equipped with several types of alerts. Can be applied to various trading ins

Level Breakout Indicator is a technical analysis product that works from upper and lower boundaries, which can determine the direction of the trend. Works on candle 0 without redrawing or delays.
In its work, it uses a system of different indicators, the parameters of which have already been configured and combined into a single parameter - “ Scale ”, which performs gradation of periods.
The indicator is easy to use, does not require any calculations, using a single parameter you need to select

波浪同步器是波浪分析的可视化指标。结合蜡烛图运动序列并构建定向波浪,与市场一起产生同步运动。
每个波浪的开始都以信号箭头开始,还有警报。
该指标永远不会重绘或移动先前历史记录上的箭头。
信号箭头出现在蜡烛图的收盘价。
适用于任何交易工具和时间框架。
易于使用和配置,仅包含 2 个输入参数:选择与所选参数一起使用的时间框架和计算 MA 线的方法。
推荐的参数可以移动 1-2 个周期。
红色箭头方向用于购买交易资产。
蓝色箭头方向用于出售交易资产。 ----------------------------------------------------------------------------------------------

Cyclical indicator for trading and predicting the direction of the market. Shows the cyclical behavior of the price in the form of an oscillator.
Gives signals for opening deals when rebounding from the upper and lower boundaries of the oscillator. In the form of a histogram, it shows the smoothed strength of the trend.
Will complement any trading strategy, from scalping to intraday. The indicator does not redraw. Suitable for use on all symbols/instruments. Suitable time frames for short-term t

交易水平指标是一个交易系统,旨在确定入场点、持有仓位和趋势方向。
包括在一个复合体中工作的多种机制、趋势方向的波浪分析、构建信号时的水平分析、显示可能的 TP 和 SL 目标。
指标能力
信号箭头出现在当前蜡烛上并且不会重新着色。 使用特殊算法来搜索价格反弹的水平。 根据趋势进行工作。 该系统具有通用性,可适用于各种交易工具。 箭头警报有多种类型。 信号箭头的输入参数在自动模式下配置和运行。 根据时间范围更改“趋势波周期”参数 “目标水平 SL TP”参数是针对主要货币对定义的;用于其他交易工具时,可以增加 10 或更多。
指标如何工作
判断趋势,该指标有一条波浪线;如果它高于价格,则趋势看跌;如果低于价格,则趋势看涨。 红色信号箭头用于购买,黄色信号箭头用于销售。 水平虚线是构建信号的电平;构建该线时,信号处于活动状态。 目标水平 SL 和 TP 的存在是为了方便技术分析和选择趋势参数。

Arrow Micro Scalper 是一款专为剥头皮和短期交易而设计的指标,可集成到任何图表和金融工具(货币、加密货币、股票、金属)中。
在她的工作中,她使用波浪分析和趋势方向过滤器。建议在从 M1 到 H4 的时间范围内使用。
如何使用指标。
该指标包含 2 个用于更改设置的外部参数,其余参数已默认配置。 大箭头表示趋势方向的变化,蓝色箭头表示下降趋势的开始,粉红色箭头表示上升趋势的开始。 “ Only trending direction ”参数启用和禁用使用内部趋势的模式,提供使用您自己的趋势或不使用趋势的机会,并且还启用/禁用仅根据趋势显示趋势箭头和信号箭头。 小信号箭头,该指标最重要的对象,粉色代表“买入”交易,蓝色代表“卖出”交易。 “ Smoothing ”参数决定信号箭头出现的时间,操作范围为 7 到 25,为时间范围 M1-M5 选择大值,为 M15-H1 选择中值,为 H4 - D1 选择小值。 趋势箭头和开始信号箭头有警报。 指标不会重新绘制。
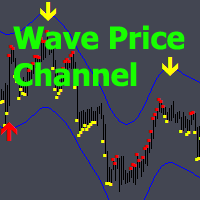
Wave Price Channel - 旨在寻找冲动和修正的交易分析系统。
该指标允许您沿着价格通道的方向工作,该通道建立在波动性的基础上。
当在通道上绘制向上或向下箭头时,就可以朝该方向前进;该方向的信号由对价格变化敏感的点指标确认。
只要相同颜色的点持续存在,信号就会持续存在。如果有箭头,但没有相同颜色的点,则该信号是错误的,您需要在点出现时跟随它。
该指标具有唯一可更改的参数“价格通道长度”,可以针对不同的时间范围进行更改。 建议在 M15 及更高时间范围上使用。 可用于任何交易工具。 箭头有多种类型的警报。 在操作过程中,可以将信号箭头更改为 1 根蜡烛。
如果出现红色向上箭头,则表示进行购买;红点是箭头轨迹的延续。 如果出现黄色向下箭头,则是进行销售的信号;黄色点表示箭头轨迹的延续。

构建图表并识别周期性价格变动的技术指标。
可以在任何图表上工作。
几种类型的通知。
图表本身还有额外的箭头。
无需重新绘制历史记录,只需关闭蜡烛即可。
建议使用 M5 及以上的 TF。
易于使用和配置参数。
当使用 2 个具有不同参数的指标时,您可以单独使用它们,而无需其他指标。
有 2 个输入参数
周期性和信号持续时间
这两个参数处理图表结构的处理。
Cyclicity 调节反转周期的变化频率,平滑周期。 Signal duration 为最小数字,检测价格变动中的脉冲,最大长期趋势变动。 ---------------------------------------------------------------------------------------

Upper and Lower Reversal - 早期预测反转时刻的系统。允许您在价格变动通道的上限和下限的边界处找到价格转折点。
指示器永远不会重新着色或改变信号箭头的位置。红色箭头是买入信号,蓝色箭头是卖出信号。
适应任何时间范围和交易工具 该指标不会重新绘制,仅在蜡烛收盘时起作用。 信号警报有多种类型 该指标易于使用,只有 2 个外部可配置参数: Channel Length - 调整构建信号的价格通道的长度。 Signal Normalization - 改变信号箭头的质量水平,参数越高 - 错误信号越少(对于 BTC、黄金和高波动性工具,变化几个数量级) Alerts play sound / Alerts display message / Alerts send notification / Send email - 当输入信号箭头出现时使用通知。 Sound for signals - 信号箭头的声音文件。
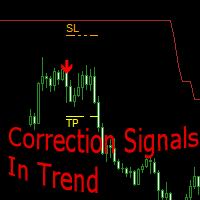
Correction Signals In Trend 一 种分析市场动态的技术指标,帮助交易者确定趋势方向并找到开仓点。
以支撑线和阻力线形式呈现的趋势跟踪指标显示上升或下降趋势。
在趋势方向上,修正结束后,进行信号搜索。箭头表示进行交易操作的潜在时刻。
对于每个信号,都会显示推荐的 SL 和 TP 设置。
指示器功能
信号箭头出现在当前蜡烛上,并且不会重新绘制。 当信号出现时,有几种类型的警报可用。 按照趋势的方向努力。 它是通用的,可以用于任何交易工具和时间范围。 SL 和 TP 级别参数根据市场情况自动计算。 适合短期交易,包括剥头皮交易。 屏幕截图中显示了指标操作的视觉描述。
设置输入参数
Trend line length - 控制支撑和阻力趋势线的长度。 Sensitivity of correction signals - 改变校正信号的灵敏度。数字越高,信号越正确。数字越小,信号越多。

Arrow Micro Scalper 是一款专为剥头皮和短期交易而设计的指标,可集成到任何图表和金融工具(货币、加密货币、股票、金属)中。
在她的工作中,她使用波浪分析和趋势方向过滤器。建议在从 M1 到 H4 的时间范围内使用。
如何使用指标。
该指标包含 2 个用于更改设置的外部参数,其余参数已默认配置。 大箭头表示趋势方向的变化,蓝色箭头表示下降趋势的开始,粉红色箭头表示上升趋势的开始。 “ Only trending direction ”参数启用和禁用使用内部趋势的模式,提供使用您自己的趋势或不使用趋势的机会,并且还启用/禁用仅根据趋势显示趋势箭头和信号箭头。 小信号箭头,该指标最重要的对象,粉色代表“买入”交易,蓝色代表“卖出”交易。 “ Smoothing ”参数决定信号箭头出现的时间,操作范围为 7 到 25,为时间范围 M1-M5 选择大值,为 M15-H1 选择中值,为 H4 - D1 选择小值。 趋势箭头和开始信号箭头有警报。 指标不会重新绘制。

Point Trend Indicator - An indicator of the upper and lower level of the trend, which can determine the trend direction and indicate its strengthening. The trend direction is determined by round dots; if the points are above the zero line, the trend is bullish; if below, the trend is bearish. The increase in directional movement is indicated by arrows. It has the only parameter for manual adjustment - Duration of the trend direction.
Possibilities
Works on all time frames Adapts to any financ

A complex of indicators of recognizing reversal moments. Detects the peaks and hollows according to the combinations of candles after they deduct from two MA. Applicable for trading systems when using early inputs. You can use a trend for scalping and intraday trade, and for detecting a trend in the early stages.
Possibilities
The parameters provide flexible settings for any time floms and trading tools. There are several types of warning for signals. Yellow arrow - Sell signal , pink arrow -

“ Easy Trend Scalper ”指标是为趋势方向内的剥头皮交易而设计的。
指标的工作原理。
该指标决定市场走势的方向。
红色大箭头表示看涨方向。
蓝色大箭头-表示看跌方向。
在看涨或看跌趋势中,有一种算法可以以小箭头的形式生成剥头皮信号。
橙色箭头是购买信号。
蓝色——表示销售。
可以用于任何交易工具和任何时间范围。 当信号出现时提供几种类型的警报,用于改变趋势方向和进入信号。 无需重新绘制,可让您预测 2-5 根蜡烛的价格走向。 箭头形成模式可以手动更改——在当前蜡烛上或在蜡烛收盘时。 在两种情况下,如果下一根蜡烛已经打开,则不会重新绘制前一根蜡烛上的箭头。
还可以手动更改需要为所需工具配置的参数。
“ Channel Width ” - 用于确定趋势的通道宽度,在较低时间范围内增加,在较高时间范围内增加。
“ Signal Generator ”——调整信号生成的频率,数字越大,信号数量越少。

An indicator that determines the point levels of price resistance. The arrows indicate price bounces in the indicated directions.
Arrows are not redrawn formed on the current candle, shown on the previous candle for convenience.
It has one setting - the formation intensity:
If the parameter is smaller, most of the signals are formed in a wide trend. If the parameter is larger, signals are formed in a narrower trend.
Input parameters
Formation Intensity - Arrow Formation Intensity Number B

Line Breakouts - System for trend trading.
Contains a trend identifier that can be adapted to any chart and trading instrument using the period and smoothing function.
And a determinant of support and resistance levels. When the price is below the resistance line, open Sell trades, and when the price is above support lines - open Buy transactions. Stop loss should be placed a few points from the lines, Take Profit should be fixed after several candles (3-10-15), based on the time frame.
The indi

Arrow indicator with trend filter. Generates trend input without delays or delays - on the emerging candle. Suitable for use on any trading tools and timeframes. Easy to use, contains the direction of the trend in the form of a histogram lines and signal generator.
Input parameters
Period Trend Line - Period of the Histogram Line Signal Generator Period - If the period is longer, then the arrows are less Play sound Display pop-up message Send push notification Send email Sound file signal - Fi

Indicator for manual trading and technical analysis for Forex.
It consists of a trend indicator with the opening level of the trading day and a arrow indicator for determining entry points.
The indicator does not recolor; it works when the candle closes.
Contains several types of alerts for signal arrows.
Can be configured to work on any chart, trading instrument or time frame.
The work strategy is based on searching for price movements along the trend.
To make " Buy " transactions: The tre

A trend indicator showing the strength of bulls and bears in a trading range.
Consists of two lines:
The green line is a balanced overbought/oversold condition. The red line is the direction of trading activity. Does not redraw calculations.
Can be used on all Symbols/Instruments/Time Frames.
Easy to use and set up.
How to use the indicator and what it determines.
The basic rule is to follow the direction of the red line:
if it crosses the green line from the bottom up, the market is dominat
FREE

The "Lines Channel Pro" indicator determines price reversals from the High/Low channel. Contains a built-in trend finder, signal lines, entry and exit points.
The recommended timeframe for M15 to work is D1.
For each timeframe and trading instrument, depending on the volatility, it is necessary to select individual settings.
Does not redraw calculations.
Input parameters
Use Channel trend filter - Turn on/off the trend filter Channel trend period - Trend filter period (from 8 and above) Line

The indicator " ZigZag on Trend " is an assistant in determining the direction of price movement, as well as a calculator of bars and points. It consists of a trend indicator, which follows the price direction by the trend line presented in the form of a zigzag and a counter calculating the number of bars traversed in the direction of the trend and the number of points on the vertical scale. (calculations are carried out by the opening of the bar) The indicator does not redraw. For convenience,

Cluster indicator working in the price channel. For operation, the indicator builds a channel line - (dashed line).
Inside the channel, cluster sections are determined that determine the direction of the price movement - (histograms in two directions),
start with large arrows. Small arrows are plotted above / below each histogram - indicator increase volatility.
The indicator does not redraw the values.
Works on any tools and timeframes. Entrances are made when large arrows appear, inside small

Oscillatory price direction indicator for Forex. It has 2 operating modes - trend and scalping. The trend mode of operation allows you to determine the direction of the market movement in the medium term.
The scalping mode works by determining the price movement in the short term. Consists of a blue line, from which the balance between the directions of the price and signal green / red line.
The green line shows the direction of the price up, and the red line shows the direction of the price dow

Zig-Zag indicator with additional signals for inputs.
Visually easy to use:
The red zig-zag line is an uptrend. The blue zig-zag line is a downward trend. Arrows in the form of additional signals.
Works on any trading pairs. On any timeframe.
Not redrawn.
Input parameters
Zig-Zag Period - Zig-zag period (from 5) Signal Period - period of signal arrows (from 3) Alerts for signals
Play sound - Sound alert Display pop-up message - Notification by message on the screen Send push notification

Signal indicator that displays price reversals from the upper and lower corners of the chart.
It is adjusted for different volatility and timeframes by one parameter - Gradation .
Works on any trading pairs. The recommended timeframe for use is from M15 and higher. Not redrawn. If necessary, I will help you choose the optimal setting.
Input parameters
Gradation - from 0 and higher. If the parameter is larger, arrows are displayed at shorter price intervals. Alerts for signals
Play sound - S

A technical indicator that calculates its readings based on trading volumes. It has an oscillatory line that follows the change in volumes.
Large arrows on the line indicate reversal values. A channel is built around the line with small arrows showing the strengthening of price movement in the direction of increasing volumes.
The indicator does not redraw values. Works on any instrument and timeframe. It can complement any trading strategy by finding a trend or make entries in the direction of a
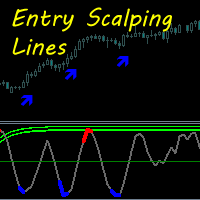
This indicator is based on a trend guide line and a special oscillator, defining entry points at the moments of potential price movement.
The indicator does not redraw. Works on any instrument. The most preferred time frames to use are M5, M15, M30, H1, H4.
The guide trend line of the indicator gives an idea about the movement of the market. When the green line crosses the zero level from top to bottom - the market is bearish when it crosses from bottom to top - bull market. The oscillator is

Developed methods for trading collected in one indicator. In the form of arrows, it defines entries in the direction of the trend.
It has 2 types of arrows - trend and signal guides, informing about the potential movement in the direction of the trend.
Works without redrawing, ready for use on all symbols/tools.
The most suitable time frames to use are M15, M30, H1, H4.
How to use
The indicator finds the direction of the trend in the form of a signal arrow, a graphic rectangle stretches along

Wave Reversal Indicator - determines the direction of trend waves and price reversals.
The indicator shows wave movements and trend directions. It gives recommendations where to follow the trader, helps to follow the trading strategy.
It is an addition to an intraday or medium-term strategy.
Almost all parameters are selected for each time frame and are changed automatically, the only parameter for manual adjustment is the wavelength.
Works on various trading instruments and timeframes, recomme

Max Min Reversal Arrows - an arrow reversal indicator for predicting price movement. The indicator is built on the support and resistance levels at the local lows and highs of the price. Product features
Arrows appear on the current candle. The indicator does not redraw.
Can be used on all time frames and trading instruments. Recommended timeframes to use M30, H1, H4.
The dotted lines are the support and resistance levels within the signal. Price movement from these levels means a reversal.
Pr

Scalping Entry Points - is a manual trading system that can adjust to price movements and give signals to open trades without redrawing. The indicator determines the direction of the trend by the central level of support and resistance. The dot indicator provides signals for entries and exits. Suitable for manual intraday trading, scalping and binary options. Works on all time frames and trading instruments.
The indicator gives several types of alerts.
How to use the product
The blue line det

Indicator of the price channel and breakpoint generator inside it. It gives an idea of the position of the price in relation to the period of use.
It contains smoothed trend bounce lines built along the channel borders and bounce points that determine entry and exit moments.
Works on various trading instruments and time frames.
How to work with the indicator
Follow the channel break line, the blue line is up inputs, the pink line is down inputs.
Entry points are generated on the current candle

Candle Binary Scalper - is a technical analysis product for forex and binary options.
Includes several technical indicators combined into a trading system.
Suitable for manual trading within a trend, for scalping and binary options. Works on all time frames and trading instruments.
Recommended Timeframes for trading M15, M30, H1 and H4, M5 and M1 should be used in case of high volatility. There are several types of alerts.
How to use the product
The optimal settings have already been selected

Binary Lines is a technical analysis indicator for currencies, commodities, cryptocurrencies, stocks, indices and any financial instruments. Can be used for binary options or Forex scalping. Shows entry and exit points at fixed intervals and provides traders the necessary information about the results of possible transactions. Entry points are formed at the very beginning of the candle, in the direction of the MA line, duration
trades in bars can be adjusted manually and adjusted to any financia

A technical indicator that calculates its readings on trading volumes. In the form of a histogram, it shows the accumulation of the strength of the movement of the trading instrument. It has independent calculation systems for bullish and bearish directions. Works on any trading instruments and time frames. Can complement any trading system.
The indicator does not redraw its values, the signals appear on the current candle.
It is easy to use and does not load the chart, does not require addition

Candle Power Signals is a trend indicator that uses a strategy of searching for potential volatile signals to make trading decisions.
By analyzing the market, the indicator identifies zones of increased and decreased volatility within the directional trend movement.
The main signal generation parameters have already been configured, the remaining settings and periods are indexed into 2 parameters for manual configuration:
1. "Candle calculation method" - 2 signal generation modes, it is recomme

Scalping and Binary Signal Detector - Scalping indicator that gives directional signals for opening positions along the trend.
The indicator is a complete trading system that can be used for Forex and binary options.
The system of algorithms allows you to recognize intense price movements in several consecutive bars.
The indicator provides several types of alerts for arrows.
Works on any trading instruments and time frames (M5 or Higher recommended).
How to use for trading
The appearance of a

Level Breakout Indicator is a technical analysis product that works from upper and lower boundaries, which can determine the direction of the trend. Works on candle 0 without redrawing or delays.
In its work, it uses a system of different indicators, the parameters of which have already been configured and combined into a single parameter - “ Scale ”, which performs gradation of periods.
The indicator is easy to use, does not require any calculations, using a single parameter you need to select

Indicator Waiting Volatility - an indicator for determining volatility zones and flat conditions.
Over time, the price on the chart is in different trends, goes down, goes up, or stays the same. The indicator helps the trader determine which trend the price is in.
In its work, it uses several tools for technical analysis; first, the direction of the trend is determined, then, in this direction, the indicator monitors changes in volatility.
If the price fluctuates within the noise, it is in track
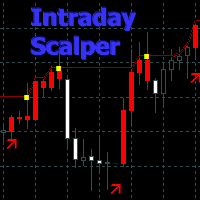
An automatic trend indicator that uses an algorithm to determine impulse signals for scalping and intraday trading.
The trend-following indicator automatically calculates potential entry and exit points for trades.
The indicator contains a trend line and a target channel for following signals, changing color depending on the direction.
Main characteristics
Signal colored candles and arrows: blue - downward direction, red - upward direction. Yellow dots for exiting trades are located along the
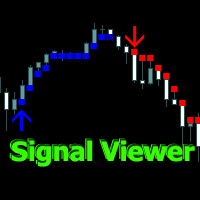
Signal Viewer is a technical analysis indicator for Forex. Consists of arrows and dots following the signal path. It works outside the trend, determines the tops and bottoms on the chart, from which it calculates the beginning of the signal. Uses mathematical transformations of candles to determine the price trajectory and the end of the signal.
Possibilities
The signal arrow is formed when the candle closes; the arrows are not redrawn.
Up and down signals have independent construction formula

The BB Reversal Arrows technical trading system has been developed to predict reverse points for making retail decisions.
The current market situation is analyzed by the indicator and structured for several criteria: the expectation of reversal moments, potential turning points, purchase and sale signals.
The indicator does not contain excess information, has a visual understandable interface, allowing traders to make reasonable decisions.
All arrows appear to close the candle, without redrawin

Indicator for manual trading and technical analysis for Forex.
It consists of a trend indicator with the opening level of the trading day and a arrow indicator for determining entry points.
The indicator does not recolor; it works when the candle closes.
Contains several types of alerts for signal arrows.
Can be configured to work on any chart, trading instrument or time frame.
The work strategy is based on searching for price movements along the trend.
To make " Buy " transactions: The tre
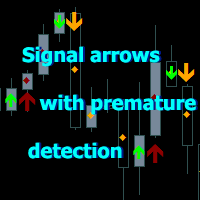
An arrow indicator showing price reversals and following the trend.
The indicator determines price reversals on the chart and is suitable for scalping on TF 1M-5M and day trading on TF 1H and 4H. Buy and sell arrows are displayed on the chart as entry signals. Diamonds are displayed behind the arrows as a continuation of the signal.
They are not repainted and are formed after the candle closes.
Red arrows are buy signals.
Orange arrows are sell signals.
The indicator also contains green prematur
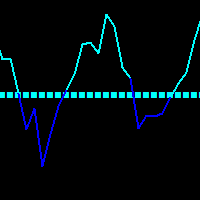
An easy-to-use indicator for various trading systems. Gives early signals in the price direction.
There is a main smoothed trend and a line of change of short-term directions. When using, you can choose the calculation method and smoothing of the main trend, the rest of the parameters are already configured.
Easy to use, you just need to attach it to the chart and follow simple recommendations for trading.
Signal for purchases: blue squares of the main trend + blue signal line is directed upwa

Trading System Double Trend - an independent trading system consisting of several indicators. Determines the direction of the general trend and gives signals in the direction of price movement.
Can be used for scalping, intraday or weekly trading.
Features
Works on any time frames and trading instruments (forex, cryptocurrencies, metals, stocks, indices.) Simple visual reading of information that does not load the chart The indicator does not repaint and does not complete signals Works only wh
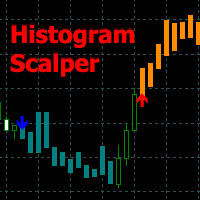
Scalping indicator with a built-in level trend. Finds entry points and follows the entire signal direction.
Adapts to any time frames and trading instruments The indicator does not repaint, works only on closing and opening of the candle. There are several types of alerts for signals
There are three input parameters for setting up the indicator
Signal appearance mode - determines on which candle the signal arrow will appear: If on the current candle, the signal will be early without delay, bu
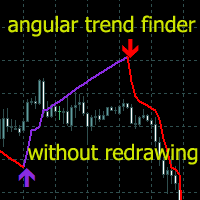
趋势指标是用于金融市场交易的技术分析领域之一。
Angular Trend Lines - 全面确定趋势方向并产生入场信号。除了平滑蜡烛的平均方向
它还利用趋势线的倾斜角度。构建江恩角度的原理被当作倾斜角度的基础。
技术分析指标结合了烛台平滑和图表几何。
趋势线和箭头有两种类型:红线和箭头表示看涨方向。紫线和箭头表示看跌方向。
指示器功能
该指标使用简单、参数配置方便,可用于趋势分析和接收开仓信号。
指示器不会重新绘制,箭头出现在蜡烛的收盘处。
当信号发生时提供多种类型的警报。
可用于任何金融工具(外汇、加密货币、金属、股票、指数)。
该指标可以在任何时间范围和图表上发挥作用。
该指标采用轻量级算法,不加载处理器,确保在多个窗口中使用。
根据时间范围和交易方法选择参数。
主要输入参数
Period - 用于分析计算的蜡烛数量。
Angle ——趋势线的斜率。
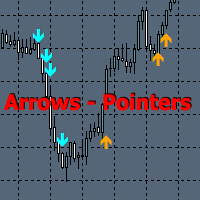
Arrows Pointers - 箭头指标,指示市场活动的方向。显示进行交易的连续入口点。
在趋势模式下工作,和非趋势模式下工作,显示价格方向的早期变化。
该指标基于价格通道算法,当蜡烛的收盘价突破该算法时,就会形成箭头。
100% 指标不会重绘。
指示器不会重新绘制,箭头出现在蜡烛的收盘处。 箭头一旦出现就不会消失,方便根据历史数据制定交易策略。 当信号发生时提供多种类型的警报。 可用于任何时间范围和金融工具(外汇、商品、股票、指数、加密货币、差价合约等) SL 应设置在最后一个箭头的水平,TP 应设置为前一个蜡烛的主体长度。 如果您有自己的趋势指标,则可以使用该指标而不使用内部趋势。
主要输入参数
Arrow generation sensitivity - 该参数决定价格通道突破的敏感度;随着数字的增加,敏感度增加,箭头的数量增加。
Use Trend - 使用趋势来引导箭头。
Trend Period - 趋势周期(如果使用)
时间框架的参数的近似选择,在独立选择参数时可能会有所不同。 M1: Arrow generation sensitivity - 5-
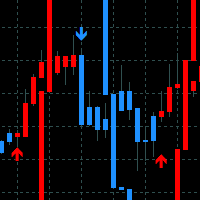
Reversal Bands - 为波动性分析和交易结果应用而设计的指标。提供趋势和逆转早期阶段的价格方向信号。
指示器功能
该指标基于根据波动加速和减速原理利用平滑度构建的速度线。 该线的驱动力是波动性,波动性越大,线条与价格的偏离就越大。 红色箭头、蜡烛和速度线显示向上波动,这与看涨方向一致。 蓝色箭头、蜡烛和速度线显示向下波动,支持看跌方向。 如果趋势方向是长期向上的,并且速度线高于价格,则反转信号通常表明在继续看涨趋势之前会出现修正。 此外,如果趋势方向是长期下降趋势,并且速度线低于价格,则反转信号通常表明在看跌趋势延续之前会出现修正。 为了方便起见,速度线的线条和箭头在图表本身上是重复的。您还可以使用速度线来追踪波动的强度。 适合通过分析任何时间范围内的图表来确定短期和长期市场走势。 输入参数可适应任何市场和时间范围,允许交易者独立定制指标。 有几种类型的通知。 该指标可以作为独立的交易系统使用,也可以作为其他交易系统的补充,用于波动性分析。
输入参数解释
Signal Appearance mode - 当前蜡烛或蜡烛收盘时出现信号。如果当前蜡烛上出现信号,箭头可

Volatility Trend System - a trading system that gives signals for entries. The volatility system gives linear and point signals in the direction of the trend, as well as signals to exit it, without redrawing and delays. The trend indicator monitors the direction of the medium-term trend, shows the direction and its change. The signal indicator is based on changes in volatility and shows market entries.
The indicator is equipped with several types of alerts. Can be applied to various trading ins

Max Min Reversal Arrows MT5 - an arrow reversal indicator for predicting price movement. The indicator is built on the support and resistance levels at the local lows and highs of the price. Product features
Arrows appear on the current candle. The indicator does not redraw.
Can be used on all time frames and trading instruments. Recommended timeframes to use M30, H1, H4.
The dotted lines are the support and resistance levels within the signal. Price movement from these levels means a reversa

Scalping Entry Points - is a manual trading system that can adjust to price movements and give signals to open trades without redrawing. The indicator determines the direction of the trend by the central level of support and resistance. The dot indicator provides signals for entries and exits. Suitable for manual intraday trading, scalping and binary options. Works on all time frames and trading instruments.
The indicator gives several types of alerts.
How to use the product
The blue line det

Scalping and Binary Signal Detector - Scalping indicator that gives directional signals for opening positions along the trend.
The indicator is a complete trading system that can be used for Forex and binary options.
The system of algorithms allows you to recognize intense price movements in several consecutive bars.
The indicator provides several types of alerts for arrows.
Works on any trading instruments and time frames (M5 or Higher recommended).
How to use for trading
The appearance of a

A complex of indicators of recognizing reversal moments. Detects the peaks and hollows according to the combinations of candles after they deduct from two MA. Applicable for trading systems when using early inputs. You can use a trend for scalping and intraday trade, and for detecting a trend in the early stages.
Possibilities
The parameters provide flexible settings for any time floms and trading tools. There are several types of warning for signals. Yellow arrow - Sell signal , pink arrow -
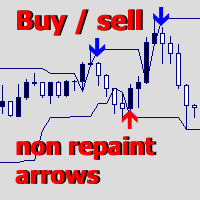
Upper and Lower Reversal - 早期预测反转时刻的系统。允许您在价格变动通道的上限和下限的边界处找到价格转折点。
指示器永远不会重新着色或改变信号箭头的位置。红色箭头是买入信号,蓝色箭头是卖出信号。
适应任何时间范围和交易工具 该指标不会重新绘制,仅在蜡烛收盘时起作用。 信号警报有多种类型 该指标易于使用,只有 2 个外部可配置参数: Channel Length - 调整构建信号的价格通道的长度。 Signal Normalization - 改变信号箭头的质量水平,参数越高 - 错误信号越少(对于 BTC、黄金和高波动性工具,变化几个数量级) Alerts play sound / Alerts display message / Alerts send notification / Send email - 当输入信号箭头出现时使用通知。 Sound for signals - 信号箭头的声音文件。

“ Easy Trend Scalper MT5 ”指标是为趋势方向内的剥头皮交易而设计的。
指标的工作原理。
该指标决定市场走势的方向。
红色大箭头表示看涨方向。
蓝色大箭头-表示看跌方向。
在看涨或看跌趋势中,有一种算法可以以小箭头的形式生成剥头皮信号。
橙色箭头是购买信号。
蓝色——表示销售。
可以用于任何交易工具和任何时间范围。 当信号出现时提供几种类型的警报,用于改变趋势方向和进入信号。 无需重新绘制,可让您预测 2-5 根蜡烛的价格走向。 箭头形成模式可以手动更改——在当前蜡烛上或在蜡烛收盘时。 在两种情况下,如果下一根蜡烛已经打开,则不会重新绘制前一根蜡烛上的箭头。
还可以手动更改需要为所需工具配置的参数。
“ Channel Width ” - 用于确定趋势的通道宽度,在较低时间范围内增加,在较高时间范围内增加。
“ Signal Generator ”——调整信号生成的频率,数字越大,信号数量越少。
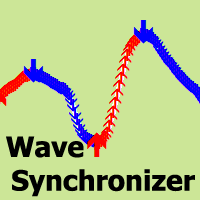
波浪同步器是波浪分析的可视化指标。结合蜡烛图运动序列并构建定向波浪,与市场一起产生同步运动。
每个波浪的开始都以信号箭头开始,还有警报。
该指标永远不会重绘或移动先前历史记录上的箭头。
信号箭头出现在蜡烛图的收盘价。
适用于任何交易工具和时间框架。
易于使用和配置,仅包含 2 个输入参数:选择与所选参数一起使用的时间框架和计算 MA 线的方法。
推荐的参数可以移动 1-2 个周期。
红色箭头方向用于购买交易资产。
蓝色箭头方向用于出售交易资产。 ----------------------------------------------------------------------------------------------
Linear Trend Predictor — 结合切入点和方向支撑线的趋势指标。按照突破高/低价通道的原理运作。该指标算法过滤市场噪音,考虑波动性和市场动态。
指示器功能
使用平滑方法,显示市场趋势和开立买入或卖出订单的切入点。 适合通过分析任何时间范围内的图表来确定短期和长期的市场走势。 输入参数可适应任何市场和时间范围,允许交易者独立定制指标。 设定的指示信号不会消失,也不会重新绘制——它是在蜡烛收盘时确定的。 几种类型的通知以箭头组合。 该指标既可以作为独立的交易系统使用,也可以作为其他交易系统的补充。 可供任何经验水平的交易者使用。
主要参数
Volatility Smoothing Level - 指标的主要参数,允许您配置指标以实现舒适的操作。
它的数字范围是 1 到 100,从而增加了您可以获得更长趋势运动的平滑度。
通过少量的数字,您可以获得短期走势并快速退出交易。
使用指标进行交易的时刻:
红线和箭头表示下降趋势和卖出开盘信号。止损应根据前一个上分形来设置。 黄线和箭头表示上升趋势和买入开盘信号。止损应根据前一个下分形来设置。