• 概述
  • 评论
  • 评论

AI Color Gradient Volume

MT4 平台 AI Color Gradient Volume 指标使用介绍

一、指标概述


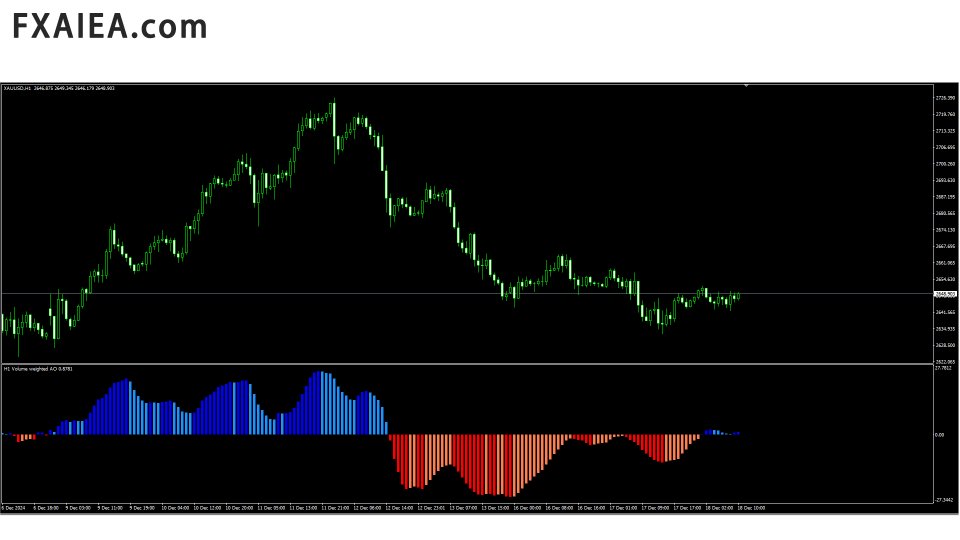
  1. AI Color Gradient Volume 是一款基于人工智能技术,用于 MT4 平台的创新型成交量分析指标。它通过将成交量数据转化为直观的颜色渐变图形,帮助交易者更敏锐地洞察市场中资金的流入流出情况以及买卖力量的强弱对比,从而为交易决策提供有力支持,适用于外汇、股票、期货等各类 MT4 交易市场。

二、安装与设置


  1. 安装步骤:首先,下载 AI Color Gradient Volume 指标文件,通常为.ex4  格式。然后,在 MT4 平台上,点击 “文件” 菜单,选择 “打开数据文件夹”,进入 “MQL4” 文件夹,接着找到 “Indicators” 文件夹,将下载好的指标文件复制粘贴到该文件夹内。关闭并重新打开 MT4 平台,在 “插入” 菜单中选择 “指标”,在自定义指标列表中找到 AI Color Gradient Volume 指标并点击,即可将其添加到图表上。
  2. 参数设置:安装完成后,指标可能会有一些默认参数设置,一般情况下这些默认设置已能满足基本交易需求,但交易者也可以根据自己的交易策略和市场情况进行进一步优化。

三、指标解读

  1. 颜色渐变含义:指标主要通过颜色渐变来反映成交量的变化。一般来说,较浅的颜色(如浅蓝色、淡红色等)代表相对较低的成交量,意味着市场交易活跃度较低,买卖力量相对平衡或较弱;而随着颜色逐渐加深(如深蓝色、深红色等),表示成交量不断增大,这可能暗示市场情绪正在发生变化,买卖力量对比开始失衡,有更多的资金流入市场推动价格变动。例如,在外汇市场中,如果欧元 / 美元货币对的图表上,AI Color Gradient Volume 指标的颜色从淡红色逐渐转变为深蓝色,这可能预示着该货币对的交易活跃度大幅提升,反之下跌。市场关注度增加,可能即将出现较大的价格波动,交易者需要密切关注价格走势和其他技术指标的变化,以寻找合适的交易机会。
  2. 与价格走势的配合:观察指标的颜色渐变与价格走势的关系是使用该指标的关键。当价格上涨时,如果成交量的颜色也同步变深,即成交量随着价格上升而放大,这通常是一个积极的信号,表明市场多头力量较强,上涨趋势可能具有一定的持续性,交易者可以考虑顺势做多或继续持有多头头寸;反之,若价格上涨但成交量颜色变浅甚至保持在较低水平,这可能暗示上涨动力不足,市场可能即将面临回调或反转,此时交易者应保持谨慎,考虑适当减仓或设置紧密的止损位。同样,在价格下跌过程中,成交量颜色的变化也能为判断下跌趋势的可靠性提供参考。如果价格下跌伴随着成交量颜色的加深,说明空头力量占优,下跌趋势可能延续;若价格下跌但成交量没有明显增加,可能意味着下跌趋势并不稳固,市场可能随时出现反弹。

四、交易信号与策略


  1. 趋势判断与跟随:根据指标的颜色渐变趋势,交易者可以判断市场的整体趋势方向。如果在一段时间内,成交量颜色持续保持在较深的区域,且价格呈现出明显的上升或下降趋势,这表明市场处于较强的单边趋势中。此时,交易者可以采用趋势跟随策略,在趋势确认后,沿着趋势方向进行交易,即当颜色持续加深且价格上涨时逢低买入,当颜色持续加深且价格下跌时逢高做空,并根据指标颜色的变化情况和价格的波动节奏合理设置止损和止盈位,以获取趋势行情带来的利润。
  2. 反转信号识别:当指标的颜色渐变出现明显的反转迹象时,例如从深色快速转变为浅色,或者从持续的浅色突然开始变深,这可能预示着市场趋势即将发生反转。特别是当这种颜色反转与价格走势出现背离时,反转信号的可靠性更高。例如,价格不断创出新高,但成交量的颜色却逐渐变浅,形成顶背离形态,这可能是市场顶部即将形成的信号,交易者可以考虑逐步平掉多头头寸,并在合适的时机建立空头头寸;反之,当价格不断创出新低,但成交量颜色开始变深,形成底背离形态时,可能是市场底部的信号,交易者可以寻找机会逢低买入。
  3. 震荡市场策略:在市场处于震荡区间时,指标的颜色通常会在一个相对狭窄的范围内波动,且没有明显的持续变深或变浅趋势。此时,交易者可以采用区间交易策略,在震荡区间的上下边界附近进行高抛低吸操作。当价格接近震荡区间上边界且成交量颜色没有明显放大时,可以考虑卖出;当价格接近震荡区间下边界且成交量颜色也没有明显变化时,可以考虑买入。同时,要密切关注指标颜色的突然变化,一旦出现颜色突破震荡区间的迹象,可能预示着市场将突破震荡格局,进入新的趋势行情,此时需要及时调整交易策略,跟随新的趋势方向进行交易。

五、优势与局限性


  1. 优势
    • 直观的可视化效果:通过颜色渐变将成交量数据直观地展示在图表上,使交易者能够迅速、直观地了解市场的资金动态和交易活跃度,无需复杂的数据分析即可快速把握市场情绪的变化,大大提高了交易决策的效率。
    • 智能算法适应性强:指标基于人工智能算法,能够自动适应不同市场条件和交易品种的成交量变化特征,无论是在流动性高的主流市场还是流动性相对较低的小众市场,都能准确地反映成交量的真实情况,并及时发出有效的交易信号,减少了交易者因市场变化而需要频繁调整指标参数的麻烦。
    • 综合分析能力:将成交量分析与颜色渐变的视觉效果相结合,使交易者能够更全面地分析市场信息,不仅仅关注成交量的数值大小,还能从颜色的变化趋势中获取更多关于市场买卖力量对比和趋势演变的线索,从而制定出更精准、更具前瞻性的交易策略。
  2. 局限性
    • 虚假信号风险:尽管指标采用了智能算法,但在市场出现异常波动或受到突发重大事件影响时,仍然可能会产生一些虚假的信号。例如,在突发的地缘政治事件导致市场瞬间恐慌性抛售或抢购时,成交量可能会急剧放大,指标的颜色也会迅速变深,但这种情况可能只是短期的市场异常反应,并不一定代表市场趋势的真正改变,如果交易者盲目根据这些信号进行交易,可能会遭受损失。
    • 对成交量数据的依赖:该指标的有效性在很大程度上依赖于准确的成交量数据。然而,在一些市场中,成交量数据可能存在一定的误差或不完整,特别是在外汇市场的场外交易(OTC)中,成交量数据的统计相对不如股票市场等集中交易市场精确。此外,一些交易平台可能会对成交量数据进行平滑处理或存在数据延迟等问题,这些因素都可能影响指标的准确性和可靠性,导致交易者做出错误的交易决策。

推荐产品
BoxProfile MT4
Evgeny Shevtsov
4.92 (12)
The indicator displays volume profiles based on the nesting principle. Profiles periods are pre-set so that each subsequent profile has a length twice as long as the length of the previous profile. In addition to profiles, the indicator displays volume clusters sorted by color, depending on the volume they contain. Indicator operation features The indicator works on typical timeframes from M5 to MN, but for calculations uses historical data from smaller timeframes: M1 - for timeframes from M5
FREE
该指标基于离散哈特利变换。使用此转换允许您在处理金融时间序列时应用不同的方法。该指标的一个显着特点是它的读数不是指图表上的一个点,而是指指标周期的所有点。 处理时间序列时,指标允许您选择时间序列的各种元素。过滤的第一种可能性是建立在这种方法上的——所有不必要的高频分量都被简单地丢弃。第一个图展示了这种方法的可能性,选择CutOff参数,可以选择原始时间序列的细节(红线-只剩下主要信息CutOff = 0,黄色-主要和最低频率周期CutOff = 1 , 蓝色 - 所有最高频的噪声都被丢弃 CutOff = 4 )。然而,这不是唯一的可能性——噪声分量可以通过额外的过滤来抑制。 这两个选项都在该指标中实施。它的参数是: iPeriod - 指标周期 Shift - 指标相对于当前柱的偏移。通过更改此参数,您可以评估指标过去的表现。 NoiseReduction 是一种降低噪音的方法。可能的值:none - 不抑制噪声(在这种情况下只有 CutOff 参数起作用),constant - 噪声通过常数衰减,linear - 线性噪声抑制,对数 - 对数衰减,square - 根据平方根进行
Zig Zag reading structure
Maria Cristina Sabatini
'Zig Zag Percentage strenght'   This indicator is awesome. Why? It's able to show the percentage of the last leg, compared with the previous leg. In this way you have a better understanding of the forces in play in that moment.   In fact, for example, if you see that the up extensions are, in percentage, greater of the down legs, that means that there is more bullish pressure or maybe the market is starting to reverse from downtrend to uptrend.   Hope you will ind it useful !
Moving VVC mt4
Andriy Sydoruk
The   Visual Volatility Clustering   indicator clusters the market based on volatility. The indicator does not redraw and gives accurate data, does not use closing prices. Uses the opening prices or the highs or lows of the previous completed bar. Therefore, all information will be clear and unambiguous. The essence of the indicator is to divide the price market into certain areas according to a similar type of volatility. This can be done in any way. In this example, the indicator is configure
Power Bears Rich
Pham Trong Khanh
Everyday trading represents a battle of buyers ("Bulls") pushing prices up and sellers ("Bears") pushing prices down. Depending on what party scores off, the day will end with a price that is higher or lower than that of the previous day. Intermediate results, first of all the highest and lowest price, allow to judge about how the battle was developing during the day. It is very important to be able to estimate the Bears Power balance since changes in this balance initially signalize about possi
DracoAI
Hua Manh Hung
DracoAI is a revolutionary automated forex trading robot based on neural network.  Loss coverage is our premium exclusive feature. DracoAI IS: THE BEST MONEY MAKING SERVICE & STABLE PASSIVE INCOME PROFIT, EVEN IF YOU DO NOT PARTICIPATE IN BIDDING FINANCIAL INDEPENDENCE AND STABILITY DracoAI IS SAFE, BECAUSE: WE GUARANTEE THE SAFETY OF YOUR FUNDS NEGATIVE RESULTS OF TRADING ARE COVERED BY OUR RESERVE FUND 100% CONFIDENTIALITY Monitoring  - most popular signal at MQL5 :  https://www.mql5.com/en/
Market Profile 3
Hussien Abdeltwab Hussien Ryad
3 (2)
Market Profile 3 MetaTrader 4 indicator  — is a classic Market Profile implementation that can show the price density over time, outlining the most important price levels, value area, and control value of a given trading session. This indicator can be attached to timeframes between M1 and D1 and will show the Market Profile for daily, weekly, monthly, or even intraday sessions. Lower timeframes offer higher precision. Higher timeframes are recommended for better visibility. It is also possible t
FREE
The indicator allows you to trade binary options. The recommended time frame is М1 and the expiration time is 1,2,3 minutes. The indicator suitable for auto and manual trading. A possible signal is specified as a arrows above/under a candle. You should wait until the candle closes! Arrows are not re-painted Trade sessions: TOKYO section (Half-end) Currency pairs: USD/JPY Working time frame: M1 Expiration time: 1,2,3 minutes. The indicator also shows good results when using the martingale strateg
FREE
TPO Profile MT4
Kyra Nickaline Watson-gordon
5 (1)
Definition : TPO is a Time Price Opportunity. Instead of using bars or candles with an Open, High, Low, and Close price, each "bar" in a Market Profile is represented by horizontal bars against the price It is called Market Profile terminology. In other words time-price-opportunity (TPO) profiles are histograms of how much time was spent at each price within the span of the profile. By using a TPO chart, you are able to analyze the amount of trading activity, based on time, for each price lev
Effect Volume
Ivan Simonika
Volume indicator Effect Volume , in the Forex market volumes are unique (tick). This volume indicator demonstrates the level of financial and emotional involvement. When the indicator forms a new top, it indicates that buyers are stronger than sellers over a certain period of time. If the indicator decreases, this indicates that the bears are stronger. Why is it impossible to track normal volumes in Forex? The fact is that this is an over-the-counter market. Consequently, it is practically im
Blahtech Supply Demand
Blahtech Limited
4.61 (33)
Was: $299  Now: $99   Supply Demand uses previous price action to identify potential imbalances between buyers and sellers. The key is to identify the better odds zones, not just the untouched ones. Blahtech Supply Demand indicator delivers functionality previously unavailable on any trading platform. This 4-in-1 indicator not only highlights the higher probability zones using a multi-criteria strength engine, but also combines it with multi-timeframe trend analysis, previously confirmed swings
This indicator prepared by using 311,1298 days Haskaya Trend Bandse and Calculates the strand ADX.    This system can be used for 5M time frame.     This system is for Long term and profitable.    Signals are shown as arrows. as an optional,    you can set a voice alarm or email notification    You can fins our other products from link : https://www.mql5.com/en/users/drbastem/seller    Also, you can ask all your questins from email : haskayafx@gmail.com or mobile : +90 530 867 5076 or @Meh
Volume by Price MT4
Brian Collard
4.6 (10)
The Volume by Price Indicator for MetaTrader 4 features Volume Profile and Market Profile TPO (Time Price Opportunity). Volume and TPO histogram bar and line charts. Volume Footprint charts. TPO letter and block marker collapsed and split structure charts. Static, dynamic and flexible range segmentation and compositing methods with relative and absolute visualizations. Session hours filtering and segment concatenation with Market Watch and custom user specifications. Graphical layering, positio
Reverse side scalper is the manual trading system, that works on choppy(anti-trend) market. As a rule markets are on 80% choppy and only 20% is trend phase. System is based on custom step Moving and RSI and reverse pattern. System defines up movement, down movement, trend / choppy phases. Indicator plots Buy signal arrow when current direction is down and phase is trend, Sell signal arrow is plotted when currently is up movement and phase is trend. As a rule it allows to "catch" local maximum/mi
Volume Delta Panel
Chantal Sala
4.8 (10)
Volume DeltaPanel is a very powerful indicator that read the supply on Market. It calculates the Delta from movement of the price and the difference of BUY volumes and SELL volumes. The Volumes are added to price and normalized to symbol points. Its special structure allows you to get all Time Frames values available on the platform MT4. Panel can show 28 instruments simultaneously all customizable according to the offer of the Broker. A good observation of this instrument can suggest great en
Ska ZigZag BuySell
NKATEKO VUKOSI LEROY MASANGO
Ska ZigZag BuySell indicator determines the overbought and oversold regions within a trend. The indicator determines the overbought region by the candlestick high and the oversold region by the candlestick low. This indicator only gives signals with arrow and audible alerts each and every time when a new candlestick appear. To utilize the full strategy i recommend using "Ska ZigZag BuySell" together with "Ska ZigZag Line". The Ska ZigZag Line indicator is available for free. NOTE: Indicator is h
Night ghost
Dmitriy Kashevich
Night Ghost - Arrow indicator for binary options. This is a reliable assistant to you in the future! - No redrawing on the chart -Works great on EUR/USD currency pairs! -Indicator accuracy up to 90% (Especially at night) -No long setup required (Perfectly set up for Binary Options) - Not late signals - The appearance of a signal on the current candle -Perfect for M1 period (No More!) - Eye-friendly candle color (Red and Blue) -Installed Alert Working with it: - Blue arrow
Scorpion Scalper Pro
Mohamed Amine Talbi
In the age of speed, everyone wants to gets what he/she wants quickly. Trading is all about gaining money, and scalping is a way of doing it in a short time. The "Scorpion Scalper Pro" has been named on the scorpion because of its speed. The indicator serves to provide signals for the M15 timeframe. It also sends Alerts (window alert, email alert, push notification alert) whenever a buy/sell signal occurs, and the alerts are customizable (they can be turned ON or OFF). Indicator inputs : - Buy
This indicator is meant for Harmonic Traders, it helps them in identifying the formed patterns by analyzing the market past data, looking for Harmonic Patterns. The Patterns that this indicator can detect are: AB=CD Butterfly Gartely Crab Bat The indicator shows the following: The completed pattern, with the critical zone highlighted in Gray box The suggested 3 take profit levels (in green) The Suggested Stop Loss level (in Red) The formed pattern ratios can be checked by hovering the mouse on t
Adjustable Consecutive Fractals  looks for 2 or more fractals in one direction and sends out a on screen alert, sound alert and push notification, for strong reversal points . Adjustable Consecutive Fractals, shows the fractals on chart along with a color changing text for buy and sell signals when one or more fractals appear on one side of price. Adjustable Consecutive Fractals is based Bill Williams Fractals . The standard Bill Williams fractals are set at a non adjustable 5 bars, BUT withe
The indicator allows you to trade binary options. The recommended time frame is М1 and the expiration time is 1 minutes. The indicator suitable for auto and manual trading. A possible signal is specified as a arrows above/under a candle. You should wait until the candle closes! Arrows are not re-painted Trade sessions: London and New York section Currency pairs: AUD/CAD Working time frame: M1 Expiration time: 1 minute The indicator also shows good results when using the martingale strategy - "Ma
FREE
Last & Ultimate Indictor a trader would ever need while trading.        Confirmation Based  Harmonic Patterns for Trend Reversal Identification .        Ultra finetuned Candle Based Market structure(not pivot or average based like other noisy indicators) for a sniper & confirmational Entry      Added false breakout entry for dual parameter low risk entry This is the finest structure marking you will ever find in any market. indicator is coded based on actual candle breaks and not coded b
Force Directional
Jan Carlos Pagano
力向指标 力向技术指标的基础是将一组元素组合在一起,这些元素可用于帮助交易员衡量价格运动的相对强度,并同时识别和跟踪趋势的方向性。 该指标由一个慢速振荡器(黑线)、一个快速振荡器(灰线)和一个具有降低值的指数中线组成,该中线充当信号线(蓝线),识别运动的逆转并充当方向指南。该指标的振荡器在100值的上方或下方移动,比较最后一个价格的收盘价与先前的收盘价,无论时间视野如何。 该指标在识别趋势逆转方面特别有效,可以成功地应用于任何时间框架。然而,建议在更长的时间框架上使用它,以更准确地评估运动或趋势的强度,以做出更明智的决策。 如何使用: 建议的策略是当慢速振荡器向上穿过信号线,值小于100时,做多,当其向下穿过信号线,值大于100时,做空。值的扩展越大,入场效果越好。只要慢速振荡器在信号线上方,就保持多头仓位,只要慢速振荡器在信号线下方,就保持空头仓位。 关键模式: 泡沫: 往往预示着趋势逆转或突显仓位卸载。当快速振荡器向上穿过慢速振荡器(预示上升趋势)或向下穿过慢速振荡器(预示下降趋势)时形成。泡沫是趋势强度和即将结束的宝贵指标。 分歧: 当力向指标与价格运动
Extremum Reverse Bar
Yurij Izyumov
2.8 (5)
This indicator has been created for finding the probable reversal points of the symbol price. A small candlestick reversal pattern is used it its operation in conjunction with a filter of extremums. The indicator is not redrawn! If the extremum filter is disabled, the indicator shows all points that have a pattern. If the extremum filter is enabled, the condition works – if the history Previous bars 1 candles back contains higher candles and they are farther than the Previous bars 2 candle, such
FREE
Stable Pulse
Ivan Simonika
The work of the Stable Pulse bot is displayed in the form of several key mmoments, which can be seen in the screenshots. This development is a scalping system. You can download and test the bot for free this way by yourself making sure of its capabilities. The bot can be tested on different currency pairs and different periods. The main thing is to set the tester settings as shown in the screenshot, for correct testing. You need to trade on timeframes M1-M15. Expert Advisor is designed to trade
ABCD Harmonic Patterns
Mehmet Ozhan Hastaoglu
Thanks to this indicator, you can easily see the new ABCD harmonic patterns in the chart. If the two price action lengths are equal, the system will give you a signal when it reaches the specified level. You can set the limits as you wish. For example, You can get the signal of the price, which occurs in the Fibonaci 38.2 and 88.6 retracements, and then moves for the same length, at the level you specify. For example, it will alarm you when the price reaches 80% as a percentage. In vertic
VWap Bands EForex
Veridiana Adorno Kendrick
VWAP Bands Metatrader 4 Forex Indicator The VWAP Bands Metatrader 4 Forex indicator is a quite similar to the Bollinger bands, but it deploys volume weighted average as the core value of the bands. There is an option of using the tick volume or real volume for calculation when using the VWAP Bands Metatrader 5 custom forex indicator, especially when the forex broker displays symbol alongside real volume. Similarly, you can decide to have deviations calculated with the sample correction or not
Multi Timeframe ZigZag Indicator
Salman A A A T Bakhash
5 (2)
Description: This indicator draw ZigZag Line in multiple time frame also search for Harmonic patterns before completion of the pattern. Features: Five instances of ZigZag indicators can be configured to any desired timeframe and inputs. Draw Harmonic pattern before pattern completion. Display Fibonacci retracement ratios. Configurable Fibonacci retracement ratios. Draw AB=CD based on Fibonacci retracement you define. You can define margin of error allowed in Harmonic or Fibonacci calculatio
FREE
Dear traders I am happy to introduce to you my new tool called "Brilliant Oscillator" Indicator. This is one of the indicators that can be used as a stand alone indicator. WHAT I LIKE ABOUT THIS TOOL IS Fast and reliable signals Purpose The purpose of this tool is to assist both newbie and Advanced traders to analyze the market with high level of accuracy in both bearish and bullish market trends. The inputs In the input section you will be able to change colors of the indicator only. Currency p
The Trend Professor is a moving average based indicator designed for the purpose of helping the community of traders to analyse the price trend. The indicator will be displayed in the main chart as it is indicated on the screenshot section. How it works The indicator has lines of moving averages and colored histograms to depict the direction of the trend. There will be a fast signal line colored blue/yellow/red at some points. The red/yellow colored lines stands for bearish trend/signal while th
该产品的买家也购买
Oni Scalper
Goh Cheng Wai
5 (2)
Dear Onis, This Indicator is used for   GBPUSD, US30 and GOLD on 1-Min Chart . For US30 , Depending on your broker, Minimum Lot Size will differ from 0.01 to 1.0 lots. My Current Account is trading at 1.0 lots at $1 per point . Please check with your Broker what's the Margin Required for your Minimum lot sizes before you trade on your Real account. I have Forward Tested the indicator for around 6 months before releasing it to the public. ( No Demo is available for the Indicator, Strategy
这是最赚钱的指标。它的表现非常出色。无论市场上有什么兴趣,你都能看到。 几乎在所有情况下,它都只会给你一个长期的市场观点,但不要被愚弄,以为它是受事件约束的。不是这样的。它能找到市场上最大的利益所在,并将其展示给你。别忘了,最大的资金(利益)每天都不会在市场上出现。这是您没有遇到过的情况。月租金可能会给您一到两个信号,仅此而已。但当我们谈论大资金时,他们就是这样行事的。 如果您想了解更多,请点击这里。 这是最赚钱的指标。它的表现非常出色。无论市场上有什么兴趣,你都能看到。 几乎在所有情况下,它都只会给你一个长期的市场观点,但不要被愚弄,以为它是受事件约束的。不是这样的。它能找到市场上最大的利益所在,并将其展示给你。别忘了,最大的资金(利益)每天都不会在市场上出现。这是您没有遇到过的情况。月租金可能会给您一到两个信号,仅此而已。但当我们谈论大资金时,他们就是这样行事的。 如果您想了解更多,请点击这里。
訂閱指標注意事項 此信號只支援電腦版MT4 不支援MT5、手機、平板 指標只顯示當日進場箭頭 非直播指標顯示歷史箭頭 (直播為展示用) 指標為交易輔助性質 非EA自動交易 無跟單功能 指標只標示進場位置 無出場(止盈)指示 進場止損點位設定30-50 PIPS 或是前高前低做為防守 止損不需拉太遠 紅色箭頭為多方進場訊號 綠色箭頭為空方進場訊號 撐阻力強度用箭頭大小表示 此指標適用於波段策略 不適合當沖策略盤整 多空反轉時不適用 指標載入後 右下角都會預設顯示盤整 載入指標一小時後 才會顯示多空 加入Youtube頻道會員 可參加每個月一次實體抽獎活動(台灣以外地區,獎品折現金用Paypal匯出) 每月抽獎時間為非農數據公布當週的週末盤勢分析(2100) 得獎者必須抽獎時在線上,逾期不候
Automatic, live & interactive picture of all trendlines. Assign push, email and sound alerts to the lines of your choice and be informed about price rollback, breakout, rollback after breakout, number of rollbacks, line expiration by double breakout. Correct, drag or delete the lines and interactively tune the line system. https://youtu.be/EJUo9pYiHFA . Chart examples https: //www.mql5.com/en/users/efficientforex Price Interaction Events All events are effective immediately and only after on
The indicator displays the probable ( Support and resistance ) levels. The indicator draws horizontal and trend levels of support and resistance. The indicator settings: Trends - the mode for displaying trend lines or horizontal lines of support and resistance Yes - display trend lines only No - display horizontal lines only UseResource - use the resources built into the indicator. Yes - use the ZigZag indicator from the resources of the product. No - use a custom ZigZag indicator. HistoryBar -
The indicator of a Professional Trader is an arrow indicator for predicting the direction of price movement. I have been working on this indicator since 2014. You can use this indicator as your main indicator, use its entry signals, and use it as your only indicator to find entry points. About the product: Recommended TF [H4-D1-W1]   . The indicator predicts the direction of the next candle. Fits a variety of tools; Flexibility in settings for different instruments and intervals through the
THE GRAFF III
Antonin Skaryd
The [GRAFF] III manual trading system is based on multiple MetaTrader (MT4) indicators. Together, the entire PACK of GRAFF III indicators makes an advanced trading tool. The system consists of over 20 different custom-built indicators which have been carefully selected and tested in the long term to produce strong and efficient trading signals. The particular indicators are based on different mathematical formulas, so the entire system is calibrated to remove false signals from its own indicator
You can fins our other products from link : https://www.mql5.com/en/users/drbastem/seller   Also, you can ask all your questins from email : haskayafx@gmail.com or mobile : +90 530 867 5076 or @MehmetBastem    on telegram application This indicator is used to determine the trend. Standard Three Moving Average and ADX indicators are used. It has the indicator warning system (audio, e-mail) and three types of alerts, including messages to mobile phone. It shows the best performance on M5. When
This indicator is used to determine the trend. Standard Three Moving Average and ADX indicators are used. It has the indicator warning system (audio, e-mail) and three types of alerts, including messages to mobile phone. It shows the best performance on M5. When the trend value reaches the value set, the warning system is activated. This indicator works only with Forex symbols. Inputs SoundAlarm = true - Sound Alert Sendmail=true - Send an e-mail in case of a buy or sell signal Sendnotificatio
You can fins our other products from link : https://www.mql5.com/en/users/drbastem/seller   Also, you can ask all your questins from email : haskayafx@gmail.com or mobile : +90 530 867 5076 or @MehmetBastem    on telegram application This indicator is used to determine the trend. Standard MACD indicator is used. It has the indicator warning system: beep, e-mail and has three types of alerts, including messages to mobile phone. It shows the best performance on the chart of 5 minutes. When the
A simplistic indicator informing a user on RSI divergence by sending messages to mobile device and email. The indicator draws 2 vertical lines, marking two RSI extrema that formed the divergence. You get the alert, open the charts and make a decision. The indicator does not show past divergences, thus when you attach it to a chart for the first time you see nothing. Graphics and alerts will appear as soon as divergences do. Drop it in Tester to see how it works. Parameters: RSIPeriod - number of
Ticks Size
Viktor Kolmakov
This indicator displays in a separate window the difference between the number of points which increased the price, and the number of points that decreased the price during the time interval specified in the settings. The time interval for calculation is expressed as the number of bars of the chart the indicator is attached to. This approach allows you to evaluate the movement direction (growth or fall) of the instrument's price, the strength of the movement and the size of the movement in point
NostradamusMT4
Andrey Spiridonov
1 (1)
NostradamusMT4 is a powerful indicator from the set of professional trader. The indicator is based on Andrei Spiridonov's original price calculation method (ESTIMATED PRICE) for the current candle price. Advantages The indicator does not redraw. It works on any timeframes. Works with any trading instruments. Perfectly suitable for scalping and trading binary options. Parameters Color - color of the ESTIMATED PRICE FUTURE line. How to work with the indicator The indicator forms the ESTIMATE
BinaryIndicator
Andrey Spiridonov
BinaryIndicator is a highly accurate indicator for trading binary options. It shows excellent results in scalping. This indicator is based in multifactor analysis of trend indicators, as well as confirmation oscillators, which in the end gives an increased accuracy of signals. Advantages of the indicator Increased accuracy of signals. Excellent results when trading binary options with a short expiration time from M30 to M1 . It works on any timeframes. Works with any trade symbols. Parameter
BinaryScalping
Andrey Spiridonov
BinaryScalping is a professional indicator for trading binary options and scalping. The algorithm of the indicator is based on the calculation of pivot points for each time period separately, the location of the price of the trading instrument relative to the pivot points is analyzed and the probability of a trading operation is calculated. The indicator has a built-in filter of trading signals based on the global trend. The indicator is installed in the usual way and works with any trading inst
REX complete 3in1
Christophe Godart
This is the complete REX package. It consists of the lite, pro and ULTRA version.  Perfect for beginners and intermediates. REX complete is 100% non repaint. The strategy is based on a mix of different strategies, statistics, including pivot points, oscillators and patterns.  As the trading idea consists of a variety of some classic indicators like Momentum, Williams Percent Range, CCI, Force Index, WPR, DeMarker, CCI, RSI and Stochastic, it is clear that the fundamental indicators have being
BinaryUniversal
Andrey Spiridonov
BinaryUniversal is a signal indicator for binary options and Forex. In its work, the indicator uses a complex algorithm for generating signals. Before forming a signal, the indicator analyzes volatility, candlestick patterns, important support and resistance levels. The indicator has the ability to adjust the accuracy of the signals, which makes it possible to apply this indicator for both aggressive and conservative trading. The indicator is set in the usual way, it works on any time period and
Sweet Waffle
Christophe Godart
The arrows are calculated with: -     2 Parabolic  parameters -     2 ADX parameters -     4 Stochastic parameters We recommend to combine it with Parabolic, ZigZag or Elliot waves indicator. Always trade the trend! If you make sure to draw your trend lines and support/resistance zones you will just have to wait for the signal to appear. Take the trade. For Binary Options it is advisable to set the expiry time to 5-15 min in M1 chart. THIS INDICATOR IS ZERO REPAINT Best assets to trade: -
Let´s try to make some real money! Call me profit addicted. I thought why not try to make THE dream come reality. With discipline, a clear strategy and this indicator I focus on entering the perfect trades. This indicator is very easy to use as you will get perfect entry points for Put or Call trades. The arrows are calculated with: -     Momentum  parameters -     Candle stick patterns -     Fundamental Price action We recommend to combine it with Parabolic, ZigZag or Elliot waves indic
SystemPro
Andrey Spiridonov
SystemPro - a professional indicator, is a full-fledged, self-sufficient author's strategy for working in the Forex market. A unique algorithm for analyzing the foreign exchange market is based on the calculation of reference points for three different time periods. Thus, the indicator simultaneously analyzes the long-term, medium-term and short-term price behavior before issuing a signal. The indicator is set in the usual way and works with any trade symbols. Advantages of the indicator It i
Pisces TheProfitZone
Nuttawut Khiawkiri
Pisces TheProfitZone "Pisces TheProfitZone MT4 Indicator Powered byFxGangster" This indicator will calculate new support and resistant zone everyday, and that give us a trading zone such as thats telling us TP and SL, So it still telling us for where should the price will go reach? Fore Example. Uptrend : If Price can stay upper a Line and price close higher above a Line, then the price will continue go up to reach next Line. Downtrend : If Price can't pass to stay upper a Line and the pr
Golden Chip
Daishon Cotman
Golden Chip provides Basic Market Structure, Fibonacci, supply and Demand Zones. Letting you identify when a sell off point is approaching or whne a buy opportunity is arriving. The awesome thing about Golden Chip is that, you will see rejection levels or continuation before ANYBODY ! This indicator moves directly with price and lines up perfectly with the Chart. Some indicators would lag but NOT this one ! Golden Chip is amazing for Clean chart (Naked Chart). GOLDEN CHIP IS ONLY ON METATRADER (
WanaScalper MT4
Isaac Wanasolo
1 (1)
A scalping indicator based on mathematical patterns, which on average gives signals with relatively small SL, and also occasionally helps to catch big moves in the markets (more information in the video) This indicator has three main types of notifications: The first type warns of a possible/upcoming signal on the next bar The second type indicates the presence of a ready signal to enter the market/open a position The third type is for SL and TP levels - you will be notified every time price r
Quants Forex Zones
Ferhat Mutlu
5 (1)
購買後請通過MQL5與我聯繫。因此,我們可以確保儀表板在您的平台上正常工作。 嵌套外匯區域旨在獲取一張圖表中的所有關鍵水平,以找到反彈和突破區域。 您可以想像的所有內容都從多個時間範圍提取到一個儀表板中,以發現嵌套的匯合和供應需求區域。 如果儀表板顯示高分,則其對支撐和阻力的清晰識別以及價格可能會得到該區域的反應。請查看更多示例以獲得清晰的理解或給我發送消息 它計算什麼:     支撐阻力     供應需求     整數     分形     博林格     偏差區     超買和超賣區域     動量指標     方向指示器     移動平均線     相對強弱指數     斯托克     每日平均值     每周平均值     月平均值     雙頂     雙底     每日高低     每周高低     每月高低     默里數學水平     樞軸水平和阻力 好處 :     一個屏幕中有 60 個不同的反彈和突破水平     速度和動量指標     長期定向強度 它解決了什麼問題:    
You can fins our other products from link : https://www.mql5.com/en/users/drbastem/seller   Also, you can ask all your questins from email : haskayafx@gmail.com or mobile : +90 530 867 5076 or @MehmetBastem    on telegram application This system created by using Corrected MACD, Different time zone support and resistant points,  Parabolic Sars, Bollinger band, 4 moving average, stochastic oscillator and ADX. In this system, Using parabolic Sars reverse bar count,  Pips difference between clo
This indicator prepared by using 57 days moving averagr and least square method. It can only work for 1 hr time interval. Once a signal created. It is creating order and 2 limit orders. It works in CFD pairs as well as in Forex pairs. You can fins our other products from link : https://www.mql5.com/en/users/drbastem/seller Also, you can ask all your questins from email : haskayafx@gmail.com or mobile : +90 530 867 5076 or @MehmetBastem on telegram application This system is for Long term and pr
This system created by using Corrected MACD,ADX, Different time zone support and resistant points,  Parabolic Sars, Bollinger band, 9 moving average, stochastic oscillator and ADX. In this system, Using parabolic Sars reverse bar count,  Pips difference between closing price and last parabolic Sars in the direction of signal and Trend strength.   Note that this system is not martingale, this system is creating limit order.    Best result for the orders are 25 Pips in USD, 50 Pips in GBP. Best
This system created by using Corrected MACD,ADX, Different time zone support and resistant points,  tree Parabolic Sars,two Bollinger band, 3 moving average, stochastic oscillator and ADX. In this system, Using parabolic Sars reverse bar count,  Pips difference between closing price and last parabolic Sars in the direction of signal and Trend strength.   Note that this system is not martingale, this system is creating limit order.    Best result for the orders are 45 Pips in USD, 75 Pip
This system created by using  Stochastic oscillator and moving average.  Entrance value and take profit values can be seen by system.  This is system for Long term and profitable. this system can be used for 15 minutes time frame. This system is not  repaints.         This system is for Long term and profitable.  Signals are shown as arrows. as an optional,  you can set a voice alarm or email notification  You can fins our other products from link : https://www.mql5.com/en/users/drbastem/seller
This indicator prepared by using 311,1298 days moving average and Calculates the Envelopes.    This system can be used for 5M time frame.     This system is for Long term and profitable.    Signals are shown as arrows. as an optional,    you can set a voice alarm or email notification    You can fins our other products from link : https://www.mql5.com/en/users/drbastem/seller    Also, you can ask all your questins from email : haskayafx@gmail.com or mobile : +90 530 867 5076 or @MehmetBastem   
作者的更多信息
Arbitrage Indicators 是一个专业且易于使用的外汇交易指标,它使用最新AI的套利模型的最佳交易原则。 该指标提供准确的买入和卖出信号。只适用于货币对。 它共有六个不同的指标选项, MACD、KDJ、RSI、CCI、RVI、DEMARK。 可供用户自由切换。 它直观展示了货币对的走向及反转信号,当两线交叉颜色时货币即有很大概率发生反转。 推荐时间框架: 任何时间框架都有效,但我们喜欢使用   M5、 M15、M30 和 H1   也是不错的选择! 推荐交易品种: 我们喜欢使用的最佳交易品种是   M15 时间框架上的 EURUSD 、GBPUSD 、USDJPY、 USDCAD、 AUDUSD 、USDCHF 有问题可联系:QQ:2813871972 微信: FX-AIEA 邮箱:2813871972@qq.com
AI Fibonacci Indicators (非重绘)  是一个专业且易于使用的AI全自动斐波那契生成器外汇交易指标,它使用最新AI的技术自动识别图表准确的斐波那契位置并自动在图表描绘出来。 该指标提供准确的斐波那契重要价格位置和其他高低价位置。适用于任何货币对和其他产品。 它共有七个功能切换,其中五个不同的斐波那契类型("斐波那契回调线", "斐波那契弧线", "斐波那契扇形线", "斐波那契时间区间", "斐波那契扩展线")和一个基于zigzag的填充功能以及一个生成显示(昨日高低价、上周高低价、上个月高低价)功能可供选择或组合。 推荐时间框架: 任何时间框架都有效,但我们喜欢使用   M5、 M15、M30 和 H1   也是不错的选择! 推荐交易品种: 任何品种 我们喜欢使用的最佳交易品种是   M15 时间框架上的XAUUSD、 EURUSD 、GBPUSD 、USDJPY、 USDCAD、 AUDUSD 、USDCHF 有问题可联系:QQ:2813871972 微信: FX-AIEA 邮箱:2813871972@qq.com
本EA通过智能AI程序筛选符合条件的订单,以毫秒级极速按使用者任意条件进行平仓; 帮助交易员快速 平盈利单:平仓该图表品种所有盈利的单,获得利润; 帮助交易员快速 平亏损单:平仓该图表品种所有亏损的单,截断亏损; 帮助交易员快速 SELL平仓:平仓该图表品种所有SELL的单,快速解套锁仓; 帮助交易员快速 BUY平仓:平仓该图表品种所有BUY的单, 快速解套锁仓; 帮助交易员快速 全部平仓:平仓该图表品种所有单,快速落袋为安。 智能快速平仓面板:共五个按钮 平盈利单:平仓该图表品种所有盈利的单 平亏损单:平仓该图表品种所有亏损的单 SELL平仓:平仓该图表品种所有SELL的单 BUY平仓:平仓该图表品种所有BUY的单 全部平仓:平仓该图表品种所有单
自动止盈止损: 该EA使用先进人工智能化程序, 实时跟踪图表订单情况, 精确捕捉有加载EA的图表上的成交订单, 该EA自动按设置的止盈止损给订单添加止盈止损, 大幅节省交易员下单时间,下单后EA自动添加止盈止损 也给忘记设置止盈止损的交易员添加一道保护资金的屏障。 建议: 货币对:货币 时间范围:任何 最低存款:无要求 经纪商时间:GMT +3 账户类型:ECN、Raw 或 Razor,点差极低。 重要的: 使用低点差账户以获得最佳结果非常重要! 规格: 止损SL 止盈TP 魔术号Magic Number 安装非常简单,   不需要对设置进行任何更改,默认设置非常适合大多数使用 GMT+2 和 DST 服务器时间的经纪商。 使用 VPS 让 EA 全天候 (24/7) 工作(强烈推荐) 注意: 不管是手动开仓的订单还是其他EA开启的订单, 该EA只要识别到加载图表的品种有订单, 即会给订单修改新的止盈止损, 所以建议不要同时打开其他EA,以免影响EA正常效果 免责声明: 个人账户盈亏情况,本EA概不负责
本EA主要功能:利用AI快速捕捉订单的价格,批量修改止盈止损到指定的价格位置。例如:你有5个XAUUSD的buy订单,开仓价格分别为2510、2508、2506、2504、2495,你可以通过本EA批量统一修改止盈为2530,止损为2480。祝你交易顺利! 微信:FX-AIEA QQ:2813871972 邮箱:lxy284628@163.com 微信公众号:鑫有金科FXAIEA.com   欢迎关注 (鑫有金科(FXAIEA.com)围绕A1、大数据、云计算区块链等前沿科技,为交易员、投资者和金融机构提供创新解决方案,助其在复杂市场中创造更大价值。资讯:市场动态、技术分析、交易策略和交易心态,技术:MT4/MT5指标、EA和脚本)
江恩理论 江恩理论是金融市场分析中的一种重要工具,它基于市场周期性和自然法则的假设,通过特定的技术分析工具来预测市场走势。江恩理论的主要内容包括: 市场周期 :江恩认为市场存在周期性波动,这些周期可以通过特定的时间周期和价格周期来识别。 价格和时间 :江恩理论强调价格和时间之间的相互作用,认为两者是市场分析的关键要素。 江恩角度线 :这是江恩理论中的一种重要技术分析工具,用于识别市场的支撑和阻力水平。 江恩轮中轮 :又称“江恩圆形图”,是江恩发明的另一种重要技术分析工具,用于预测市场的未来走势。 量化分析 :T3指标可能通过特定的数学模型或算法来量化市场的行为或特征。 趋势识别 :T3指标可能用于识别市场的趋势方向,包括上升趋势、下降趋势或横向整理。 交易信号 :基于T3指标的分析,投资者可能能够获得买入或卖出的交易信号。
TwoLineMACD
Xin You Lin
双线MACD 指标构成 MACD 线(快线) :通常由 12 周期的 EMA 减去 26 周期的 EMA 计算得出,它对价格变化较为敏感,能快速反映近期价格趋势的变化情况,其波动相对频繁,用于捕捉短期市场趋势的动态。 信号线(慢线) :一般是 MACD 线的 9 周期 EMA,它的作用是对 MACD 线进行平滑处理,过滤掉一些短期的噪音和虚假信号,使指标信号更加稳定可靠,能更清晰地展现市场的主要趋势方向。 柱状图(Histogram) :代表 MACD 线与信号线之间的差值。当柱状图位于零轴上方且不断伸长时,表示市场处于多头动能增强状态;反之,在零轴下方且持续变长,则反映空头动能占优。柱状图的长短变化直观地显示了市场买卖力量的对比和变化程度。 安装 安装步骤 :在 MT4 平台上,点击 “文件” 菜单,选择 “打开数据文件夹”。进入 “MQL4” 文件夹,再进入 “Indicators” 文件夹,将下载好的双线 MACD 指标文件(.mq4 或.ex4 格式)复制粘贴到该文件夹内。关闭并重新打开 MT4 平台,在 “插入” 菜单中选择 “指标”,然后在自定义指标列表中找到刚刚安装的双线
AI Supertrend timely alerts MT4 超级趋势及时提醒指标介绍 一、指标概述 MT4 超级趋势及时提醒指标是一款专门为 MetaTrader 4 平台设计的技术分析工具,旨在帮助交易者精准地捕捉市场趋势的变化,并及时发出信号提醒交易者潜在的交易机会。它基于独特AI的算法,综合考虑价格波动、趋势强度以及市场波动性等因素,绘制出直观的趋势线和发出明确的交易信号,无论是新手还是经验丰富的交易者都能从中受益。 二、指标构成与原理 趋势线 :该指标通过对价格数据的深入分析,绘制出一条动态的趋势线,清晰地展示当前市场的主要趋势方向。当趋势线向上倾斜时,表明市场处于上升趋势;反之,当趋势线向下倾斜时,市场处于下降趋势。这条趋势线的计算方法结合了多种技术分析理论,能够有效过滤掉市场的短期噪音,准确反映市场的中期和长期趋势。 信号系统 :超级趋势及时提醒指标配备了一套先进的信号系统,包括买入信号和卖出信号。当市场条件满足特定的趋势反转或延续条件时,指标会在图表上及时弹出信号提示,以箭头、图标或文字等形式明确告知交易者应该采取的交易行动。这些信号的生成基于对价格走势、趋势线突破、
MT4 平台 AI T3 MA Super Fill 指标使用介绍 一、指标概述 AI T3 MA Super Fill 指标是一款融合了先进算法和 T3 移动平均线技术的强大分析工具,旨在为 MT4 平台的交易者提供精准的市场趋势判断和交易信号。它利用智能算法对价格数据进行深度处理,并通过独特的方式展示 T3 移动平均线的变化情况,帮助交易者更有效地把握市场动态,无论是在趋势市场还是震荡市场中,都能辅助交易者做出更明智的交易决策,适用于外汇、股票、期货、贵金属等多种金融交易市场。 二、指标构成与原理 T3 移动平均线组合 :该指标基于 T3 移动平均线构建,通过计算不同周期的 T3 均线,如短线(13 周期)、和长线(20 周期)均线,来反映市场不同时间跨度的趋势。这些均线的交叉、分离和汇聚等情况是判断市场趋势变化的关键要素。T3 均线相较于传统均线,对近期价格数据赋予了更合理的权重,使其能够更灵敏地捕捉价格趋势的变化,同时减少了滞后性带来的影响。 智能填充区域 :指标在均线之间的区域进行智能填充,形成独特的视觉效果。当市场处于多头趋势时,填充区域呈现出蓝色,直观地展示多头趋
MT4CandleTime 指标介绍 MT4CandleTime 是用于 MT4 平台的指标,能以直观数字倒计时形式,显示当前 K 线的剩余时间,方便交易者把握交易节奏。 精准时间把控 :MT4CandleTime 指标为交易者提供了极为精确的 K 线剩余时间数据,使他们能够在交易过程中对时间节奏进行精细管理,避免因时间因素导致交易决策的仓促或延误,从而显著提升交易决策的精准度和计划性。 安装时,下载好.ex4 格式文件,放入 MT4 的 “MQL4/Indicators” 文件夹,重启后在 “插入 - 指标” 里添加。一般无需复杂设置,也可右键点指标选 “属性” 调整显示位置、字体等。 在日内交易、波段交易、重大事件交易等场景中都能发挥作用,帮助交易者更好地决策,精准把握进出时机,提升交易效率和成功率,且适用于不同交易风格。 使用时要注意结合所选的时间框架制定策略,同时考虑市场流动性变化对交易的影响,避免盲目操作。
本EA主要功能:利用AI快速捕捉订单的价格,批量修改止盈止损到指定的价格位置。例如:你有5个XAUUSD的buy订单,开仓价格分别为2510、2508、2506、2504、2495,你可以通过本EA批量统一修改止盈为2530,止损为2480。祝你交易顺利! 微信:FX-AIEA QQ:2813871972 邮箱:lxy284628@163.com 微信公众号:鑫有金科FXAIEA.com   欢迎关注 (鑫有金科(FXAIEA.com)围绕A1、大数据、云计算区块链等前沿科技,为交易员、投资者和金融机构提供创新解决方案,助其在复杂市场中创造更大价值。资讯:市场动态、技术分析、交易策略和交易心态,技术:MT4/MT5指标、EA和脚本)
筛选:
无评论
回复评论