• 概述
  • 评论 (1)
  • 评论 (5)
  • 新特性

VolumeSecret

VolumeSecret:掌握在您手中的成交量力量

在充满挑战的编程世界中,我们不断面对各种障碍,这促使我们成长与进步。我们深刻理解市场带来的困难以及交易者为实现最佳表现所付出的努力。因此,我们不断致力于开发创新的解决方案,使市场决策变得更加顺畅和精确。

VolumeSecret 是这一奉献的成果。这个高级指标结合了成交量分析和复杂的策略,为那些希望掌握市场的人提供了决定性的优势。

🔍 什么是 VolumeSecret?

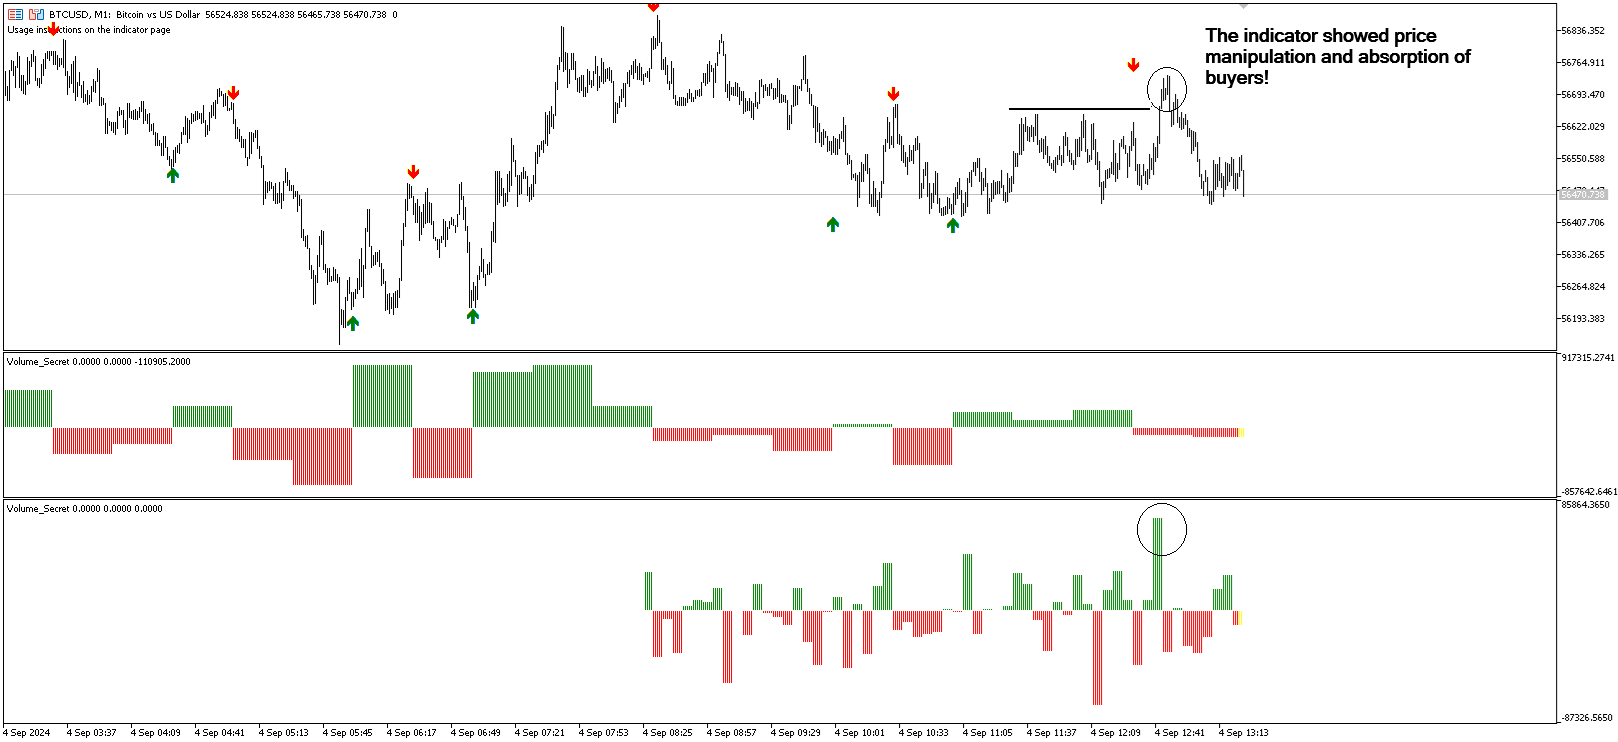
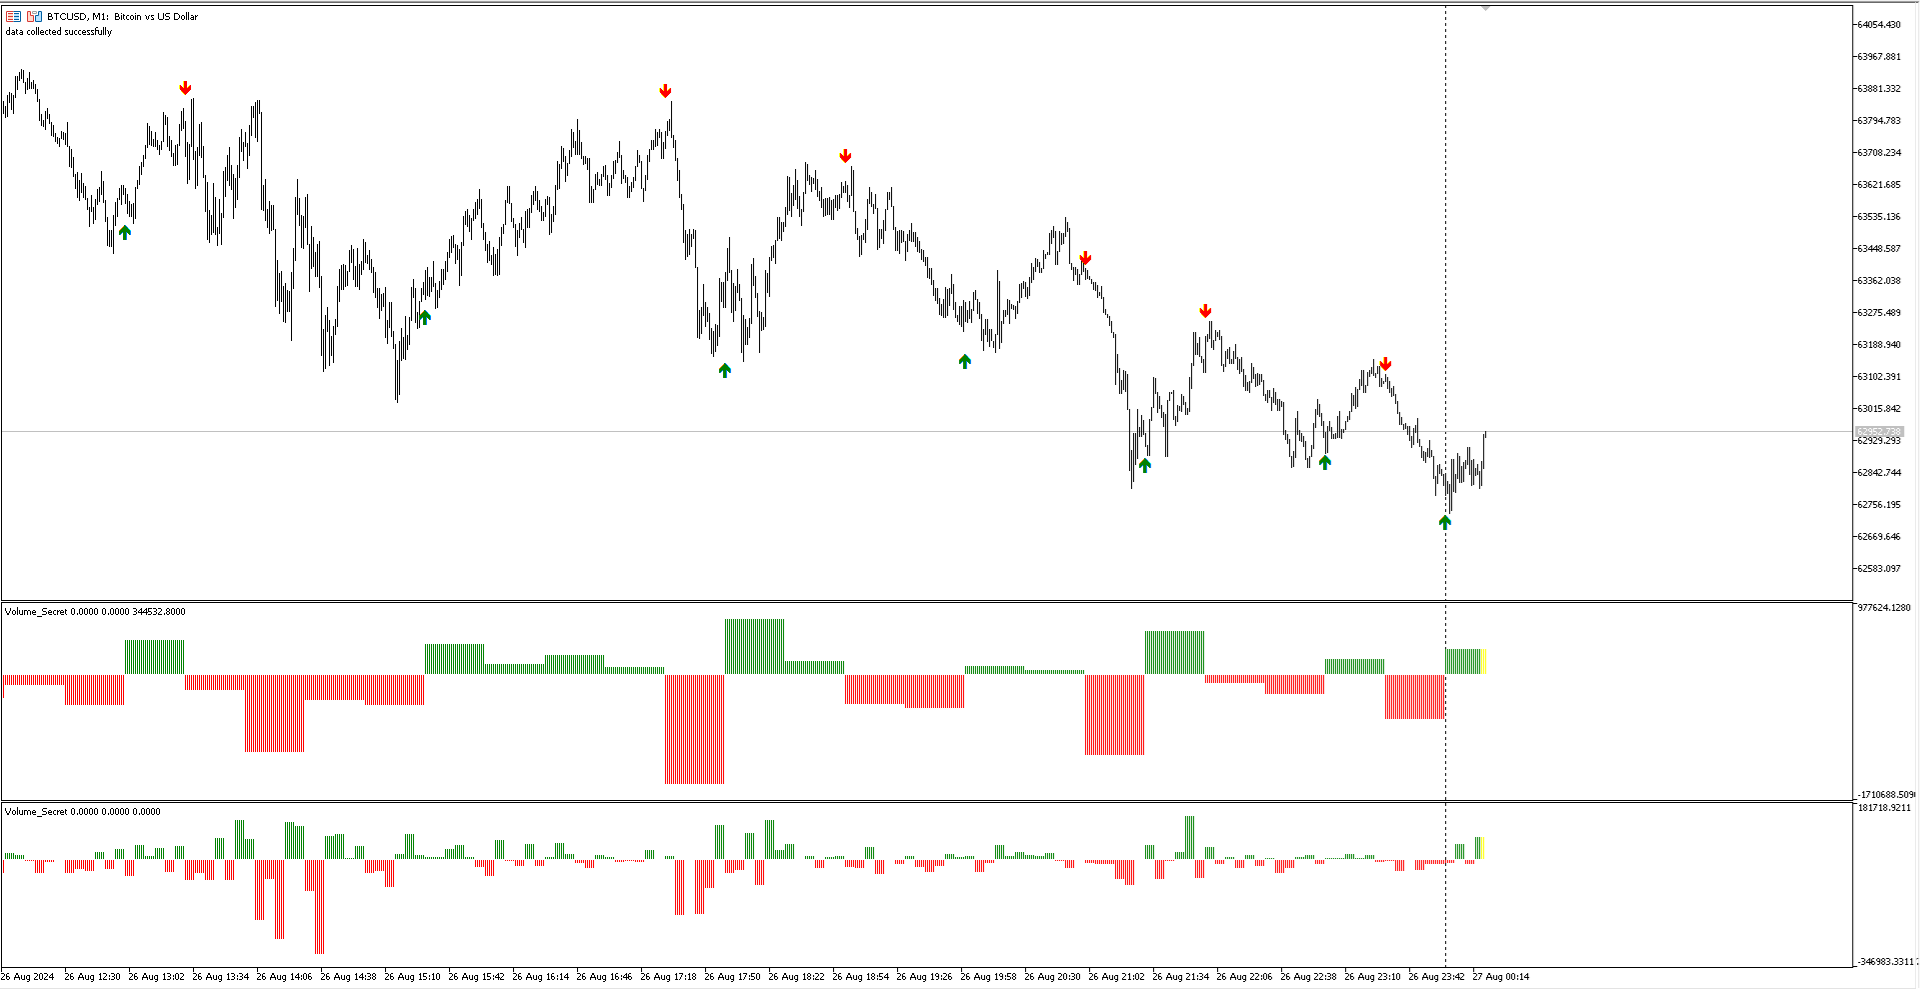
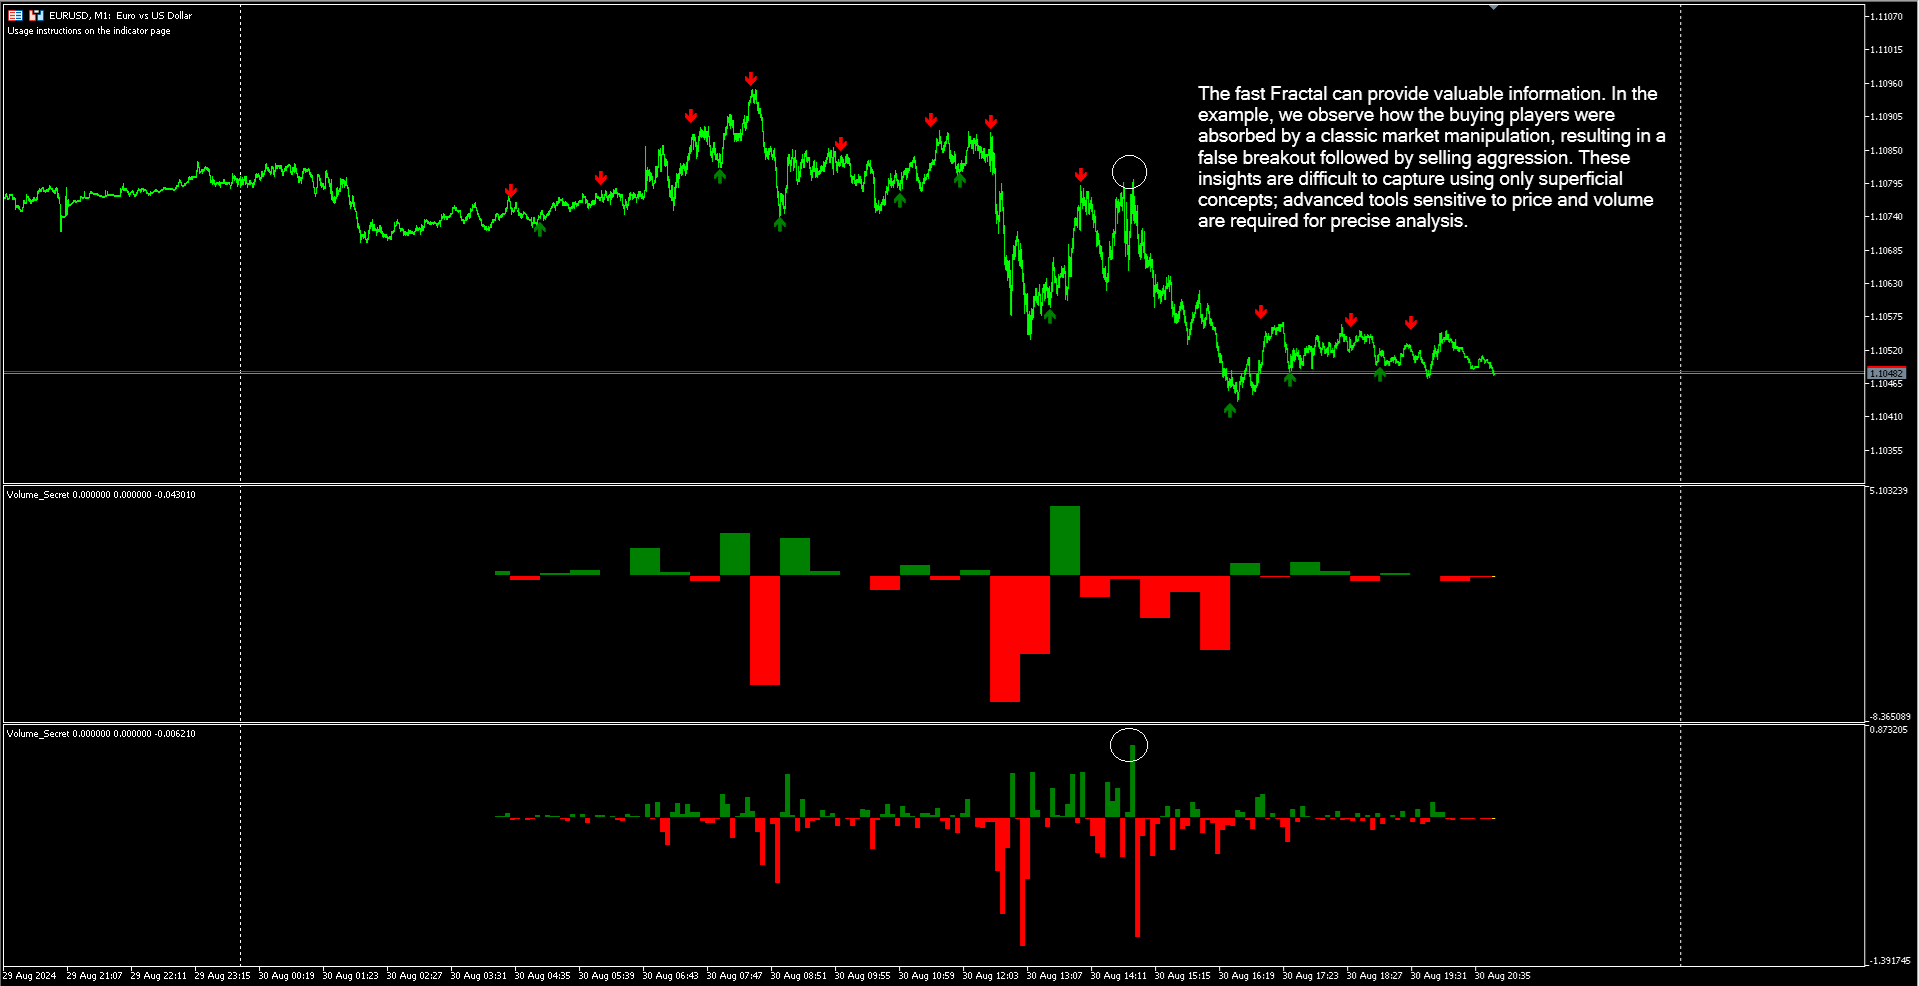
VolumeSecret 是一种尖端的技术指标,旨在揭示隐藏在价格走势背后的秘密。通过使用成交量分析作为指南,它帮助您以高度的精确度识别买入和卖出的机会。它利用分形几何和成交量,提供了对市场动态的深入和详细的解读。

🚀 VolumeSecret 的优势

  • 深入的成交量分析: 识别机构动作和隐藏的市场流动。
  • 精准的信号: 提供清晰客观的提示,优化您的交易。
  • 强大的策略: 将成交量与稳健的方法论结合起来,最大化利润潜力。

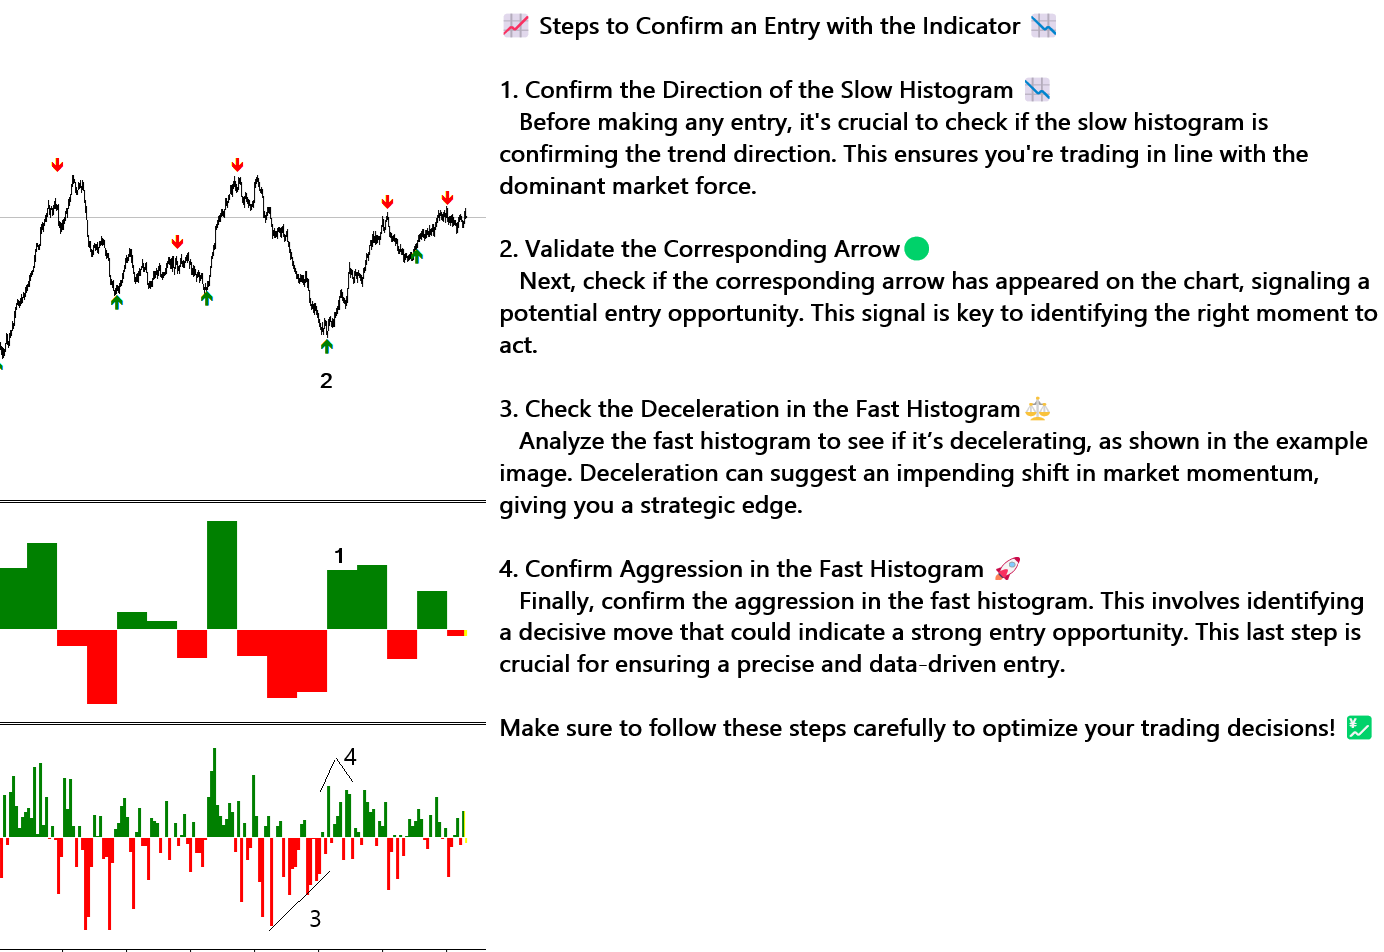
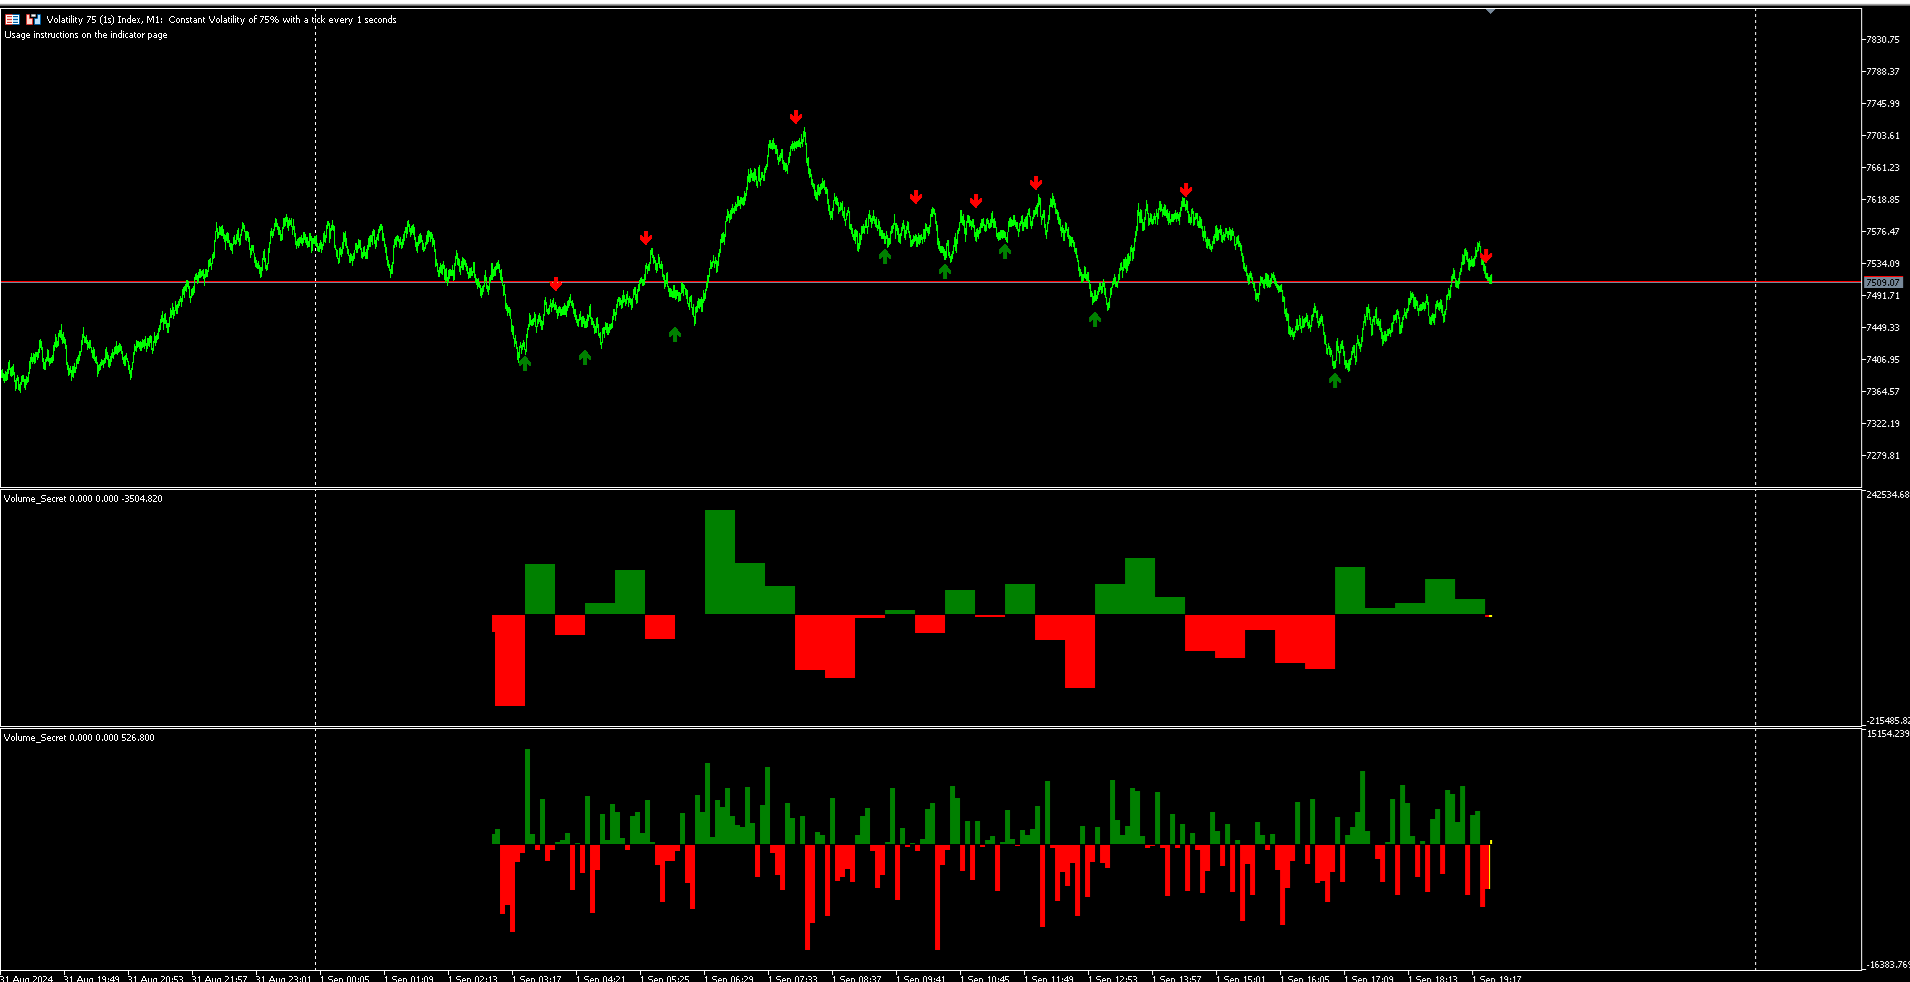
📈 使用 VolumeSecret 确认买入步骤 📉

  1. 确认慢速柱状图的方向 📉
    在进行任何买入之前,请确保慢速柱状图确认了趋势方向。这确保您在与市场主导力量一致的方向上交易。

  2. 验证相应的箭头 🟢
    检查图表上是否出现了相应的箭头,提示可能的买入机会。这个信号对于识别正确的行动时机至关重要。

  3. 检查快速柱状图的减速 ⚖️
    分析快速柱状图,这在较小的时间框架内使用,以识别减速迹象。这个柱状图提前揭示了宏观层面的投射情况,遵循分形原理,给您带来战略优势。

  4. 确认快速柱状图的进攻性 🚀
    最后,确认快速柱状图的进攻性。这涉及识别一个可能表明强劲买入机会的决定性动作。这最后一步对于确保精确、基于数据的买入至关重要。

💰 版本 1.2:现在兼容任何金融工具

在 1.2 版本中,VolumeSecret 已调整为能够分析和操作任何金融工具,包括股票、外汇、加密货币、大宗商品等。此更新增强了该指标的多功能性,允许在不同市场中进行优化分析。

💬 您反馈的重要性

您的反馈对 VolumeSecret 的持续改进至关重要。通过分享您的使用体验,您帮助我们改进和调整指标,以更好地满足交易者的需求。请随时分享您的意见和建议,让我们能够继续提供最好的工具!


推荐产品
Stackable VWAP
Flavio Javier Jarabeck
3.5 (4)
Volume Weighted Average Price (VWAP) is a trading benchmark commonly used by Big Players that gives the average price a Symbol has traded throughout the day. It is based on both Volume and price. Additionally we put in this indicator the MVWAP (Moving Volume Weighted Average Price). For those who do not know the usage and the importance od this indicator I recommend a great article about this subject at Investopedia ( https://www.investopedia.com/articles/trading/11/trading-with-vwap-mvwap.asp
FREE
Functional in the Forex market. Functional in the B3 market - Bolsa Brasil Balcão. Motivation The technical Fibonacci retraction indicator for many is essential and the basis for all market movement forecasts. The name of the tool comes from the Italian mathematician Leonardo de Pisa (13th century). This DEMO version will work in Meta Trader with Demo and Strategy Tester. To purchase the Full version that works on a Real account, click on: https://www.mql5.com/en/market/product/38089
FREE
Midas VWAP
Paulo Henrique Faquineli Garcia
4 (1)
Volume Weighted Average Price (VWAP) is a trading benchmark commonly used by Big Players that gives the average price a Symbol has traded throughout the day. It is based on both Volume and price. This indicator contains Daily VWAP and MIDAS' VWAP, which means you are able to anchor the beggining of MIDAS' calculations and, therefore you will be able to use this methodology to study price versus volume moves after anchor point. You will be able to anchor up to 3 HIGH MIDAS VWAP's and 3 LOW. Wis
FREE
交易实用必备工具指标 波浪自动计算指标,通道趋势交易 完美的趋势-波浪自动计算通道计算 , MT4版本 完美的趋势-波浪自动计算通道计算 , MT5版本 本地跟单复制交易 Easy And Fast Copy , MT4版本 Easy And Fast Copy , MT5版本 本地跟单复制交易 模拟试用 Easy And Fast Copy , MT4 模拟账号运行 Easy And Fast Copy , MT5 模拟账号运行 顺势指标又叫CCI指标,CCI指标是 美国 股市 技术分析   家唐纳德·蓝伯特(Donald Lambert)于20世纪80年代提出的,专门测量股价、外汇或者贵 金属 交易是否已超出常态分布范围。属于超买超卖类指标中较特殊的一种。波动于正无穷大和负无穷大之间。但是,又不需要以0为中轴线,这一点也和波动于正无穷大和负无穷大的指标不同。 相对强弱指标RSI是根据一定时期内上涨点数和下跌点数之和的比率制作出的一种技术曲线。能够反映出市场在一定时期内的景气程度。由威尔斯.威尔德(Welles Wilder)最早应用于期货买卖,后来人们发现在众多的图表技术分析中,
FREE
This indicator uses a different approach from the previous version to get it's trendlines. This method is derived from Orchard Forex, and the process of making the indicator is demonstrated in there video   https://www.youtube.com/watch?v=mEaiurw56wY&t=1425s . The basic idea behind this indicator is it draws a   tangent line   on the highest levels and lowest levels of the bars used for calculation, while ensuring that the lines don't intersect with the bars in review (alittle confusing? I kno
FREE
VWAP Indicator
LUC JACOBUS A VERHEECKE
4.27 (22)
Volume Weighted Average Price (VWAP) The volume weighted average price (VWAP) is a  trading   benchmark  used by traders that gives the average price a security has traded at throughout the day, based on both volume and price. It is important because it provides traders with insight into both the trend and value of a security. This indicator VWAP V2 is free and is the manual version of the extended Easy VWAP indicator (30 Euro), where the date and time properties are automatically entered. With
FREE
FusionAlert StochRSI Master is an indicator available for MT4/MT5 platforms, it is a combination of RSI & Stochastic indicator which provide "alerts" when the market is inside "overbought and oversold" regions combined for both indicators, results in more precise and accurate signals to be used as a wonderful tool, in the form of "buy or sell" signals. This indicator comes with many customization options mentioned in the parameter section below, user can customise these parameters as needful. Jo
FREE
Value Chart Candlesticks
Flavio Javier Jarabeck
4.75 (8)
The idea of a Value Chart indicator was presented in the very good book I read back in 2020 , " Dynamic Trading Indicators: Winning with Value Charts and Price Action Profile ", from the authors Mark Helweg and David Stendahl. The idea is simple and the result is pure genius: Present candlestick Price analysis in a detrended way! HOW TO READ THIS INDICATOR Look for Overbought and Oversold levels. Of course, you will need to test the settings a lot to find the "correct" one for your approach.
FREE
Valable ZigZag MT5
Sergey Ermolov
4.73 (15)
MT4 版本  | Trend Monitor VZ指標  |   Owl Smart Levels 指標  |  Owl Smart Levels策略  |  FAQ 艾略特波浪理论是对金融市场过程的解释,它依赖于价格图表上波浪的视觉模型。 Valable ZigZag指标显示市场的波浪结构,可用于做出交易决策。 Valable ZigZag指标更稳定,不像经典的ZigZag指标那样经常改变方向,误导交易者。 这是通过在指标波的构造中使用分形来实现的. Telegram 聊天: @it_trader_chat 新的 Expert Advisor Prop Master   - 在您的交易终端中进行测试 https://www.mql5.com/zh/market/product/115375 Valable ZigZag主要是一个趋势指标。 它设定了交易者应该交易的主要方向,但它也可以作为进入市场的指标。 例如。 在H4时间帧图表上安装指标,最后一波的方向将显示趋势的方向。 选择趋势交易方向后,切换到H1时间框架,并在针对所选趋势的最后一个峰值的细分处进入市场(见图2)。
FREE
Rule Plotter Scanner
Francisco Gomes Da Silva
您是否曾经想过拥有一款能够扫描所有策略并同时显示该资产所有时间框架的买卖点的扫描仪? 这正是这款扫描仪所能做到的。该扫描仪旨在展示您在 Rule Plotter: 无需编程即可创建策略的策略生成器 中创建的买卖信号,并在此扫描仪中在不同的资产和时间框架上运行它们。 Rule Plotter的默认策略仅涉及牛市和熊市的蜡烛,这意味着如果您在Rule Plotter中没有绘制任何策略,该扫描仪将向您展示所选资产在所有时间框架上的蜡烛颜色,如果蜡烛为负则为红色,为正则为绿色。 创建您想要的任意策略 不要局限于默认策略,发挥您的创造力,构建传统策略,使用Metatrader中的所有可用指标。 或者,使用您喜欢的指标构建定制策略。 此扫描仪仅是Rule Plotter所提供的功能的冰山一角;它只是Rule Plotter的辅助工具。 然而,真正的魔力并不在这些工具上,因为它们只是为您 发挥创造力 的工具。 通过此扫描仪,您将全面了解您选择的所有资产的所有时间框架中您的策略的表现。 同时观察到所有指标同时发出信号将使您充满信心地进入操作,因为您将全面了解市场中其他参与者正在看到什么,从而大大降低错
FREE
Hunttern ZigZag MT5
Hassan Gh Fakhraei
Hunt markets with Hunttern ZigZag . Easy to use with one parameter    You can use it for the following:       -Classic patterns       -Heads and shoulders       -Harmonic patterns       -Elliott Wave       -Support and resistance       -Supply and Demand Single parameter:      -Period (1-120) Features:        -Candle time        -Single parameter        -Light mode template This is version 1 of Hunttern ZigZag. We are very happy to receive feedback from you.
FREE
Full VWAP
Alexandre Borela
4.84 (31)
如果你象这个项目一样,就有5个饥饿审查。 塔克的后续工作: borelatech 平均价格与总额相比 一段时间内贸易。 这是按平均价格计算的。 a 股票是贸易点。 西非经货联经常被用作一个企业。 旨在尽可能被动的投资者的贸易基准 执行。 有了这一指标,你将能够利用万国宫: 目前日。 目前周。 目前 Month。 目前配额。 目前年。 或: 前一日。 前一星期。 曾任Month。 曾任。 曾任一年。
FREE
Cybertrade Keltner Channels
Emanuel Andriato
4.75 (4)
Cybertrade Keltner Channels - MT5 Created by Chester Keltner, this is a volatility indicator used by technical analysis. It is possible to follow the trend of financial asset prices and generate support and resistance patterns. In addition, envelopes are a way of tracking volatility in order to identify opportunities to buy and sell these assets. It works on periods longer than the period visible on the chart. All values ​​are available in the form of buffers to simplify possible automations.
FREE
QuantumAlert Stoch Navigator is a free indicator available for MT4/MT5 platforms, its work is to provide "alerts" when the market is inside "overbought and oversold" regions in the form of "buy or sell" signals. This indicator comes with many customization options mentioned in the parameter section below, user can customise these parameters as needful. Join our   MQL5 group , where we share important news and updates. You are also welcome to join our private channel as well, contact me for the p
FREE
Bar Color Trend
Germano Chagas
4.5 (6)
Combining the best of Price Action , Directional Movement , and Divergence/Convergence analysis, Candle Color Trend is a easy and reliable way to identify trend direction. The indicator automatically paints the candles according to the assumption that an uptrend is defined by prices that form a series of higher highs and higher lows. In contrast, a downtrend is defined by prices that form a series of lower highs and lower lows. Additionally, ADX Wilder indicator is used to measure trend weakness
FREE
MIDAS Super VWAP
Flavio Javier Jarabeck
4.44 (9)
Imagine VWAP, MVWAP and MIDAS in one place... Well, you found it! Now you can track the movement of Big Players in various ways, as they in general pursue the benchmarks related to this measuring, gauging if they had good execution or poor execution on their orders. Traders and analysts use the VWAP to eliminate the noise that occurs throughout the day, so they can measure what prices buyers and sellers are really trading. VWAP gives traders insight into how a stock trades for that day and deter
FREE
VWAP and MVWAP
Flavio Javier Jarabeck
4 (5)
Volume Weighted Average Price (VWAP) is a trading benchmark commonly used by Big Players that gives the average price a Symbol has traded throughout the day. It is based on both Volume and price. Additionally we put in this indicator the MVWAP (Moving Volume Weighted Average Price). For those who do not know the usage and the importance od this indicator I recommend a great article about this subject at Investopedia ( https://www.investopedia.com/articles/trading/11/trading-with-vwap-mvwap.asp )
FREE
Strong movement levels
Nikolay Mitrofanov
5 (2)
Looks for strong price movements and draws levels upon their completion. You determine the strength of the movement yourself by specifying in the settings the number of points and the number of candles of the same color in a row in one direction. There are 2 types of building in the settings: extrenum - high / low close - close price You can also adjust the number of displayed levels and the number of candles for calculations. By default, the settings indicate 5 levels for 360 candles.
FREE
TilsonT3
Jonathan Pereira
Tillson's T3 moving average was introduced to the world of technical analysis in the article ''A Better Moving Average'', published in the American magazine Technical Analysis of Stock Commodities. Developed by Tim Tillson, analysts and traders of futures markets soon became fascinated with this technique that smoothes the price series while decreasing the lag (lag) typical of trend-following systems.
FREE
White Weis Volume Ticks
Ricardo Almeida Branco
5 (3)
White Weis Volume This indicator shows the sum of the volume in each wave, bulish or bearish, as idealized by David Weis , but it brings an important addition , which is the marking of the bar with the highest volume of the wave (White Bar)! In coding the indicator, it was sought to optimize the code to require minimal processing during use and not to overload mt5. The indicator can be used for pre-trading analysis and study, where the trader analyzes possible points of support and resi
Graphic Alignment Context
Ricardo Alexandre Laurentino
The Graphic Alignment Context (GAC) Technical Indicator measures the vertical difference of the simple average price of a financial instrument in the context of three different timeframes determined by a defined number of bars or candles (periods) to determine the strength of the buy or sell trend. sale. Ascending average prices indicate Buying strength (1), Descending average prices indicate Selling strength (-1) and any scenario different from the previous two conditions indicates Neutrality
FREE
LT Agression Indicator
Thiago Duarte
5 (3)
This is a buyer and seller aggression indicator that analyzes the shape of each candle and project this data in a histogram form. There are 4 histograms in one. On the front we have two: Upper - Buyer force. Lower - Seller force. At the background we also have two histogram, both with same color. They measure the combined strenght of buyers and sellers. This histograms can be turned off in Input Parameters. It is also possible to have the real or tick volume to help on this force measurement. IN
FREE
WaveTrend Plus
Nguyen Thanh Cong
5 (3)
Introduction WaveTrend Plus is an amazing oscillator that can detect optimal entry points in the market with high precision using complex computations of price and momentum. This version packs many improvements compared to the original WaveTrend such as cleaner visuals, oversold/overbought signals and divergence detection Signal Buy when oversold signal appear (green dot below) or when a bullish divergence is detected (green dashed line) Sell when overbought signal appear (red dot ab
FREE
Simple Weis Wave
Jean Jacques Huve Ribeiro
3.67 (3)
One of the best tools for analyzing volume, Weis Wave was idelized by David Weis, to facilitate the reading of directional flow. For the VSA method disciples it is an evolution of the practices created by Richard Wycoff, facilitating a predictive reading of the market, always seeking an accumulation and distribution of the negotiated contracts. Cumulative wave volume  Range of wave ( removed) Average Wave volume Ref "Tim Ord lectures" ( removed)
FREE
Market Thermometer Jr
Edson Cavalca Junior
The Market Thermometer can be used to help traders identify sleepy or turbulent periods. It helps beginners to check when is the ideal time to enter operations, that is, when the value of the thermometer is below its average for several periods, identifying a peaceful market. When the market is heated, that is, the thermometer is above three times its average, it is time to make profits. The Thermometer measures the extent to which the end of a period, maximum or minimum price, projects outsi
FREE
Donchian Pro
Paulo Henrique Faquineli Garcia
5 (2)
The Donchian Channel Channels are among the most popular tools of technical analysis, as they visually convey to the analyst the limits within which most price movement tends to occur. Channel users know that valuable information can be obtained at any time, whether prices are in the central region of a band or close to one of the border lines. One of the best known techniques to explore these concepts is Bollinger Bands. However, John Bollinger was not the only one to research the applicatio
FREE
Coiote Volume Candle
Alexandre Moraes De Souza Lima
Candle de Volume Coiote O Candle de Volume  Coiote é um indicador que mede a variação do volume no tempo, seu corpo é pela variação do volume anterior pelo volume atual, sua direção pelo fechamento do preço. 1. identificado um topo no indicador Candle de Volume  Coiote (marcado o fechamento do preço). 2. identificado um fundo no indicador Candle de Volume Coiote (marcado o fechamento do preço). 3. fundo 3 igual fundo 2 no indicador Candle de Volume Coiote, preço no 3 é diferente de fundo 2
FREE
Quantitative Candlesticks Qstick
Flavio Javier Jarabeck
4 (2)
Qstick is a way to objectively quantify candlestick analysis and improve the interpretation of candlestick patterns. Qstick was developed by Tushar Chande and published in his book " The New Technical Trader - Boost Your Profit by Plugging Into the Latest Indicators (1994) ". Qstick is built based on a moving average of the difference between the Open and Close prices. The basis of the idea is that the Opening and Closing prices are the heart of candlestick analysis. We strongly recommend the re
FREE
Aggression Wave RSJ
JETINVEST
4.83 (6)
This indicator sums up the difference between the sells aggression and the buys aggression that occurred in each Candle, graphically plotting the waves of accumulation of the aggression volumes.   Through these waves an exponential average is calculated that indicates the direction of the business flow. Note: This indicator DOES NOT WORK for Brokers and/or Markets WITHOUT the type of aggression (BUY or SELL).   Be sure to try our Professional version with configurable features and alerts:  Agr
FREE
Free automatic Fibonacci is an indicator that automatically plots a Fibonacci retracement based on the number of bars you select on the BarsToScan setting in the indicator. The Fibonacci is automatically updated in real time as new highest and lowest values appears amongst the selected bars. You can select which level values to be displayed in the indicator settings. You can also select the color of the levels thus enabling the trader to be able to attach the indicator several times with differe
FREE
该产品的买家也购买
Atomic Analyst MT5
Issam Kassas
4.56 (18)
首先值得强调的是,该交易指标是非重绘、非延迟的指标,这使其成为手动和机器人交易的理想选择。 用户手册:设置、输入和策略。 Atomic Analyst是一种PA价格行动指标,利用价格的力量和动量来寻找市场上更好的机会。配备了高级过滤器,可帮助去除噪音和假信号,并提高交易潜力。使用多层复杂的指标,Atomic Analyst扫描图表,并将复杂的数学计算转化为任何初学者都能理解并用来做出一致交易决策的简单信号和颜色。 “Atomic Analyst”是专为新手和经验丰富的交易者量身定制的综合交易解决方案。它将高级指标和一流功能融合为一体的交易策略,使其成为所有类型交易者的多功能选择。 日内交易和剥头皮策略:专为快速准确的日内交易和短期交易而设计。 日内和摆动交易策略:可用作追求价格大幅波动的日内和摆动交易者的可靠工具。 多货币和市场:凭借其可靠的精度,在不同的工具和市场上运作。 多个时间框架:可在多个时间框架上使用,性能良好。 稳定性:所有指标均不重绘、不重绘和不滞后,确保可靠的信号。 信号清晰度:提供箭头信号,用于清晰的入场和出场点。 实时警报:通过交易入场、SL和TP警报通知交
首先,值得强调的是,这个交易系统是一个非重绘、非重画和非滞后的指标,这使得它非常适合手动和机器人交易。 在线课程,手册和下载预设。 “智能趋势交易系统 MT5”是专为新手和经验丰富的交易者量身定制的综合交易解决方案。它结合了超过 10 个优质指标,具有 7 多个强大的交易策略,使其成为适用于各种市场条件的多功能选择。 趋势跟随策略:提供精确的入场和止损管理,以有效地跟随趋势。 反转策略:识别潜在的趋势反转,使交易者能够利用区域市场的机会。 剃头策略:专为快速准确的日内交易和短期交易而设计。 稳定性:所有指标都不会重绘、不会重画和不会滞后,确保可靠的信号。 定制:支持自定义策略,以满足个人交易偏好。超过 7 种策略和组合可帮助您找到最佳策略。 信号清晰度:提供箭头信号,以指示清晰的入场和退出点。 实时警报:通过交易进出警报使交易者保持了解。 深入分析:提供更高时间框架的趋势分析和实时交易监控。 自适应颜色编码:利用蜡烛颜色编码来显示成交量、趋势和反转蜡烛信号。通过蜡烛颜色分析市场方向。 “智能趋势交易系统 MT5”赋予交易者必要的工具,以便在各种市场条件下做出明智和战略性的交易决策。无论
TPSpro RFI Levels MT5
Roman Podpora
4.67 (9)
Reversal First Impulse levels (RFI)      INSTRUCTIONS        RUS       -       ENG              R ecommended to use with an indicator   -   TPSpro  TREND PRO -  Version MT4                 A key element in trading is zones or levels from which decisions to buy or sell a trading instrument are made. Despite attempts by major players to conceal their presence in the market, they inevitably leave traces. Our task was to learn how to identify these traces and interpret them correctly. Main functi
Bill Williams Advanced
Siarhei Vashchylka
5 (8)
Bill Williams Advanced is designed for automatic chart analysis using Bill Williams' "Profitunity" system. The indicator analyzes four timeframes at once. Manual (Be sure to read before purchasing) Advantages 1. Automatically analyzes the chart using the "Profitunity" system of Bill Williams. The found signals are placed in a table in the corner of the screen. 2. Equipped with a trend filter based on the Alligator indicator. Most of the system signals are recommended to be used only accordi
TrendMaestro5
Stefano Frisetti
note: this indicator is for METATRADER4, if you want the version for METATRADER5 this is the link:  https://www.mql5.com/it/market/product/108106 TRENDMAESTRO ver 2.4 TRENDMAESTRO recognizes a new TREND in the bud, he never makes mistakes. The certainty of identifying a new TREND is priceless. DESCRIPTION TRENDMAESTRO identifies a new TREND in the bud, this indicator examines the volatility, volumes and momentum to identify the moment in which there is an explosion of one or more of these data a
Introduction to X3 Chart Pattern Scanner X3 Cherart Pattern Scanner is the non-repainting and non-lagging indicator detecting X3 chart patterns including Harmonic pattern, Elliott Wave pattern, X3 patterns, and Japanese Candlestick patterns. Historical patterns match with signal patterns. Hence, you can readily develop the solid trading strategy in your chart. More importantly, this superb pattern scanner can detect the optimal pattern of its kind. In addition, you can switch on and off individu
IVISTscalp5
Vadym Zhukovskyi
5 (5)
我们向您介绍iVISTscalp5指标,它不仅独特,而且在交易操作中也非常有效。该指标基于时间数据,是多年金融市场经验和深入分析的结果。iVISTscalp5指标是手动交易的优秀工具。便利性、简单性和可视化 - 所有的复杂性都隐藏在内部。我们将iVISTscalp5指标的设置和使用简化到了最大程度。该指标适用于MT5终端中您所拥有的所有金融工具。 操作时间为UTC+3的早上4点到晚上8点。 iVISTscalp5指标菜单(见截图1): History - 计算行情的周数 dT_min - 选择时间间隔的时间(分钟) TFline - 绘制水平成交量(时间帧) BARSline - 绘制水平成交量(条数) TFtrend1 - 绘制日线通道(时间帧) BARStrend1 - 绘制日线通道(条数) TFtrend2 - 绘制周线通道(时间帧) BARStrend2 - 绘制周线通道(条数) ALERT_TIMER - 设置闹钟 ALERT - 开启/关闭闹钟 Save - 开启/关闭将时间记录到文本文件。 图表上的红色和蓝色旗帜表示时间(VIST智能剃须系统的信号)。卖出信号为红旗,买入
Elliott Wave Trend MT5
Young Ho Seo
4 (3)
Elliott Wave Trend was designed for the scientific wave counting. This tool focuses to get rid of the vagueness of the classic Elliott Wave Counting using the guideline from the template and pattern approach. In doing so, firstly Elliott Wave Trend offers the template for your wave counting. Secondly, it offers Wave Structural Score to assist to identify accurate wave formation. It offers both impulse wave Structural Score and corrective wave Structure Score. Structural Score is the rating to sh
Dragon Multi Indicator MT5
Mansour Babasafary
5 (5)
3 Indicators in 1 indicator Strategy based on price action Made specifically for the best forex currency pairs Can be used in the best time frame of the market at a very reasonable price This indicator is basically 3 different indicatos . But we have combined these 3 indicators in 1 indicator so that you can use 3 indicators at the lowest price. All three strategies are based on price action. But based on different trends. Long term, medium term and short term Attributes : No repaintin
FxaccurateLS
Shiv Raj Kumawat
WHY IS OUR FXACCCURATE LS MT5 THE PROFITABLE ? PROTECT YOUR CAPITAL WITH RISK MANAGEMENT Gives entry, stop and target levels from time to time. It finds Trading opportunities by analyzing what the price is doing during established trends. POWERFUL INDICATOR FOR A RELIABLE STRATEGIES We have made these indicators with a lot of years of hard work. It is made at a very advanced level. Established trends provide dozens of trading opportunities, but most trend indicators completely ignore them!
SpuerTrend MTF 指标 , 是一款出色的趋势跟踪指标 . 它不光能显示图表的时间框架下的 SuperTrend 趋势 , 还可以设置同时显示更大时间框架的 SuperTrend 趋势 . 这将有利于把握更大时间级别的趋势 , 判断未来的趋势 . 同时 , 还可以显示趋势线的价格 , 一目了然 , 便于观察 . 输入参数 :  ATR period used at chart timeframe           :  当前时间框架下的 ATR 周期 ATR weight used at chart timeframe           :   当前时间框架下的 ATR 权重 SuperTrend line width at chart timeframe   :  当前时间框架下的趋势线的宽度 Up trend line color at chart timeframe        :  当前时间框架下的上升趋势线的颜色 Down trend line color at chart timeframe    :  当前时间框架下的下降趋势线的颜色 Show
Elliot Waves Analyzer Pro
Viktor Weidenthal
2.67 (3)
Elliot Waves Analyzer Pro calculates Elliot Waves to Help Identify Trend direction and Entry Levels. Mainly for Swing Trading Strategies. Usually one would open a Position in trend direction for Wave 3 or a Correction for Wave C . This Indicator draws Target Levels for the current and next wave. Most important Rules for Elliot Wave Analysis are verified by the Indicator.  The Pro version analyzes Multiple Timeframes and shows the Subwaves and Target-Levels.   For an Overview  " Elliot Waves Anal
Introducing the South African Sniper indicator created by a small group of traders with a few years trading trading the financial market profitably . This is a plug and play indicator that provides you with  BUY and SELL (SNIPER ENTRY) signals with TARGET and trail stops. The indicator Works with all MT5 trading instruments. The indicator uses previous  chart data as receipt to speculate on future market moves.  "The South African Sniper indicator community are very happy with the indicator an
VTrende Pro
Andrii Diachenko
5 (1)
VTrende Pro - MTF indicator for trend trading with a display panel for MT5 *** Videos can be translated into any language using subtitles (video language - Russian) Although the signals of the VTrende Pro indicator can be used as signals of a full-fledged trading system, it is recommended to use them in conjunction with the Bill Williams TS. VTrende Pro is an extended version of the VTrende indicator. Difference between Pro version and VTrende: - Time zones - Signal V - signal 1-2 waves
Piranha version 2
Maria Strudov
5 (1)
"Piranha" - an autonomous trading system that determines overbought and oversold levels on the chart. Red and blue zones represent overbought and oversold levels respectively. Entry points are marked with arrows: a downward arrow in the red zone for "sell" and an upward arrow in the blue zone for "buy". The Take profit level is indicated by the green moving average. Key features: Adjusting the Take profit level as the green moving average changes position. Averaging ability when a new market e
Golden Gate Algo MT5
James David Lane
4 (6)
40% 圣诞优惠!价格将于1月1日涨至$250! 推出GoldenGate Entries:前沿交易解决方案! 发现与GoldenGate Entries(GGE)一同进行交易的革命性方法,这是一款设计用于提升您交易体验的先进指标。GGE提供了一套全面的功能,以赋予用户在交易决策中的精准和信心。 交易对:任意(外汇 - 商品 - 股票 - 股票 - 加密货币) 时间框架:15分钟至H1 主要特点: 买入和卖出箭头指示:接收伴随弹出警报的买入和卖出箭头指示,确保您随时保持了解。 GoldenGate_Algo:通过GoldenGate_Algo深入了解市场状况,这是一款强大的工具,用于评估市场是否处于“超卖”或“超买”状态。 当前趋势分析:通过访问您正在查看的时间框架上的当前趋势,保持领先地位,使您能够将交易与市场当前方向对齐。 内置枢轴点:使用内置的枢轴点轻松识别关键市场点,提供有价值的支撑和阻力水平。 蜡烛扫描器:分析蜡烛形态和图案,找到最佳的入场点并过滤掉低概率的入场。 完全定制:通过完整的定制选项,完全掌控您的交易体验,允许您个性化从
SMCpro
Arief
5 (1)
Currently Price  20% OFF  ( for unlimited use ) Indicator   USER MANUAL , trade setups, solving issues, etc :  Direct Download Here     (  for users only  ) Hello World! Introducing.. SMCpro tool and Indicator for  MetaTrader 5 , a cutting-edge feature designed to revolutionize your trading experience. With innovative ICT Smart Money Concept, you gain unparalleled insight into market dynamics, empowering you to make informed trading decisions like never before. SMC Indicator built on th
The iChannels
BeeXXI Corporation
5 (1)
Ultra-fast recognition of parabolic channels (as well as linear, horizontal and wavy channels) throughout the depth of history, creating a hierarchy of channels. Required setting: Max bars in chart: Unlimited This indicator is designed primarily for algorithmic trading, but can also be used for manual trading.  This indicator will have a very active evolution in the near future and detailed descriptions on how to apply to create robots
Introducing the Power Trade Plus indicator designed by a small group of traders with a few years of experience trading the market profitably.  The Power Trade Plus is derived from the Power Trade indicator,  the indicator strive in powerful sniper entries and take profit levels,  with an algorithm that's can determine the markets volatility and Provides entries based on the current market volatility. This indicator is much more effective in stock ,currencies and indices.
How to use Pair Trading Station Pair Trading Station is recommended for H1 time frame and you can use it for any currency pairs. To generate buy and sell signal, follow few steps below to apply Pair Trading Station to your MetaTrader terminal. When you load Pair Trading Station on your chart, Pair Trading station will assess available historical data in your MetaTrader platforms for each currency pair. On your chart, the amount of historical data available will be displayed for each currency pai
精密指数振荡器(Pi-Osc)由Precision Trading Systems的Roger Medcalf开发 版本2经过精心重新编码,以在您的图表上加载速度非常快,还加入了一些其他技术改进,以提高体验。 Pi-Osc旨在提供准确的交易定时信号,旨在找到极端的耗尽点,这些点是市场被迫去触及,以清理每个人的止损单。 该产品解决了一个古老的问题,即知道极端点在哪里,这使得交易员的生活变得更加简单。 这是一个高度复杂的共识指标,与行业标准的振荡器相比,具有一些强大的区别。 它使用的一些特征包括需求指数、资金流动、RSI、随机指标、模式识别、成交量分析、标准偏差极端点以及不同长度上述各种变化的分歧。 乍一看,对于未经培训的人来说,它似乎与任何其他振荡器没有什么不同,但当与其他振荡器(如RSI或动量等)相对比时,这个指标的真正威力开始显现。 据我所知,没有其他振荡器可以频繁地精确指出顶部和底部,具有相同的定期效率。 精密指数振荡器由许多不同的数学方程组成,用于测量多个时间框架采样中的价格和成交量变动,从而高度准确地预测趋势可能发生转折的位置。 PTS P
Matreshka
Dimitr Trifonov
5 (1)
Matreshka self-testing and self-optimizing indicator: 1. Is an interpretation of the Elliott Wave Analysis Theory. 2. Based on the principle of the indicator type ZigZag, and the waves are based on the principle of interpretation of the theory of DeMark. 3. Filters waves in length and height. 4. Draws up to six levels of ZigZag at the same time, tracking waves of different orders. 5. Marks Pulsed and Recoil Waves. 6. Draws arrows to open positions 7. Draws three channels. 8. Notes support and re
PTS - Divergence Buy Finder 由Precision Trading Systems制作 Precision Divergence Finder旨在精确找到市场底部,并经常成功。在技术分析中,挑选底部通常比挑选顶部容易得多,这个工具正是为了完成这个任务而设计的。在识别出牛市背离后,等待趋势上升再购买是明智的。您可以使用10或20个周期的最高点进场,或者使用15-30周期的移动平均线上升来识别趋势变化。 这个复杂的算法会实时逐根柱状图寻找并计算活跃的需求指数背离的数量。 该模型观察市场价格何时创出新低,而需求指数未创新低,从而产生背离。 该指标使用两个设置。     • 需求指数(DI)长度,它将为指标提供寻找的对象,并将为您选择的长度上的任何DI背离进行查找。     • 差异,这是[DI值现在]与[DI值长达200个周期以前]之间的背离量,对于它从各种回望期间找到的每个背离,它将在指标窗口中生成[1]输出。 最多检查20个周期,最大输出值将显示为20。 建议的设置 需求指数长度从15到100都可以使用,但最佳范围在20到60之间。 背离的差异为0.1至2
PTS Divergence Buy Finder MT5
PrecisionTradingSystems
PTS - Divergence Buy Finder 由Precision Trading Systems制作 Precision Divergence Finder旨在精确找到市场底部,并经常成功。在技术分析中,挑选底部通常比挑选顶部容易得多,这个工具正是为了完成这个任务而设计的。在识别出牛市背离后,等待趋势上升再购买是明智的。您可以使用10或20个周期的最高点进场,或者使用15-30周期的移动平均线上升来识别趋势变化。 这个复杂的算法会实时逐根柱状图寻找并计算活跃的需求指数背离的数量。 该模型观察市场价格何时创出新低,而需求指数未创新低,从而产生背离。 该指标使用两个设置。     • 需求指数(DI)长度,它将为指标提供寻找的对象,并将为您选择的长度上的任何DI背离进行查找。     • 差异,这是[DI值现在]与[DI值长达200个周期以前]之间的背离量,对于它从各种回望期间找到的每个背离,它将在指标窗口中生成[1]输出。 最多检查20个周期,最大输出值将显示为20。 建议的设置 需求指数长度从15到100都可以使用,但最佳范围在20到60之间。 背离的差异为0.1至2
[ MT4 Version ] Only the next 10 units at current price! Final price: $299 Are you tired of spending months on demo or live accounts to test your trading strategies? The Backtesting Simulator is the ultimate tool designed to elevate your backtesting experience to new heights. Utilizing Metatrader historical symbol information, it offers an unparalleled simulation of real market conditions. Take control of your testing speed, test ideas quickly or at a slower pace, and witness remarkable improve
Good day! I present to you a trading technical indicator for Deriv broker synthetic indices. This indicator ONLY works with the following indices: Boom 300 Index Boom 500 Index Boom 1000 Index Crash 300 Index Crash 500 Index Crash 1000 Index The indicator was created to give signals to open medium-term trades in the direction of Spikes. But you can open trades in the opposite direction to Spikes, at your own risk. Trade only on M1. Other TFs do not guarantee the correct operation of the indic
Go Way TREND
Ywsf Hsyn Hmad Alrsh
順應潮流。是的,在 15 分鐘的框架上等待進場信號,無論是買入還是賣出,並檢查信號是否出現在 30 分鐘的框架上(有時信號需要一個小時或更長時間才會出現。您可以返回到15分鐘框架並返回到30分鐘框架,重複此操作,直到主要訊號出現在您面前。被記錄,或當相反的訊號出現時它非常簡單並且適用於所有主要貨幣。  金屬、指標和所有框架,但最好的結果是 30 分鐘框架。 始終將止損設置在蠟燭底部下方,資金管理不得超過 資本的10% 順應潮流。是的,在 15 分鐘的框架上等待進場信號,無論是買入還是賣出,並檢查信號是否出現在 30 分鐘的框架上(有時信號需要一個小時或更長時間才會出現。您可以返回到15分鐘框架並返回到30分鐘框架,重複此操作,直到主要訊號出現在您面前。被記錄,或當相反的訊號出現時它非常簡單並且適用於所有主要貨幣。  金屬、指標和所有框架,但最好的結果是 30 分鐘框架。 始終將止損設置在蠟燭底部下方,資金管理不得超過 資本的10% 順應潮流。是的,在 15 分鐘的框架上等待進場信號,無論是買入還是賣出,並檢查信號是否出現在 30 分鐘的框架上(有時信號需要一個小時或更長時
Scalping Tool for Deriv Description: This trading indicator is designed for traders specializing in scalping. It provides signals for trading in the direction of short-term price movements. The indicator is optimized for use on the M1 timeframe and supports Boom and Crash indices (300, 500, 1000). The indicator will be sold in a limited quantity. Features: Trading direction: towards short-term price movements. Filters and indicators: Reaction volume indicator: displays activity zones. Trend i
The Volume Spread Analysis indicator is based on the original Volume Spread Analysis method. It was designed for quick and easy recognition of VSA patterns. Even though this indicator looks very simple, it is the most sophisticated tool we've ever made. It is a really powerful analytical tool that generates very reliable trading signals. Because it is very user-friendly and understandable, it is suitable for every type of trader, regardless of his experience. What is VSA? VSA - Volume Spread
Dinapoli Package MT5
Samil Bozuyuk
5 (2)
All in One package includes the  Oscillator Predictor ,  MACD Predictor ,  Thrust Scanner  and  Advanced Fibonacci  indicators which are mandatory for applying  Dinapoli  trade plans.  Please visit below links for detailed explanations of indicators. Advanced Fibonacci Indicator =>  https://www.mql5.com/en/market/product/107933 Thrust Scanner Indicator =>  https://www.mql5.com/en/market/product/52829 Overbought /Oversold Predictor indicator => https://www.mql5.com/en/market/product/52628 Macd
作者的更多信息
Box Weis Wave
Thalles Nascimento De Carvalho
5 (1)
提升您的分析水平,使用 Weis Wave Box! 如果您在寻找精准和清晰的交易工具, Weis Wave Box 就是您所需要的。这款高级指标提供了对成交量波动和关键点的详细视觉分析,帮助您更好地理解市场中努力与结果之间的关系。 Weis Wave Box 的主要特点: 可自定义的成交量波动: 根据您的交易策略调整成交量波动的刻度。 可调历史记录: 专注于特定的时间段,以获得更精确和相关的分析。 刻度与实际成交量的区别: 清晰区分刻度和实际成交量,以获得更全面的市场视图。 顶部盒子可视化: 清楚地看到成交量(能量)最高的地方以及价格波动较小的地方。这种可视化帮助识别努力与结果之间的关系,突显出主导力量,并提示可能的未来价格变化。 ️ 可自定义的摆动形式: 使用五种不同的摆动形式,包括 totalVol、length、width、barDVol 和 lengthDVol,以适应您的分析需求。 Weis Wave Box 的优势: 分析清晰度: 理解努力与结果之间的关系,确定哪一方正在主导以及这可能如何影响未来的价格走势。 直观界面: 轻松导航和高效使
AI Channel
Thalles Nascimento De Carvalho
4 (4)
Welcome to the presentation of the AI Channel indicator, a powerful tool that uses artificial intelligence for price channel analysis in the financial market. In this session, we will explore how this revolutionary indicator can assist investors and traders in making more informed and strategic decisions. Let's get started! I. What is the AI Channel indicator? AI Channel is an indicator developed based on advanced artificial intelligence algorithms. It utilizes historical price data of financial
FREE
Swing Point Volume
Thalles Nascimento De Carvalho
Swing Point Volume, the indicator that signals weakness and strength at the tops and bottoms. This indicador can be for used the Wyckoff Method. Information provided; - Swing on customized ticks. - Volume and points in each balance sheet. - Percentage of Displacement. - Sound alert option on top and bottom breaks. - Volume in ticks and Real Volume. - Volume HL (extreme) or (opening and closing) - Customized volume shapes.
Atr Projection
Thalles Nascimento De Carvalho
ATR Projection指标在技术分析中脱颖而出,旨在提供有关金融市场潜在价格移动极限的准确见解。其灵活的方法允许用户直观地定制分析指标,以适应每个交易资产的特定需求。 可定制的运行方式: 默认情况下,ATR Projection考虑最近100根蜡烛的平均值的30%。这种灵活性使用户能够根据其偏好和每个资产的独特特征调整指标,提供更个性化的分析。 选择30%和100根蜡烛背后的逻辑: 对百分比和蜡烛数量的慎重选择旨在捕捉最近过去的相关动向,提供更精确的预测。这种战略性方法突显了价格有显著概率移动的区域,为交易员提供更明智的视角。 ATR Projection的优势: 1. 可定制的技术准确性:用户可以根据每个交易资产的特定条件自由定制指标。 2. 专注于高概率:通过仅关注最近100根蜡烛的平均值的30%,ATR Projection将注意力集中在可能性较高的移动上,优化了明智的决策制定。 3. 适应交易资产:该指标的灵活性允许适应不同的资产,提供根据每种金融工具的独特特征定制的分析。 此外,值得注意的是,ATR Projecti
Long Short Pro
Thalles Nascimento De Carvalho
Long & Short 指标 - Pro 版:解锁无限市场分析潜力! 适用于任何资产的无限制 Long & Short 指标的 Pro 版允许您在任何金融资产上使用,无需再受限 - 将同一指标应用于您所有的首选资产! 无任何限制 享受指标的所有功能,不受任何限制。Pro 版提供完整且无限制的体验,确保您能够最大化每一个市场机会。 Pro 版特点 无限访问 :在所有金融资产上使用指标,探索其全部潜力。 高级精确度 :受益于详细的分析和清晰的信号,以做出明智且安全的决策。 完全灵活 :根据您的具体交易需求调整指标,无论是资产还是策略。 接收关键机会的提醒 启用提醒,密切监控重要水平,确保您始终领先于市场机会。 EA 构建的缓冲区参数 构建 Expert Advisors (EAs) 时,请使用以下缓冲区: 缓冲区符号 1 = 0 缓冲区符号 2 = 2 为什么选择 Pro 版? 完全自由 :将指标应用于任何资产,无限制使用。 完整体验 :享受所有功能和详细分析。 全面分析 :适合那些希望在各种市场中最大化其潜力的交易者。
Reversal Vol Propagation
Thalles Nascimento De Carvalho
Are you tired of missing out on trading opportunities by not being able to identify price reversals in time? Do you want to maximize your profits and make informed trading decisions? Introducing the Reversal Vol Propagation Indicator, the revolutionary tool that uses neural networks and volume data to predict potential price reversals. Based on a powerful combination of advanced algorithms and cutting-edge technology, the Reversal Vol Propagation meticulously analyzes volume patterns and past pr
Didi Index Volume
Thalles Nascimento De Carvalho
介绍一下Didi指数成交量(Didi Index Volume),这是由巴西交易员Odir Aguiar开发的一种技术分析指标,以其先进而强大的方法在金融市场中发现机会而脱颖而出。Didi指数成交量在各种平台上提供,已成为追求精确见解和有价值信息的交易员们的重要工具。 该指标将著名的Didi指数与智能使用的交易量结合起来。这种组合可以更深入地分析价格行为和交易量之间的相互作用,提供了独特的资产运动视角。 通过复杂的算法和加权平均计算,Didi指数成交量可以根据交易量提前预测价格变动。这一特点对于识别新兴趋势、市场反转和适时的入场和出场点非常重要。 使用Didi指数成交量,您可以获得客观可靠的信息,帮助避免草率决策,提高准确解读市场的能力。该指标具有直观且可自定义的界面,适应个人偏好,提供高度个性化的交易体验。 立即尝试Didi指数成交量,发现为什么如此多的交易员信任这个工具,在金融市场中获得竞争优势。扩展您的可能性,推动您的交易业绩,这是一款为最苛刻的交易员需求而设计的智能解决方案。 使用提示: - 始终关注MA Slow(红色)的趋势。当MA Sl
Smart Binary Volume
Thalles Nascimento De Carvalho
智能二元交易量指标是一种多功能工具,结合了交易量分析和机器学习。它可以应用于各种市场和策略,包括超短线交易和其他短期交易方式。利用先进的机器学习算法,该指标能够识别复杂的模式,提供更准确的买入和卖出信号。 Buffer to Create EA. Buffer Line Gold = 0. Buffer Line Red = 2 Buffer   AI  =  3 AI Buffer  >=  0  ("SIGNAL BUY") AI Buffer  <=  0  ("SIGNAL SELL") 使用提示: 1. 注意当线条相反时:请注意Smart Binary Volume指标显示线条相反运动的情况。这种情况可能表示进入的信号。 2. 看涨信号:当蓝线高于0.30,而红线位于-0.30以下时,要密切关注。这种配置可能暗示着一个上涨趋势,表明可能有购买机会。 3. 看跌信号:当红线高于0.30,而黄线位于-0.30以下时,这可能预示着一个下跌趋势,表明有卖出机会。 4. 使用机器学习信号验证您的入市点:利用指标面板上机器学习生成的信号来验证您进入市
TimeChannel
Thalles Nascimento De Carvalho
"Timechannel"似乎是一款强大而多功能的技术分析工具,专为希望深入了解多个时间段内价格波动并做出更准确决策的交易员而设计。您提到的主要功能和好处都非常引人注目,对于渴望在金融市场上最大化潜力的严肃交易员可能非常有价值。以下是一些关键要点: 1. **高级多时间段分析**:同时分析不同时间段内的价格波动的能力对于获取全面的市场洞察至关重要。这有助于识别长期趋势、短期机会和理想的入场/出场点。 2. **可定制的价格通道**:用户可以调整指标的参数,根据其偏好和交易策略自定义价格通道。这包括设置通道宽度、颜色和样式。 3. **自动趋势检测**:Timechannel配备了先进的算法,可以自动检测不同时间段内的趋势。这使交易员能够轻松识别上升趋势、下降趋势和盘整。 工作原理: 1. **资产选择**:交易员选择他们想要使用Timechannel进行分析的资产。 2. **时间框架配置**:配置多时间段分析的所需时间框架。这可以包括每日、每小时和分钟图表等。 3. **参数定制**:交易员可以根据自己的偏好自定义指标参数,如通道宽度、颜色和
DeltaBook
Thalles Nascimento De Carvalho
Delta Book指标是一种强大的市场分析工具,结合了成交量差异(Volume Delta)和订单簿(order book)信息,以侦测股票、期货和加密货币等金融市场的价格波动。需要注意的是,要充分发挥Delta Book的潜力,需要获得实时成交量数据和订单簿信息。 Delta Book的主要特点是其先进的市场分析策略,使交易员和投资者能够根据有关市场参与者行为的详细信息来识别趋势和交易机会。以下是一些有关描述Delta Book指标的提示和重要方面: 成交量差异:成交量差异是特定时间段内购买(需求)和出售(供应)的成交量之间的差异。这一指标定量衡量了买家和卖家之间的不平衡,有助于识别市场买卖压力的变化。 订单簿:订单簿是市场上所有买卖订单的实时记录。它显示了交易员愿意购买和出售资产的价格,以及他们愿意以这些价格交易的资产数量。Delta Book使用订单簿信息来分析市场参与者的行为。 价格流动:Delta Book有助于识别价格流动,即资产价格如何受成交量差异和订单簿的变化影响。这对于理解买入和卖出订单如何影响价格波动至关重要。 趋势和逆转:基于成交量差异和订单簿信息,Delta
Big Player Range
Thalles Nascimento De Carvalho
5 (2)
发现“BigPlayerRange”的力量:您在市场技术分析中的盟友 介绍 BigPlayerRange ,一款先进的技术分析工具,旨在揭示市场中机构投资者的兴趣区域。借助它,您可以精确地识别出主要市场参与者的活跃区域,并了解这如何影响您的交易策略。 主要特点: 机构兴趣区域的映射 : BigPlayerRange 突出显示机构投资者活动高的区域,为您提供有关市场潜在运动的宝贵见解。 退出参考的预测 : 该指标利用预测来建议两个阶段的可能退出,帮助您基于潜在的价格走势方向制定策略。 回调概率 : 评估价格返回到识别区域时的回调可能性。此功能有助于风险管理和策略调整。 如何使用 BigPlayerRange: 识别兴趣区域 : 使用该指标找出机构投资者活动频繁的区域,这对预测市场重大动向至关重要。 退出预测 : 根据指标提供的预测来决定退出时机,确保在关闭头寸时采取战略性的方法。 评估回调概率 : 监测价格回到兴趣区域时的回调机会,根据需要调整您的策略。 主要触发器:监控价格相对于绿色和红色线的位置 使用 BigPlayerRange 时,主要关注
Master OBV
Thalles Nascimento De Carvalho
MasterOBV:精准掌握市场趋势! MasterOBV 是一个 技术分析指标 ,结合了 成交量 、 正相关性 和 移动平均线(MA) ,以提高在金融市场中识别趋势的能力。 主要功能: 智能成交量: 分析交易量,以识别趋势强度的显著变化。 正相关性: 包括相关资产,以获得更广泛和准确的视角,基于对价格的位移潜力强化。 视觉通道: 利用视觉通道清晰准确地评估趋势的延续和反转潜力,提供直观的视觉分析。 平滑移动平均线: MA 平滑价格波动,使得识别主要趋势方向更加容易。 为什么选择 MasterOBV? 决策信心: 集成多个因素,帮助您自信地做出进出市场的决策。 全面分析: 不仅考虑价格,还考虑成交量、资产相关性和视觉通道,提供市场的完整视角。 价格位移潜力: 使用在同一方向移动的相关对,增强价格位移机会,最大化交易的影响力。 点击这里访问无限版
Smart Delta Volume
Thalles Nascimento De Carvalho
Smart Delta Volume:精准且适应动态市场条件 Smart Delta Volume 是一款先进的技术指标,旨在应对不断变化的市场环境,提供精准且适应性强的分析。该指标利用动态水平,根据市场波动性自动调整,为交易者提供更全面、更可靠的成交量与价格走势的互动视图。这种适应性对于寻求快速、准确见解的交易者来说尤为重要,尤其是在波动剧烈的市场中。 回调验证:减少虚假信号,提高交易信心 Smart Delta Volume 的一大功能是其回调验证器。当价格穿过两个动态水平时,该功能会自动触发,确认回调的有效性。这种客观的验证对于希望减少风险并避免虚假信号的交易者至关重要。通过验证回调,该指标提高了对所识别趋势的信心,使交易决策更加信息化和安全化。 为什么Smart Delta Volume对经验丰富的交易者至关重要? 凭借其准确识别交易机会的能力以及对不断变化的市场条件的适应性, Smart Delta Volume 成为经验丰富的交易者不可或缺的工具。趋势和回调的客观验证使其成为执行高概率策略的宝贵助手,有助于最大化利润并最小化风险。 主要优势: 动态且自
VolaMetrics VSA
Thalles Nascimento De Carvalho
VolaMetrics VSA | 技术分析中的强大助手 VolaMetrics VSA 是一种技术分析指标,结合了 Volume Spread Analysis (VSA) 方法论和详细的 交易量分析 。旨在 识别 和 跟踪重大价格变动 ,VolaMetrics VSA 利用 交易量 和 价格差 的互动,提供有价值的洞察,帮助做出交易决策。 Volume Spread Analysis (VSA) 的基础 Volume Spread Analysis (VSA) 是一种在技术分析中受到尊敬的方法,专注于理解 交易量 、 价格差(spread) 和 价格收盘 在特定时间段内的关系。VSA 基于这样一个理念,即最有信息的操盘手( 聪明的钱 )影响价格变动,通过识别 积累或分配信号 ,可以预测价格的重要变化。 VolaMetrics VSA 的工作原理 ️ VolaMetrics VSA 自动化了传统的 VSA 分析,提供了一个可靠的工具来 检测潜在的反转信号 或 趋势延续信号 。它分析 交易量 和 价格差 在多个周期中的表现,寻找可能指示重大机构活动的模式。 交易量分析
SwingVolumePro
Thalles Nascimento De Carvalho
总览 SwingVolumePro 是一个先进且多功能的指标,设计用于广泛的金融资产,并支持不同的交易风格。基于严格的成交量和价格分析开发,它提供清晰且准确的信号,使各级交易者能够根据高质量的数据做出明智的决策。 主要特点 多功能性: SwingVolumePro 可应用于各种资产,包括股票、外汇、加密货币等。它适用于不同的交易策略,从剥头皮到长期持有。 准确且可靠的信号: SwingVolumePro 侧重于提供高精度信号,采用复杂的技术识别价格吸收模式和市场攻击。这些信号以清晰的方式呈现,便于快速且有效的决策。 先进的成交量和价格分析: 该指标通过详细分析成交量与价格之间的互动,检测出努力与结果之间的差异,提示潜在的市场动向。 易于解释: 借助直观且友好的界面,SwingVolumePro 生成的信号易于理解,即使是经验较少的交易者也能轻松掌握。使用箭头来指示努力与结果的关系,使信息的读取更加直接。 与EA(智能交易系统)兼容 SwingVolumePro 设计时提供了技术支持,便于创建智能交易系统(EAs),从而简化交易策略的自动化。它提
CVD SmoothFlow Pro
Thalles Nascimento De Carvalho
CVD SmoothFlow Pro - 适用于任何资产的无限量分析! CVD SmoothFlow Pro 是寻求精确和无限量分析的交易者的终极解决方案。该专业版利用累计成交量 delta (CVD) 并结合高级噪声过滤,为交易任何金融资产提供所需的灵活性和精确度。 CVD SmoothFlow Pro 提供了什么? 清晰分析 :过滤市场噪声,突显任何金融资产中的重要成交量变动。 ️ 精确计算 :监测买卖差异,提供外汇、指数、加密货币等资产的成交量行为的详细视图。 直观界面 :提供易于理解和高效的分析,数据呈现清晰明了。 趋势识别 :更自信地识别市场趋势,帮助做出明智决策。 实际应用: 实时监测任何资产中买卖双方的平衡。 基于成交量识别趋势反转。 精确过滤,关注外汇、指数、加密货币等资产中的重要变动。 无限制的专业版! 专业版提供无限制的所有功能访问权限,让您能够对任何金融资产进行详细和无限量的分析。
筛选:
Alejandro Perez Gonzalez
225
Alejandro Perez Gonzalez 2024.09.02 20:21 
 

用户没有留下任何评级信息

Thalles Nascimento De Carvalho
6126
来自开发人员的回复 Thalles Nascimento De Carvalho 2024.09.02 20:43
Los fractales funcionan como preavisos, que pueden o no activarse, ayudando a mantener al trader atento al mercado. La entrada debe ser validada por la aceleración o desaceleración en el histograma rápido (en un timeframe menor). Además, el histograma rápido ofrece un análisis sobre la absorción de precio basada en el volumen. Los ejemplos están disponibles en las capturas de pantalla, junto con el paso a paso completo. Importante: ¡No opere exclusivamente basándose en las flechas (arrows)! Gracias por su feedback.
回复评论
版本 1.2 2024.09.01
已经添加了使用说明,并且指标已适应各种工具。