• Übersicht
  • Bewertungen (1)
  • Diskussion (5)
  • Neue Funktionen

VolumeSecret

VolumeSecret: Die Kraft des Volumens in Ihren Händen

In der herausfordernden Welt der Programmierung stehen wir ständig vor Hindernissen, die uns zum Wachsen und Weiterentwickeln zwingen. Wir verstehen die Schwierigkeiten, die der Markt mit sich bringt, und wissen, wie Trader darum kämpfen, die bestmögliche Leistung zu erzielen. Deshalb arbeiten wir unermüdlich an innovativen Lösungen, um Entscheidungsprozesse im Markt reibungsloser und präziser zu gestalten.

VolumeSecret ist das Ergebnis dieses Engagements. Dieser fortschrittliche Indikator kombiniert Volumenanalyse mit einer ausgeklügelten Strategie und bietet denen, die den Markt beherrschen wollen, einen entscheidenden Vorteil.

🔍 Was ist VolumeSecret?

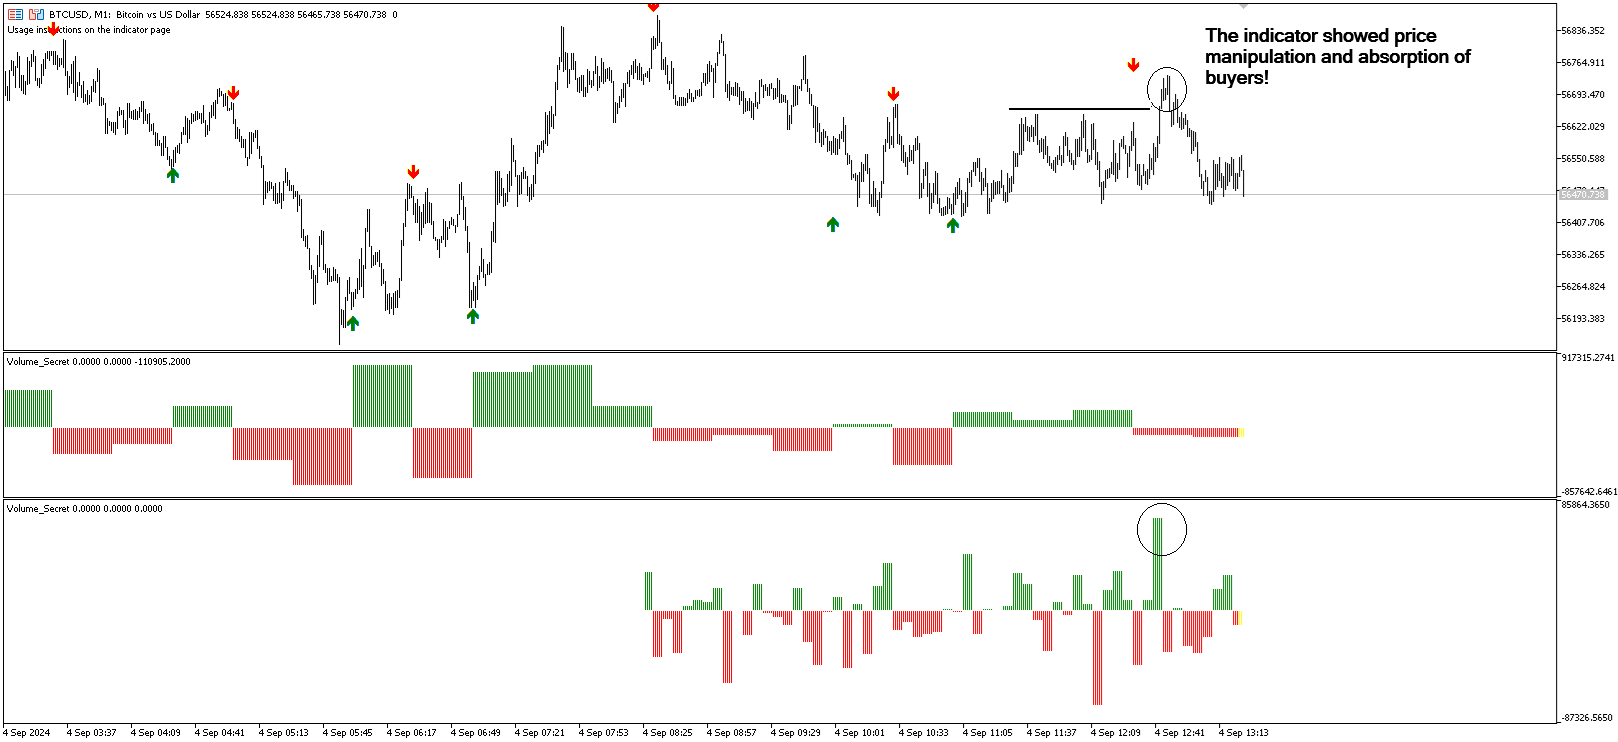
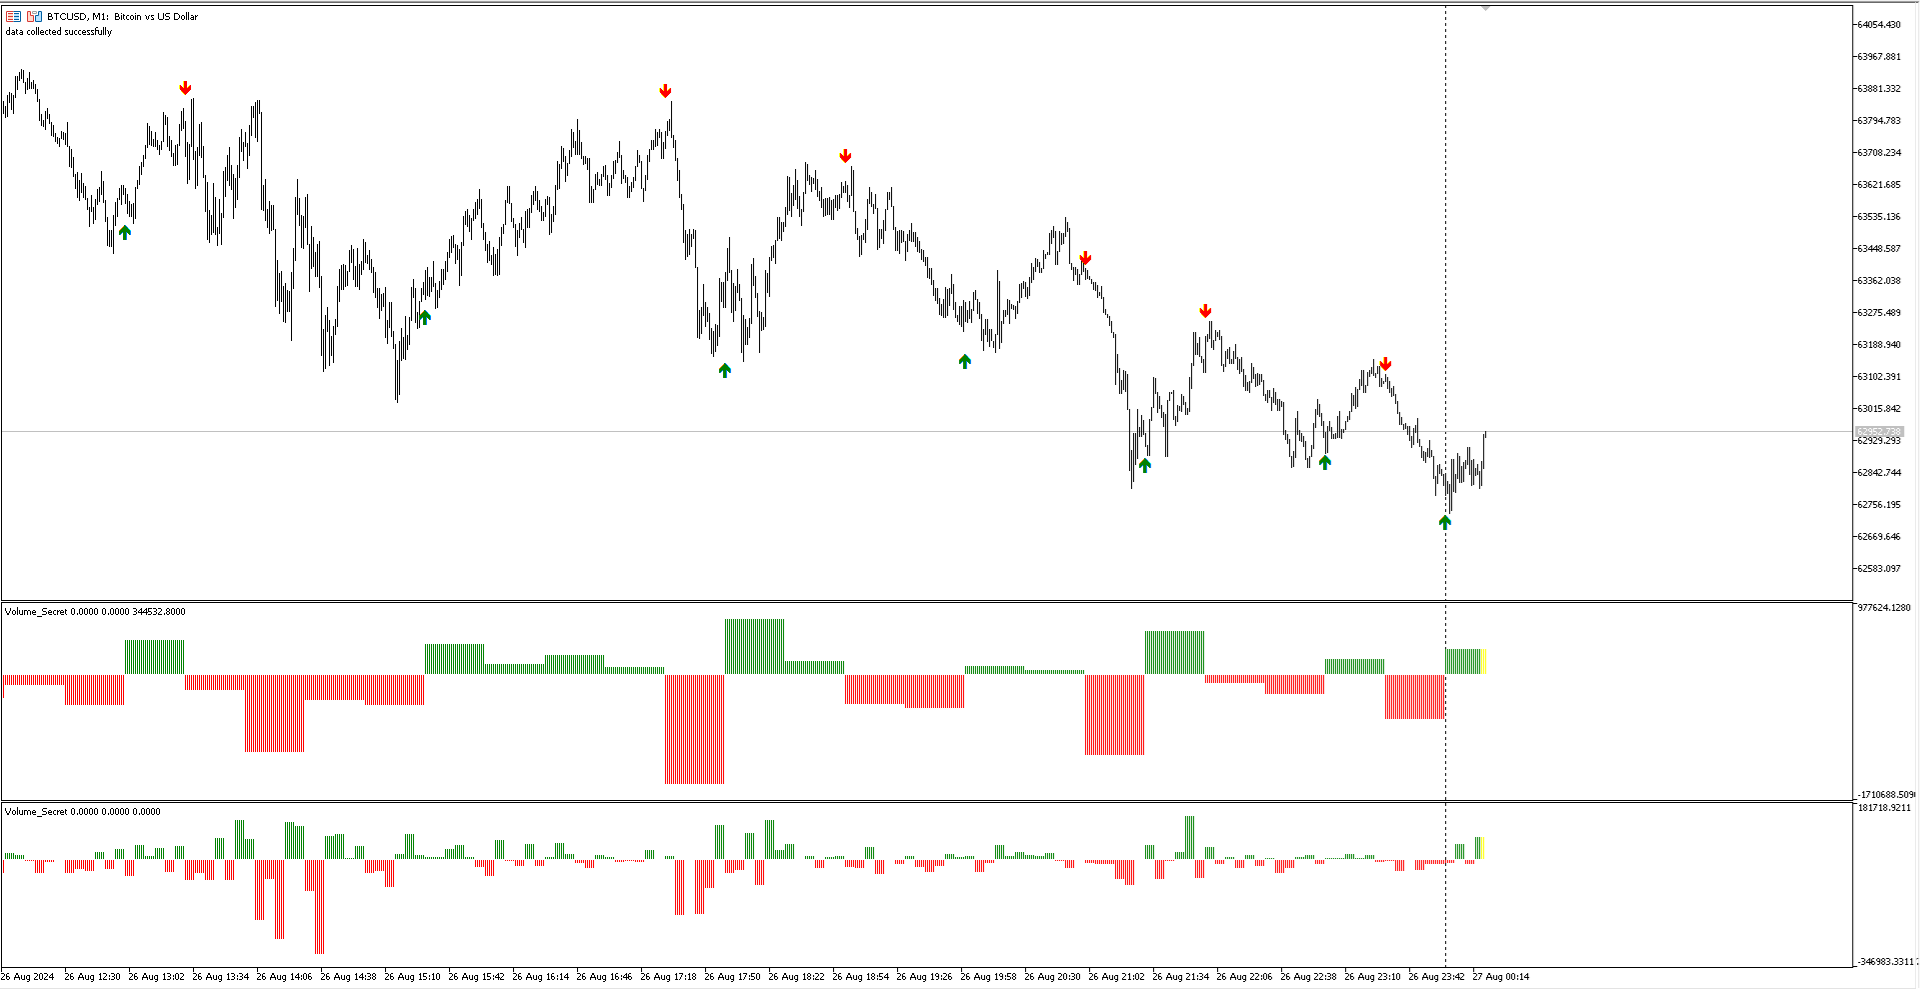
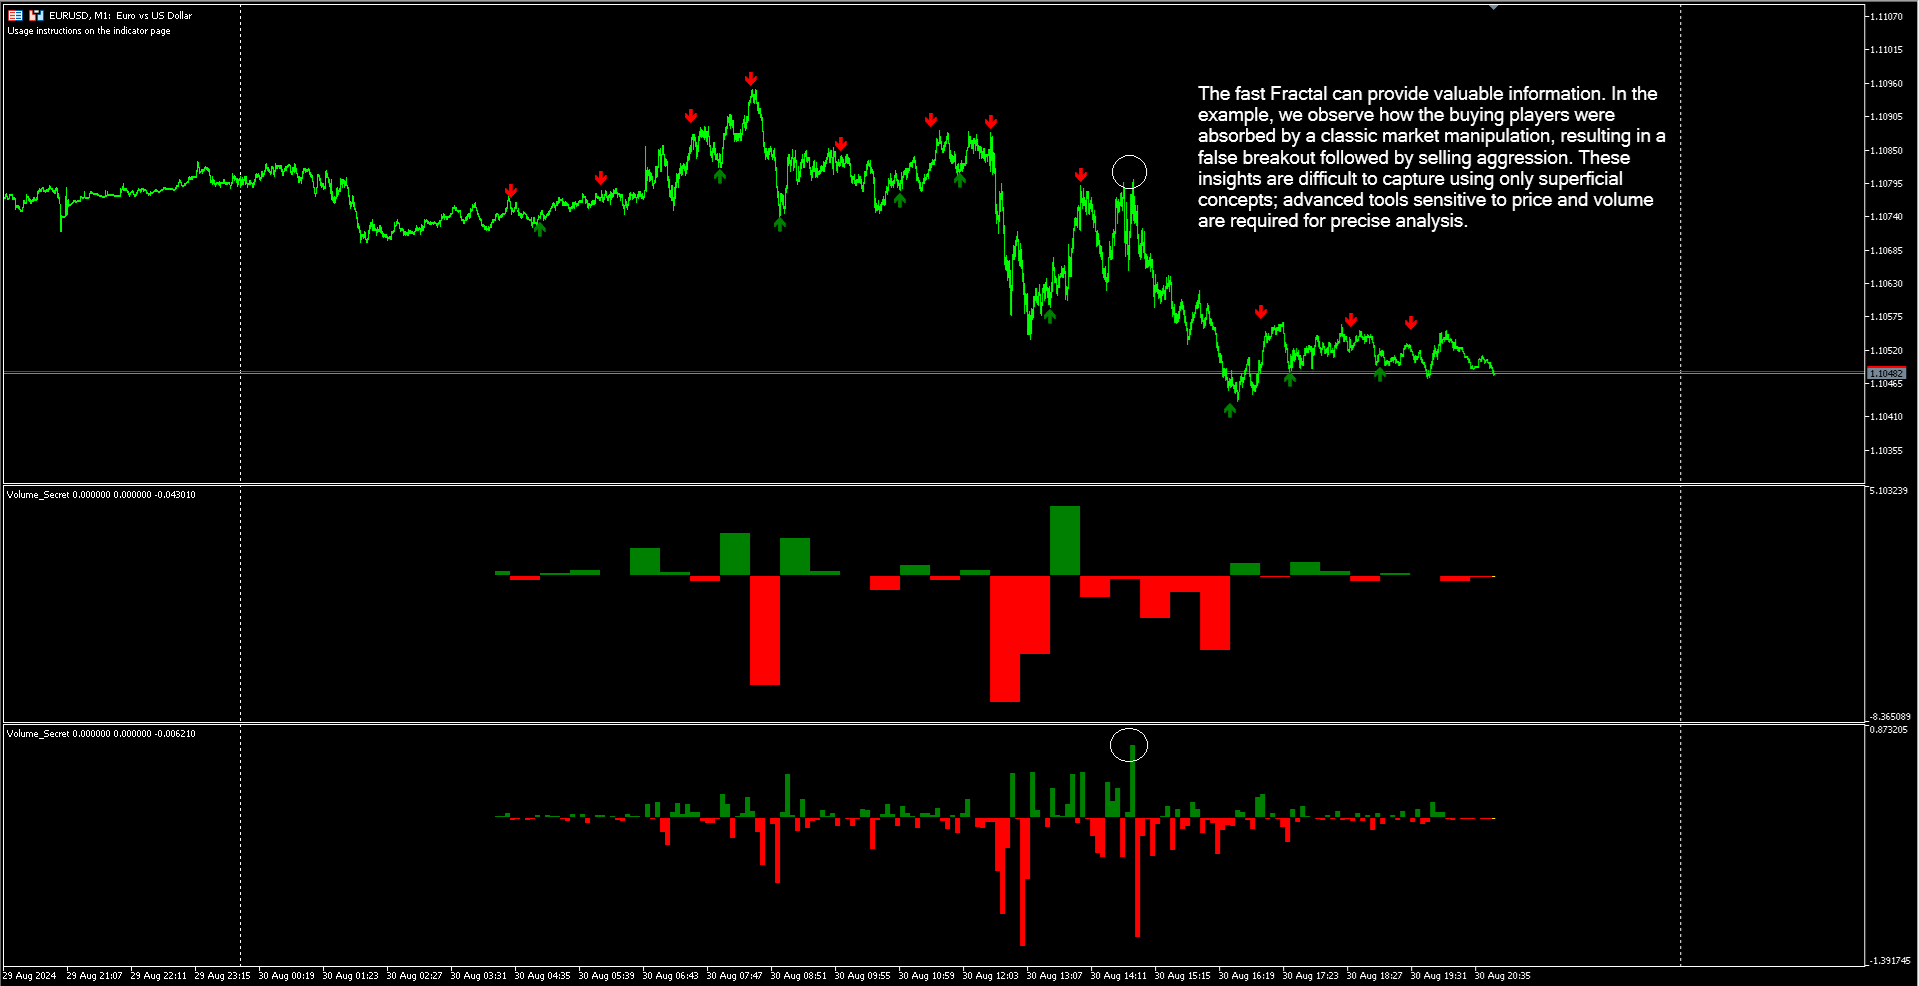
VolumeSecret ist ein hochmodernes technisches Indikator, das entwickelt wurde, um die Geheimnisse hinter den Kursbewegungen aufzudecken. Durch die Nutzung der Volumenanalyse als Kompass hilft es, Kauf- und Verkaufschancen mit hoher Präzision zu identifizieren. Es verwendet fraktale Geometrie und Volumen, um eine tiefe und detaillierte Analyse der Marktdynamik zu ermöglichen.

🚀 Vorteile von VolumeSecret

  • Tiefgehende Volumenanalyse: Erkennt institutionelle Bewegungen und versteckte Marktströme.
  • Präzise Signale: Bietet klare und objektive Alarme, um Ihre Trades zu optimieren.
  • Leistungsstarke Strategie: Kombiniert Volumen mit einer robusten Methodik zur Maximierung des Gewinnpotenzials.

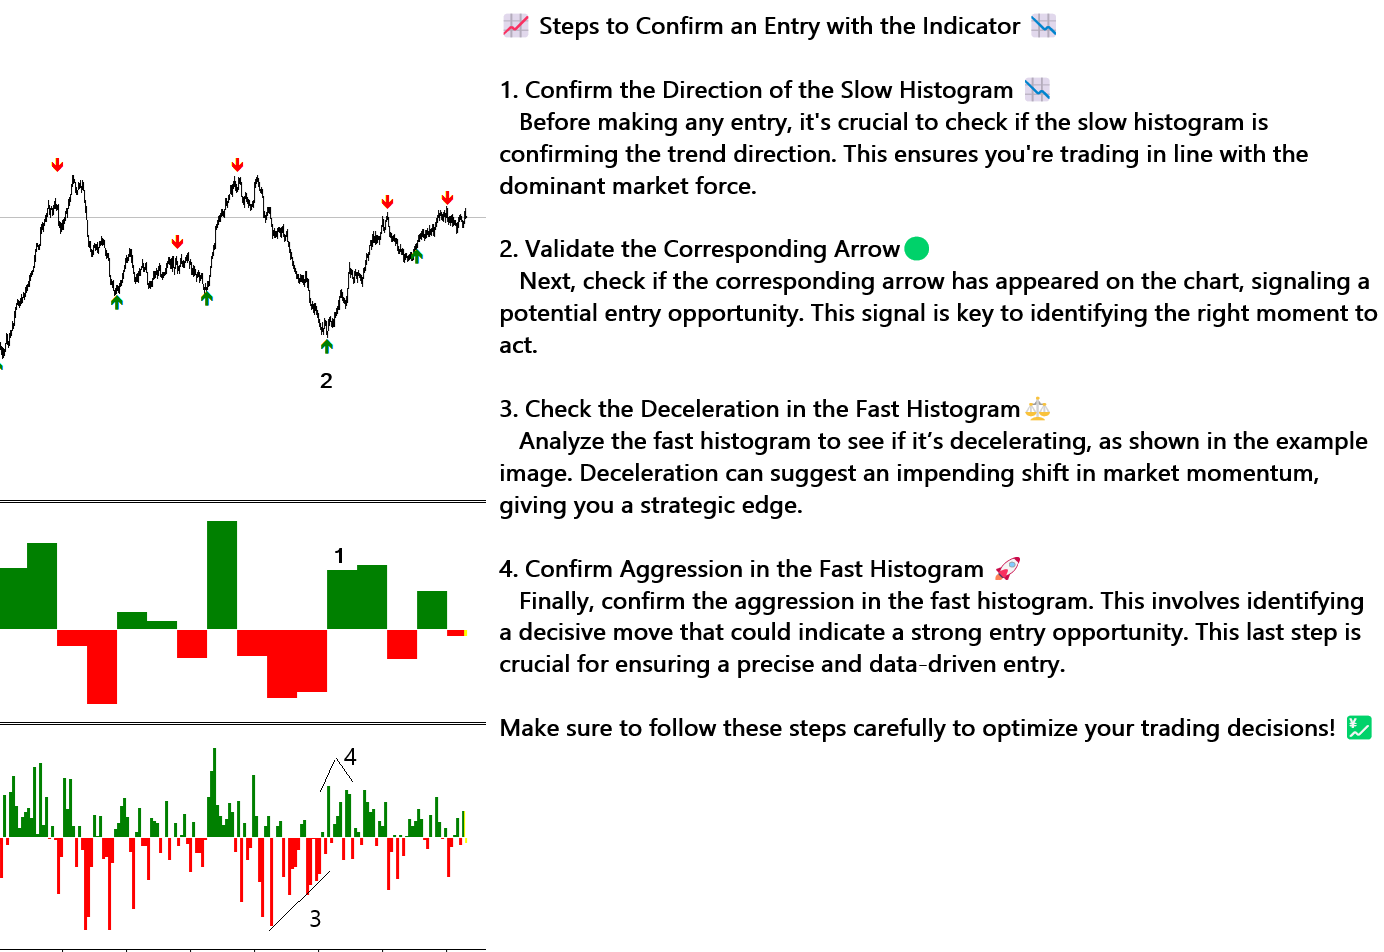
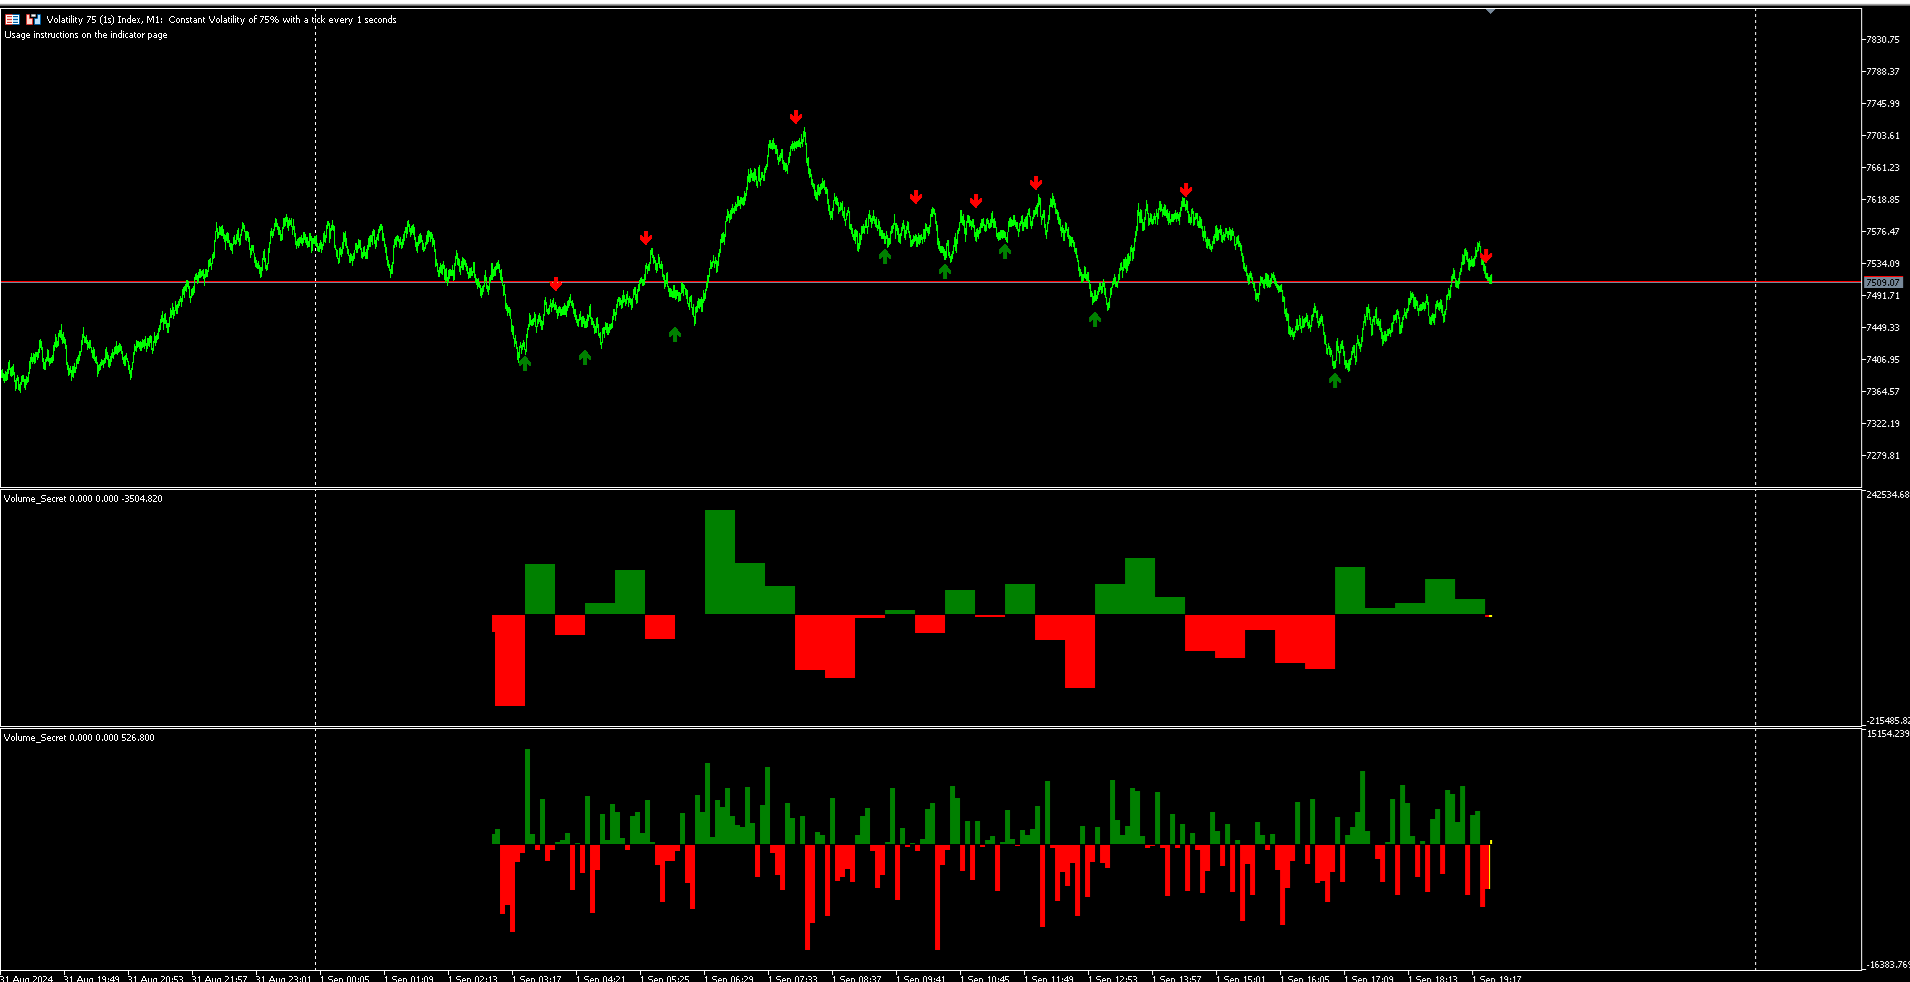
📈 Schritte zur Bestätigung eines Einstiegs mit VolumeSecret 📉

  1. Richtung des langsamen Histogramms bestätigen 📉
    Stellen Sie vor jedem Einstieg sicher, dass das langsame Histogramm die Trendrichtung bestätigt. So wird sichergestellt, dass Sie im Einklang mit der dominanten Marktkraft handeln.

  2. Überprüfen Sie den entsprechenden Pfeil 🟢
    Überprüfen Sie als Nächstes, ob der entsprechende Pfeil auf dem Chart erschienen ist, der eine potenzielle Einstiegsmöglichkeit signalisiert. Dieses Signal ist entscheidend, um den richtigen Moment zum Handeln zu erkennen.

  3. Verlangsamung im schnellen Histogramm überprüfen ⚖️
    Analysieren Sie das schnelle Histogramm, das in einem kleineren Zeitrahmen verwendet wird, um Anzeichen einer Verlangsamung zu erkennen. Dieses Histogramm zeigt frühzeitig, was im Makrobereich projiziert wird, basierend auf fraktalen Prinzipien, was Ihnen einen strategischen Vorteil verschafft.

  4. Aggressivität im schnellen Histogramm bestätigen 🚀
    Schließlich bestätigen Sie die Aggressivität im schnellen Histogramm. Dies beinhaltet die Identifizierung einer entscheidenden Bewegung, die auf eine starke Einstiegsmöglichkeit hinweisen könnte. Dieser letzte Schritt ist entscheidend, um einen präzisen, datenbasierten Einstieg sicherzustellen.

💰 Version 1.2: Jetzt kompatibel mit allen Finanzinstrumenten

In der Version 1.2 wurde VolumeSecret angepasst, um jede Art von Finanzinstrumenten zu analysieren und zu handeln, einschließlich Aktien, Forex, Kryptowährungen, Rohstoffe und mehr. Dieses Update verbessert die Vielseitigkeit des Indikators und ermöglicht eine optimierte Analyse in verschiedenen Märkten.

💬 Die Bedeutung Ihres Feedbacks

Ihr Feedback ist entscheidend für die kontinuierliche Verbesserung von VolumeSecret. Durch das Teilen Ihrer Erfahrungen helfen Sie uns, den Indikator weiter zu verfeinern und an die Bedürfnisse der Trader anzupassen. Zögern Sie nicht, Ihre Meinung und Vorschläge mitzuteilen, damit wir weiterhin das beste Werkzeug anbieten können!


Empfohlene Produkte
Stackable VWAP
Flavio Javier Jarabeck
3.5 (4)
Volume Weighted Average Price (VWAP) is a trading benchmark commonly used by Big Players that gives the average price a Symbol has traded throughout the day. It is based on both Volume and price. Additionally we put in this indicator the MVWAP (Moving Volume Weighted Average Price). For those who do not know the usage and the importance od this indicator I recommend a great article about this subject at Investopedia ( https://www.investopedia.com/articles/trading/11/trading-with-vwap-mvwap.asp
FREE
Functional in the Forex market. Functional in the B3 market - Bolsa Brasil Balcão. Motivation The technical Fibonacci retraction indicator for many is essential and the basis for all market movement forecasts. The name of the tool comes from the Italian mathematician Leonardo de Pisa (13th century). This DEMO version will work in Meta Trader with Demo and Strategy Tester. To purchase the Full version that works on a Real account, click on: https://www.mql5.com/en/market/product/38089
FREE
Midas VWAP
Paulo Henrique Faquineli Garcia
4 (1)
Volume Weighted Average Price (VWAP) is a trading benchmark commonly used by Big Players that gives the average price a Symbol has traded throughout the day. It is based on both Volume and price. This indicator contains Daily VWAP and MIDAS' VWAP, which means you are able to anchor the beggining of MIDAS' calculations and, therefore you will be able to use this methodology to study price versus volume moves after anchor point. You will be able to anchor up to 3 HIGH MIDAS VWAP's and 3 LOW. Wis
FREE
Necessary for traders: tools and indicators Waves automatically calculate indicators, channel trend trading Perfect trend-wave automatic calculation channel calculation , MT4 Perfect trend-wave automatic calculation channel calculation , MT5 Local Trading copying Easy And Fast Copy , MT4 Easy And Fast Copy , MT5 Local Trading copying For DEMO Easy And Fast Copy , MT4 DEMO Easy And Fast Copy , MT5 DEMO The homeopathic indicator is also called the CCI indicator. The CCI indicator was propos
FREE
This indicator uses a different approach from the previous version to get it's trendlines. This method is derived from Orchard Forex, and the process of making the indicator is demonstrated in there video   https://www.youtube.com/watch?v=mEaiurw56wY&t=1425s . The basic idea behind this indicator is it draws a   tangent line   on the highest levels and lowest levels of the bars used for calculation, while ensuring that the lines don't intersect with the bars in review (alittle confusing? I kno
FREE
VWAP Indicator
LUC JACOBUS A VERHEECKE
4.27 (22)
Volume Weighted Average Price (VWAP) The volume weighted average price (VWAP) is a  trading   benchmark  used by traders that gives the average price a security has traded at throughout the day, based on both volume and price. It is important because it provides traders with insight into both the trend and value of a security. This indicator VWAP V2 is free and is the manual version of the extended Easy VWAP indicator (30 Euro), where the date and time properties are automatically entered. With
FREE
FusionAlert StochRSI Master is an indicator available for MT4/MT5 platforms, it is a combination of RSI & Stochastic indicator which provide "alerts" when the market is inside "overbought and oversold" regions combined for both indicators, results in more precise and accurate signals to be used as a wonderful tool, in the form of "buy or sell" signals. This indicator comes with many customization options mentioned in the parameter section below, user can customise these parameters as needful. Jo
FREE
Value Chart Candlesticks
Flavio Javier Jarabeck
4.75 (8)
The idea of a Value Chart indicator was presented in the very good book I read back in 2020 , " Dynamic Trading Indicators: Winning with Value Charts and Price Action Profile ", from the authors Mark Helweg and David Stendahl. The idea is simple and the result is pure genius: Present candlestick Price analysis in a detrended way! HOW TO READ THIS INDICATOR Look for Overbought and Oversold levels. Of course, you will need to test the settings a lot to find the "correct" one for your approach.
FREE
Valable ZigZag MT5
Sergey Ermolov
4.79 (14)
MT4-Version  |  Trend Monitor VZ-Indikator  |  Owl Smart Levels-Indikator   |  Owl Smart Levels-Strategie  |   FAQ Die Elliott-Wellentheorie ist eine Interpretation von Prozessen an den Finanzmärkten, die auf einem visuellen Wellenmodell in den Preisdiagrammen beruht. Der Valable ZigZag Indikator zeigt die Wellenstruktur des Marktes an, auf die Sie sich verlassen können, um Handelsentscheidungen zu treffen. Der Valable ZigZag-Indikator ist stabiler und ändert seine Richtung nicht oft wie der kl
FREE
Rule Plotter Scanner
Francisco Gomes Da Silva
Hast du schon einmal daran gedacht, einen Scanner zu haben, der alle Strategien durchsucht und die Kauf- und Verkaufspunkte aller Zeiträume für dieses Asset gleichzeitig anzeigt? Genau das macht dieser Scanner. Dieser Scanner wurde entwickelt, um die Kauf- und Verkaufssignale anzuzeigen, die du im Rule Plotter: Strategieersteller ohne Programmierung erstellt hast, und sie in diesem Scanner auf verschiedenen Assets und Zeiträumen auszuführen. Die Standardstrategie des Rule Plotters besteht nur au
FREE
Hunt markets with Hunttern ZigZag . Easy to use with one parameter    You can use it for the following:       -Classic patterns       -Heads and shoulders       -Harmonic patterns       -Elliott Wave       -Support and resistance       -Supply and Demand Single parameter:      -Period (1-120) Features:        -Candle time        -Single parameter        -Light mode template This is version 1 of Hunttern ZigZag. We are very happy to receive feedback from you.
FREE
Full VWAP
Alexandre Borela
4.84 (31)
Wenn Sie dieses Projekt mögen, hinterlassen Sie eine 5-Sterne-Bewertung. Folgen Sie instagram: borelatech Volumengewichtete Durchschnittspreise sind das Verhältnis des gehandelten Wertes zum Gesamtvolumen über einen bestimmten Zeithorizont gehandelt. Es ist ein Maß für den Durchschnittspreis zu die über den Handelshorizont gehandelt wird. VWAP wird häufig als Trading-Benchmark von Investoren, die so passiv wie möglich in ihrer Ausführung. Mit diesem Indikator können Sie die VWAP für: Akt
FREE
Cybertrade Keltner Channels
Emanuel Andriato
4.75 (4)
Cybertrade Keltner Channels - MT5 Created by Chester Keltner, this is a volatility indicator used by technical analysis. It is possible to follow the trend of financial asset prices and generate support and resistance patterns. In addition, envelopes are a way of tracking volatility in order to identify opportunities to buy and sell these assets. It works on periods longer than the period visible on the chart. All values ​​are available in the form of buffers to simplify possible automations.
FREE
QuantumAlert Stoch Navigator is a free indicator available for MT4/MT5 platforms, its work is to provide "alerts" when the market is inside "overbought and oversold" regions in the form of "buy or sell" signals. This indicator comes with many customization options mentioned in the parameter section below, user can customise these parameters as needful. Join our   MQL5 group , where we share important news and updates. You are also welcome to join our private channel as well, contact me for the p
FREE
Bar Color Trend
Germano Chagas
4.5 (6)
Combining the best of Price Action , Directional Movement , and Divergence/Convergence analysis, Candle Color Trend is a easy and reliable way to identify trend direction. The indicator automatically paints the candles according to the assumption that an uptrend is defined by prices that form a series of higher highs and higher lows. In contrast, a downtrend is defined by prices that form a series of lower highs and lower lows. Additionally, ADX Wilder indicator is used to measure trend weakness
FREE
MIDAS Super VWAP
Flavio Javier Jarabeck
4.44 (9)
Imagine VWAP, MVWAP and MIDAS in one place... Well, you found it! Now you can track the movement of Big Players in various ways, as they in general pursue the benchmarks related to this measuring, gauging if they had good execution or poor execution on their orders. Traders and analysts use the VWAP to eliminate the noise that occurs throughout the day, so they can measure what prices buyers and sellers are really trading. VWAP gives traders insight into how a stock trades for that day and deter
FREE
VWAP and MVWAP
Flavio Javier Jarabeck
4 (5)
Volume Weighted Average Price (VWAP) is a trading benchmark commonly used by Big Players that gives the average price a Symbol has traded throughout the day. It is based on both Volume and price. Additionally we put in this indicator the MVWAP (Moving Volume Weighted Average Price). For those who do not know the usage and the importance od this indicator I recommend a great article about this subject at Investopedia ( https://www.investopedia.com/articles/trading/11/trading-with-vwap-mvwap.asp )
FREE
Strong movement levels
Nikolay Mitrofanov
5 (2)
Looks for strong price movements and draws levels upon their completion. You determine the strength of the movement yourself by specifying in the settings the number of points and the number of candles of the same color in a row in one direction. There are 2 types of building in the settings: extrenum - high / low close - close price You can also adjust the number of displayed levels and the number of candles for calculations. By default, the settings indicate 5 levels for 360 candles.
FREE
TilsonT3
Jonathan Pereira
Tillson's T3 moving average was introduced to the world of technical analysis in the article ''A Better Moving Average'', published in the American magazine Technical Analysis of Stock Commodities. Developed by Tim Tillson, analysts and traders of futures markets soon became fascinated with this technique that smoothes the price series while decreasing the lag (lag) typical of trend-following systems.
FREE
White Weis Volume Ticks
Ricardo Almeida Branco
5 (3)
White Weis Volume This indicator shows the sum of the volume in each wave, bulish or bearish, as idealized by David Weis , but it brings an important addition , which is the marking of the bar with the highest volume of the wave (White Bar)! In coding the indicator, it was sought to optimize the code to require minimal processing during use and not to overload mt5. The indicator can be used for pre-trading analysis and study, where the trader analyzes possible points of support and resi
Graphic Alignment Context
Ricardo Alexandre Laurentino
The Graphic Alignment Context (GAC) Technical Indicator measures the vertical difference of the simple average price of a financial instrument in the context of three different timeframes determined by a defined number of bars or candles (periods) to determine the strength of the buy or sell trend. sale. Ascending average prices indicate Buying strength (1), Descending average prices indicate Selling strength (-1) and any scenario different from the previous two conditions indicates Neutrality
FREE
This is a buyer and seller aggression indicator that analyzes the shape of each candle and project this data in a histogram form. There are 4 histograms in one. On the front we have two: Upper - Buyer force. Lower - Seller force. At the background we also have two histogram, both with same color. They measure the combined strenght of buyers and sellers. This histograms can be turned off in Input Parameters. It is also possible to have the real or tick volume to help on this force measurement. IN
FREE
WaveTrend Plus
Nguyen Thanh Cong
5 (3)
Introduction WaveTrend Plus is an amazing oscillator that can detect optimal entry points in the market with high precision using complex computations of price and momentum. This version packs many improvements compared to the original WaveTrend such as cleaner visuals, oversold/overbought signals and divergence detection Signal Buy when oversold signal appear (green dot below) or when a bullish divergence is detected (green dashed line) Sell when overbought signal appear (red dot ab
FREE
Simple Weis Wave
Jean Jacques Huve Ribeiro
3.67 (3)
One of the best tools for analyzing volume, Weis Wave was idelized by David Weis, to facilitate the reading of directional flow. For the VSA method disciples it is an evolution of the practices created by Richard Wycoff, facilitating a predictive reading of the market, always seeking an accumulation and distribution of the negotiated contracts. Cumulative wave volume  Range of wave ( removed) Average Wave volume Ref "Tim Ord lectures" ( removed)
FREE
The Market Thermometer can be used to help traders identify sleepy or turbulent periods. It helps beginners to check when is the ideal time to enter operations, that is, when the value of the thermometer is below its average for several periods, identifying a peaceful market. When the market is heated, that is, the thermometer is above three times its average, it is time to make profits. The Thermometer measures the extent to which the end of a period, maximum or minimum price, projects outsi
FREE
Donchian Pro
Paulo Henrique Faquineli Garcia
5 (2)
The Donchian Channel Channels are among the most popular tools of technical analysis, as they visually convey to the analyst the limits within which most price movement tends to occur. Channel users know that valuable information can be obtained at any time, whether prices are in the central region of a band or close to one of the border lines. One of the best known techniques to explore these concepts is Bollinger Bands. However, John Bollinger was not the only one to research the applicatio
FREE
Coiote Volume Candle
Alexandre Moraes De Souza Lima
Candle de Volume Coiote O Candle de Volume  Coiote é um indicador que mede a variação do volume no tempo, seu corpo é pela variação do volume anterior pelo volume atual, sua direção pelo fechamento do preço. 1. identificado um topo no indicador Candle de Volume  Coiote (marcado o fechamento do preço). 2. identificado um fundo no indicador Candle de Volume Coiote (marcado o fechamento do preço). 3. fundo 3 igual fundo 2 no indicador Candle de Volume Coiote, preço no 3 é diferente de fundo 2
FREE
Quantitative Candlesticks Qstick
Flavio Javier Jarabeck
4 (2)
Qstick is a way to objectively quantify candlestick analysis and improve the interpretation of candlestick patterns. Qstick was developed by Tushar Chande and published in his book " The New Technical Trader - Boost Your Profit by Plugging Into the Latest Indicators (1994) ". Qstick is built based on a moving average of the difference between the Open and Close prices. The basis of the idea is that the Opening and Closing prices are the heart of candlestick analysis. We strongly recommend the re
FREE
This indicator sums up the difference between the sells aggression and the buys aggression that occurred in each Candle, graphically plotting the waves of accumulation of the aggression volumes.   Through these waves an exponential average is calculated that indicates the direction of the business flow. Note: This indicator DOES NOT WORK for Brokers and/or Markets WITHOUT the type of aggression (BUY or SELL).   Be sure to try our Professional version with configurable features and alerts:  Agr
FREE
Free automatic Fibonacci is an indicator that automatically plots a Fibonacci retracement based on the number of bars you select on the BarsToScan setting in the indicator. The Fibonacci is automatically updated in real time as new highest and lowest values appears amongst the selected bars. You can select which level values to be displayed in the indicator settings. You can also select the color of the levels thus enabling the trader to be able to attach the indicator several times with differe
FREE
Käufer dieses Produkts erwarben auch
Atomic Analyst MT5
Issam Kassas
4.56 (18)
Zunächst einmal ist es erwähnenswert, dass dieser Handelsindikator nicht neu malt, nicht neu zeichnet und keine Verzögerung aufweist, was ihn sowohl für manuellen als auch für Roboterhandel ideal macht. Benutzerhandbuch: Einstellungen, Eingaben und Strategie. Der Atom-Analyst ist ein PA-Preisaktionsindikator, der die Stärke und das Momentum des Preises nutzt, um einen besseren Vorteil auf dem Markt zu finden. Ausgestattet mit fortschrittlichen Filtern, die helfen, Rauschen und falsche Signale z
Zunächst einmal ist es wichtig zu betonen, dass dieses Handelssystem ein Nicht-Repainting-, Nicht-Redrawing- und Nicht-Verzögerungsindikator ist, was es sowohl für manuelles als auch für automatisches Trading ideal macht. Online-Kurs, Handbuch und Vorlagen herunterladen. Das "Smart Trend Trading System MT5" ist eine umfassende Handelslösung, die für neue und erfahrene Trader maßgeschneidert ist. Es kombiniert über 10 Premium-Indikatoren und bietet mehr als 7 robuste Handelsstrategien, was es zu
TPSpro RFI Levels MT5
Roman Podpora
4.67 (9)
Umkehr der ersten Impulsniveaus (RFI)       ANWEISUNGEN       Russland       -        ENG    Die Empfehlung basiert auf dem Indikator -   TPSpro   TREND PRO -   Version MT5 Die wichtigsten Elemente in der Branche sind entweder in Zonen oder in der Fabrik enthalten, oder sie führen zu einer Lösung bei einem Kauf oder dem Verkauf eines anderen Instruments. Wenn viele Menschen ihre Rechte nicht auf dem Händlerkonto verschlüsseln, werden die Folgen nicht schnell genug sein. Ich habe es damit abgesch
Bill Williams Advanced
Siarhei Vashchylka
5 (8)
Bill Williams Advanced is designed for automatic chart analysis using Bill Williams' "Profitunity" system. The indicator analyzes four timeframes at once. Manual (Be sure to read before purchasing) Advantages 1. Automatically analyzes the chart using the "Profitunity" system of Bill Williams. The found signals are placed in a table in the corner of the screen. 2. Equipped with a trend filter based on the Alligator indicator. Most of the system signals are recommended to be used only accordi
TrendMaestro5
Stefano Frisetti
note: this indicator is for METATRADER4, if you want the version for METATRADER5 this is the link:  https://www.mql5.com/it/market/product/108106 TRENDMAESTRO ver 2.4 TRENDMAESTRO recognizes a new TREND in the bud, he never makes mistakes. The certainty of identifying a new TREND is priceless. DESCRIPTION TRENDMAESTRO identifies a new TREND in the bud, this indicator examines the volatility, volumes and momentum to identify the moment in which there is an explosion of one or more of these data a
Introduction to X3 Chart Pattern Scanner X3 Cherart Pattern Scanner is the non-repainting and non-lagging indicator detecting X3 chart patterns including Harmonic pattern, Elliott Wave pattern, X3 patterns, and Japanese Candlestick patterns. Historical patterns match with signal patterns. Hence, you can readily develop the solid trading strategy in your chart. More importantly, this superb pattern scanner can detect the optimal pattern of its kind. In addition, you can switch on and off individu
IVISTscalp5
Vadym Zhukovskyi
5 (5)
Wir stellen Ihnen den iVISTscalp5-Indikator vor, der nicht nur einzigartig, sondern auch effektiv im Handel ist. Dieser Indikator basiert auf Zeitdaten und ist das Ergebnis jahrelanger Erfahrung und eingehender Analyse der Finanzmärkte. Der iVISTscalp5-Indikator ist ein ausgezeichnetes Werkzeug für manuellen Handel. Bequemlichkeit, Einfachheit und Visualisierung - die gesamte Komplexität ist verborgen. Wir haben die Einstellungen und Verwendung des iVISTscalp5-Indikators auf das Maximum vereinfa
Elliott Wave Trend was designed for the scientific wave counting. This tool focuses to get rid of the vagueness of the classic Elliott Wave Counting using the guideline from the template and pattern approach. In doing so, firstly Elliott Wave Trend offers the template for your wave counting. Secondly, it offers Wave Structural Score to assist to identify accurate wave formation. It offers both impulse wave Structural Score and corrective wave Structure Score. Structural Score is the rating to sh
Dragon Multi Indicator MT5
Mansour Babasafary
5 (5)
3 Indicators in 1 indicator Strategy based on price action Made specifically for the best forex currency pairs Can be used in the best time frame of the market at a very reasonable price This indicator is basically 3 different indicatos . But we have combined these 3 indicators in 1 indicator so that you can use 3 indicators at the lowest price. All three strategies are based on price action. But based on different trends. Long term, medium term and short term Attributes : No repaintin
FxaccurateLS
Shiv Raj Kumawat
WHY IS OUR FXACCCURATE LS MT5 THE PROFITABLE ? PROTECT YOUR CAPITAL WITH RISK MANAGEMENT Gives entry, stop and target levels from time to time. It finds Trading opportunities by analyzing what the price is doing during established trends. POWERFUL INDICATOR FOR A RELIABLE STRATEGIES We have made these indicators with a lot of years of hard work. It is made at a very advanced level. Established trends provide dozens of trading opportunities, but most trend indicators completely ignore them!
The SuperTrend MTF indicator is an excellent trend tracking indicator . It can not only display SuperTrend trends within the timeframe of the chart, but also set up to display SuperTrend trends for larger time frames simultaneously . This will be beneficial for grasping trends at a larger time scale and predicting future trends . At the same time, the price of the trend line can also be displayed at a glance, making it easy to observe. Input parameters :  ATR period used at chart timeframe 
Elliot Waves Analyzer Pro
Viktor Weidenthal
2.67 (3)
Elliot Waves Analyzer Pro calculates Elliot Waves to Help Identify Trend direction and Entry Levels. Mainly for Swing Trading Strategies. Usually one would open a Position in trend direction for Wave 3 or a Correction for Wave C . This Indicator draws Target Levels for the current and next wave. Most important Rules for Elliot Wave Analysis are verified by the Indicator.  The Pro version analyzes Multiple Timeframes and shows the Subwaves and Target-Levels.   For an Overview  " Elliot Waves Anal
Introducing the South African Sniper indicator created by a small group of traders with a few years trading trading the financial market profitably . This is a plug and play indicator that provides you with  BUY and SELL (SNIPER ENTRY) signals with TARGET and trail stops. The indicator Works with all MT5 trading instruments. The indicator uses previous  chart data as receipt to speculate on future market moves.  "The South African Sniper indicator community are very happy with the indicator an
VTrende Pro
Andrii Diachenko
5 (1)
VTrende Pro - MTF indicator for trend trading with a display panel for MT5 *** Videos can be translated into any language using subtitles (video language - Russian) Although the signals of the VTrende Pro indicator can be used as signals of a full-fledged trading system, it is recommended to use them in conjunction with the Bill Williams TS. VTrende Pro is an extended version of the VTrende indicator. Difference between Pro version and VTrende: - Time zones - Signal V - signal 1-2 waves
Piranha version 2
Maria Strudov
5 (1)
"Piranha" - an autonomous trading system that determines overbought and oversold levels on the chart. Red and blue zones represent overbought and oversold levels respectively. Entry points are marked with arrows: a downward arrow in the red zone for "sell" and an upward arrow in the blue zone for "buy". The Take profit level is indicated by the green moving average. Key features: Adjusting the Take profit level as the green moving average changes position. Averaging ability when a new market e
Golden Gate Algo MT5
James David Lane
4 (6)
40% RABATT ZU WEIHNACHTEN! PREISERHÖHUNG AUF $250 AM 1. JANUAR! Vorstellung von GoldenGate Entries: Eine hochmoderne Handelslösung! Entdecken Sie einen revolutionären Ansatz zum Handel mit GoldenGate Entries (GGE), einem fortschrittlichen Indikator, der entwickelt wurde, um Ihr Handelserlebnis zu verbessern. GGE bietet eine umfassende Palette von Funktionen, um Benutzer mit Präzision und Vertrauen in ihren Handelsentscheidungen auszustatten. Paare: Beliebig (FX - Rohstoffe - Aktien - Akti
SMCpro
Arief
5 (1)
Currently Price  20% OFF  ( for unlimited use ) Indicator   USER MANUAL , trade setups, solving issues, etc :  Direct Download Here     (  for users only  ) Hello World! Introducing.. SMCpro tool and Indicator for  MetaTrader 5 , a cutting-edge feature designed to revolutionize your trading experience. With innovative ICT Smart Money Concept, you gain unparalleled insight into market dynamics, empowering you to make informed trading decisions like never before. SMC Indicator built on th
The iChannels
BeeXXI Corporation
5 (1)
Ultra-fast recognition of parabolic channels (as well as linear, horizontal and wavy channels) throughout the depth of history, creating a hierarchy of channels. Required setting: Max bars in chart: Unlimited This indicator is designed primarily for algorithmic trading, but can also be used for manual trading.  This indicator will have a very active evolution in the near future and detailed descriptions on how to apply to create robots
Introducing the Power Trade Plus indicator designed by a small group of traders with a few years of experience trading the market profitably.  The Power Trade Plus is derived from the Power Trade indicator,  the indicator strive in powerful sniper entries and take profit levels,  with an algorithm that's can determine the markets volatility and Provides entries based on the current market volatility. This indicator is much more effective in stock ,currencies and indices.
How to use Pair Trading Station Pair Trading Station is recommended for H1 time frame and you can use it for any currency pairs. To generate buy and sell signal, follow few steps below to apply Pair Trading Station to your MetaTrader terminal. When you load Pair Trading Station on your chart, Pair Trading station will assess available historical data in your MetaTrader platforms for each currency pair. On your chart, the amount of historical data available will be displayed for each currency pai
Der Precision Index Oscillator (Pi-Osc) von Roger Medcalf von Precision Trading Systems Version 2 wurde sorgfältig neu codiert, um extrem schnell auf Ihrem Chart geladen zu werden, und es wurden einige andere technische Verbesserungen eingearbeitet, um die Erfahrung zu verbessern. Pi-Osc wurde entwickelt, um genaue Handelstimingsignale bereitzustellen, die darauf abzielen, extreme Erschöpfungspunkte zu finden, an die die Märkte gezwungen werden, um einfach die Stops aller herauszunehmen.
Matreshka
Dimitr Trifonov
5 (1)
Matreshka self-testing and self-optimizing indicator: 1. Is an interpretation of the Elliott Wave Analysis Theory. 2. Based on the principle of the indicator type ZigZag, and the waves are based on the principle of interpretation of the theory of DeMark. 3. Filters waves in length and height. 4. Draws up to six levels of ZigZag at the same time, tracking waves of different orders. 5. Marks Pulsed and Recoil Waves. 6. Draws arrows to open positions 7. Draws three channels. 8. Notes support and re
PTS - Divergence Buy Finder von Precision Trading Systems Der Precision Divergence Finder wurde entwickelt, um Markt-Tiefpunkte mit höchster Genauigkeit zu finden und tut dies häufig. In der technischen Analyse ist das Aufspüren von Tiefpunkten im Allgemeinen viel einfacher als das Aufspüren von Höchstpunkten. Dieses Tool wurde genau für diese Aufgabe entwickelt. Nachdem eine bullische Divergenz identifiziert wurde, ist es ratsam, auf die Trendwende zu warten, bevor Sie kaufen. Sie können e
[ MT4 Version ] Only the next 10 units at current price! Final price: $299 Are you tired of spending months on demo or live accounts to test your trading strategies? The Backtesting Simulator is the ultimate tool designed to elevate your backtesting experience to new heights. Utilizing Metatrader historical symbol information, it offers an unparalleled simulation of real market conditions. Take control of your testing speed, test ideas quickly or at a slower pace, and witness remarkable improve
Good day! I present to you a trading technical indicator for Deriv broker synthetic indices. This indicator ONLY works with the following indices: Boom 300 Index Boom 500 Index Boom 1000 Index Crash 300 Index Crash 500 Index Crash 1000 Index The indicator was created to give signals to open medium-term trades in the direction of Spikes. But you can open trades in the opposite direction to Spikes, at your own risk. Trade only on M1. Other TFs do not guarantee the correct operation of the indic
Go Way TREND
Ywsf Hsyn Hmad Alrsh
Gehen Sie mit dem Trend. Ja, warten Sie in einem 15-Minuten-Frame auf das Einstiegssignal, ob Kauf oder Verkauf, und überprüfen Sie das Signal, wenn es in einem 30-Minuten-Frame erscheint (manchmal dauert es eine Stunde oder länger, bis das Signal erscheint. Sie können zurückkehren Gehen Sie zum 15-Minuten-Rahmen und kehren Sie zum 30-Minuten-Rahmen zurück und wiederholen Sie dies, bis das Hauptsignal für Sie erscheint. Wenn das Signal im 30-Minuten-Rahmen erscheint, steigen Sie mit dem Preis e
Scalping Tool for Deriv Description: This trading indicator is designed for traders specializing in scalping. It provides signals for trading in the direction of short-term price movements. The indicator is optimized for use on the M1 timeframe and supports Boom and Crash indices (300, 500, 1000). The indicator will be sold in a limited quantity. Features: Trading direction: towards short-term price movements. Filters and indicators: Reaction volume indicator: displays activity zones. Trend i
The Volume Spread Analysis indicator is based on the original Volume Spread Analysis method. It was designed for quick and easy recognition of VSA patterns. Even though this indicator looks very simple, it is the most sophisticated tool we've ever made. It is a really powerful analytical tool that generates very reliable trading signals. Because it is very user-friendly and understandable, it is suitable for every type of trader, regardless of his experience. What is VSA? VSA - Volume Spread
All in One package includes the  Oscillator Predictor ,  MACD Predictor ,  Thrust Scanner  and  Advanced Fibonacci  indicators which are mandatory for applying  Dinapoli  trade plans.  Please visit below links for detailed explanations of indicators. Advanced Fibonacci Indicator =>  https://www.mql5.com/en/market/product/107933 Thrust Scanner Indicator =>  https://www.mql5.com/en/market/product/52829 Overbought /Oversold Predictor indicator => https://www.mql5.com/en/market/product/52628 Macd
Weitere Produkte dieses Autors
Box Weis Wave
Thalles Nascimento De Carvalho
5 (1)
Verbessern Sie Ihre Analyse mit dem Weis Wave Box! Wenn Sie Präzision und Klarheit in Ihrem Handel suchen, ist der Weis Wave Box das Werkzeug, das Sie benötigen. Dieser fortschrittliche Indikator bietet eine detaillierte visuelle Analyse von Volumenwellen und Swing-Punkten und hilft Ihnen, die Beziehung zwischen Aufwand und Ergebnissen auf dem Markt besser zu verstehen. Hauptmerkmale des Weis Wave Box: Anpassbare Volumenwellen: Passen Sie die Volumenwellen in Ticks an Ihre Handelsstrateg
AI Channel
Thalles Nascimento De Carvalho
4 (4)
Einleitung: Willkommen zur Präsentation des AI Channel Indikators, einem leistungsstarken Tool, das künstliche Intelligenz für die Analyse von Preisbereichen auf dem Finanzmarkt verwendet. In dieser Sitzung werden wir erforschen, wie dieser revolutionäre Indikator Anlegern und Händlern dabei helfen kann, fundiertere und strategischere Entscheidungen zu treffen. Fangen wir an! I. Was ist der AI Channel Indikator? AI Channel ist ein Indikator, der auf fortschrittlichen künstlichen Intelligenzalgor
FREE
Swing Point Volume
Thalles Nascimento De Carvalho
Swing Point Volume, the indicator that signals weakness and strength at the tops and bottoms. This indicador can be for used the Wyckoff Method. Information provided; - Swing on customized ticks. - Volume and points in each balance sheet. - Percentage of Displacement. - Sound alert option on top and bottom breaks. - Volume in ticks and Real Volume. - Volume HL (extreme) or (opening and closing) - Customized volume shapes.
Atr Projection
Thalles Nascimento De Carvalho
O Indicador ATR Projeção destaca-se como uma ferramenta robusta na análise técnica, projetada para fornecer insights precisos sobre os limites potenciais de movimentação dos preços no mercado financeiro. Sua abordagem flexível permite aos usuários customizar as métricas de análise de forma intuitiva, adaptando-se às necessidades específicas de cada ativo operado. Funcionamento Personalizável: Por padrão, o ATR Projeção opera considerando 30% da média dos últimos 100 candles. Essa flexibili
Long Short Pro
Thalles Nascimento De Carvalho
Long & Short Indikator - Pro Version: Entfesseln Sie das unbegrenzte Potenzial Ihrer Marktanalyse! Keine Einschränkungen für Alle Assets Die Pro-Version des Long & Short Indikators bietet Ihnen die völlige Freiheit, ihn auf jedem Finanzinstrument zu verwenden. Keine Einschränkungen mehr – wenden Sie denselben Indikator auf all Ihren bevorzugten Assets an! Keine Einschränkungen Genießen Sie alle Funktionen des Indikators ohne jegliche Einschränkungen. Die Pro-Version bietet ein vol
Reversal Vol Propagation
Thalles Nascimento De Carvalho
Sind Sie es leid, Handelsmöglichkeiten zu verpassen, weil Sie Preisumkehrungen nicht rechtzeitig erkennen können? Möchten Sie Ihre Gewinne maximieren und informierte Handelsentscheidungen treffen? Wir präsentieren Ihnen den Reversal Vol Propagation Indikator, das revolutionäre Tool, das neuronale Netzwerke und Volumendaten verwendet, um mögliche Preisumkehrungen vorherzusagen. Basierend auf einer leistungsstarken Kombination aus fortschrittlichen Algorithmen und modernster Technologie analysiert
Didi Index Volume
Thalles Nascimento De Carvalho
Wir stellen Ihnen den Didi Index Volume vor, einen technischen Analyseindikator, der vom brasilianischen Trader Odir Aguiar entwickelt wurde und sich durch einen fortgeschrittenen und leistungsstarken Ansatz zur Identifizierung von Chancen auf dem Finanzmarkt auszeichnet. Der Didi Index Volume ist auf verschiedenen Plattformen verfügbar und hat sich zu einem unverzichtbaren Werkzeug für Trader entwickelt, die präzise Einblicke und wertvolle Informationen für ihre Handelsstrategien suchen. Der
Smart Binary Volume
Thalles Nascimento De Carvalho
Der Smart Binary Volume-Indikator ist ein vielseitiges Werkzeug, das den Handelsvolumen-Analysen mit maschinellem Lernen kombiniert. Er kann auf verschiedenen Märkten und Strategien angewendet werden, einschließlich Scalping und anderen Arten von kurzfristigen Handelsgeschäften. Durch den Einsatz fortschrittlicher maschineller Lernalgorithmen erkennt der Indikator komplexe Muster und generiert präzisere Kauf- und Verkaufssignale. Buffer to Create EA. Buffer Line Gold = 0. Buffer Line Red = 2
TimeChannel
Thalles Nascimento De Carvalho
The "Timechannel" is a powerful technical analysis tool designed specifically for traders who want to gain deeper and more accurate insights into price movements across multiple timeframes (multi-timeframe). This indicator is an essential addition to the toolbox of any serious trader seeking to make informed and data-driven trading decisions. Key Features: Advanced Multi-Timeframe Analysis : Timechannel allows traders to analyze price movements on different timeframes simultaneously. This is cr
DeltaBook
Thalles Nascimento De Carvalho
Der Delta Book-Indikator ist ein leistungsstarkes Instrument zur Marktanalyse, das die Verwendung von Volumen-Delta mit Informationen aus dem Orderbuch kombiniert, um Preisbewegungen in Finanzmärkten wie Aktien, Futures und Kryptowährungen zu erkennen. Es ist wichtig zu beachten, dass der Delta Book-Zugang zu Echtzeitvolumendaten und Orderbuchinformationen erfordert, um sein volles Potenzial auszuschöpfen. Die Hauptmerkmale des Delta Book sind seine fortschrittliche Marktanalysestrategie, die es
Big Player Range
Thalles Nascimento De Carvalho
5 (2)
Entdecken Sie die Kraft von "BigPlayerRange": Ihr Verbündeter in der technischen Marktanalyse Wir stellen Ihnen BigPlayerRange vor, ein fortschrittliches Werkzeug für die technische Analyse, das entwickelt wurde, um die Interessenbereiche institutioneller Anleger auf dem Markt aufzudecken. Mit diesem Tool können Sie präzise identifizieren, wo die Hauptakteure aktiv sind und wie sich dies auf Ihre Handelsstrategien auswirken kann. Hauptmerkmale: Kartierung von Interessenbereichen institution
Master OBV
Thalles Nascimento De Carvalho
MasterOBV: Beherrschen Sie die Markttrends mit Präzision! MasterOBV ist ein technischer Analyseindikator , der Volumen , positive Korrelation und einen Gleitenden Durchschnitt (MA) kombiniert, um die Identifizierung von Trends auf den Finanzmärkten zu verfeinern. Hauptmerkmale: Intelligentes Volumen: Analysiert das Handelsvolumen, um bedeutende Änderungen in der Trendstärke zu identifizieren. Positive Korrelation: Bezieht korrelierte Vermögenswerte ein, um eine umfassendere und genau
Smart Delta Volume
Thalles Nascimento De Carvalho
Smart Delta Volume: Präzise und Anpassungsfähig an Dynamische Marktbedingungen Der Smart Delta Volume ist ein fortschrittlicher technischer Indikator, der entwickelt wurde, um präzise und anpassungsfähige Analysen in einem sich ständig verändernden Marktumfeld zu bieten. Durch die Nutzung dynamischer Niveaus, die sich automatisch an die Volatilität anpassen, liefert dieser Indikator eine umfassendere und verlässlichere Sicht auf das Zusammenspiel von Volumenfluss und Preisbewegungen. Diese An
VolaMetrics VSA
Thalles Nascimento De Carvalho
VolaMetrics VSA | Ein Mächtiger Verbündeter in der Technischen Analyse Der VolaMetrics VSA ist ein technischer Analyseindikator, der die Volume Spread Analysis (VSA) Methode mit einer detaillierten Analyse des Handelsvolumens kombiniert. Entwickelt, um signifikante Preisbewegungen zu identifizieren und zu verfolgen , nutzt der VolaMetrics VSA die Interaktion zwischen Volumen und Preisspread , um wertvolle Einblicke zu bieten, die bei Handelsentscheidungen unterstützen können. Grundlagen der V
SwingVolumePro
Thalles Nascimento De Carvalho
Überblick SwingVolumePro ist ein fortschrittlicher und vielseitiger Indikator, der für eine breite Palette von Finanzinstrumenten entwickelt wurde und verschiedene Handelsstile unterstützt. Basierend auf strengen Analysen von Volumen und Preis bietet er klare und präzise Signale, die es Händlern aller Erfahrungsstufen ermöglichen, informierte Entscheidungen auf Grundlage hochwertiger Daten zu treffen. Hauptmerkmale Vielseitigkeit: SwingVolumePro kann auf verschiedenen Assets angewendet
CVD SmoothFlow Pro
Thalles Nascimento De Carvalho
CVD SmoothFlow Pro - Unbegrenzte Volumenanalyse für jedes Asset! CVD SmoothFlow Pro ist die ultimative Lösung für Trader, die eine präzise und unbegrenzte Volumenanalyse suchen. Mit der Berechnung des Cumulative Volume Delta (CVD) und fortschrittlicher Rauschfilterung bietet die Pro-Version die Flexibilität und Genauigkeit, die für den Handel mit jedem Finanzinstrument erforderlich sind. Was bietet CVD SmoothFlow Pro? Klarer Analyse : Filtert Marktrauschen und hebt signifikante Volumenbewe
Auswahl:
Alejandro Perez Gonzalez
225
Alejandro Perez Gonzalez 2024.09.02 20:21 
 

Der Benutzer hat keinen Kommentar hinterlassen

Thalles Nascimento De Carvalho
6126
Antwort vom Entwickler Thalles Nascimento De Carvalho 2024.09.02 20:43
Los fractales funcionan como preavisos, que pueden o no activarse, ayudando a mantener al trader atento al mercado. La entrada debe ser validada por la aceleración o desaceleración en el histograma rápido (en un timeframe menor). Además, el histograma rápido ofrece un análisis sobre la absorción de precio basada en el volumen. Los ejemplos están disponibles en las capturas de pantalla, junto con el paso a paso completo. Importante: ¡No opere exclusivamente basándose en las flechas (arrows)! Gracias por su feedback.
Antwort auf eine Rezension
Version 1.2 2024.09.01
Verwendungshinweise wurden hinzugefügt und der Indikator wurde für verschiedene Instrumente angepasst.