Dynamic Forex28 Navigator
- 指标
- Bernhard Schweigert
- 版本: 1.4
- 更新: 24 三月 2025
- 激活: 5
Dynamic Forex28 Navigator - 下一代外汇交易工具。
当前 49% 折扣。
Dynamic Forex28 Navigator 是我们长期流行的指标的演变,将三种功能合二为一:
- 高级货币强度 28 指标 (695 条评论)+
- 高级货币 IMPULSE 带警报 (520 条评论)+
- CS28 组合信号(奖励)。
下一代强度指标提供什么?
- 您喜欢的原始指标的一切,现在通过新功能和更高的精度进行了增强。
主要特点:
专有货币强度公式。
- 所有时间范围内的平滑和准确的强度线。
- 非常适合识别趋势和精确进入。
动态市场斐波那契水平(市场斐波那契)。
- 此指标独有的独特功能。
- 斐波那契应用于货币强度,而不是价格图表。
- 适应实时市场活动以获得准确的反转区域。
实时市场动量。
- 第 9 行显示市场是活跃还是被动。
- 对于定时交易至关重要。
全面的警报和显示。
- 每种货币最强的买入和卖出动量。
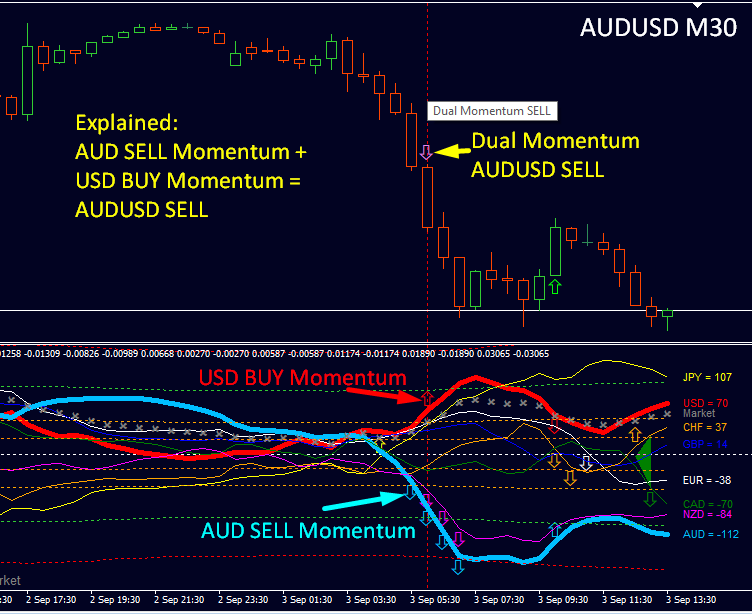
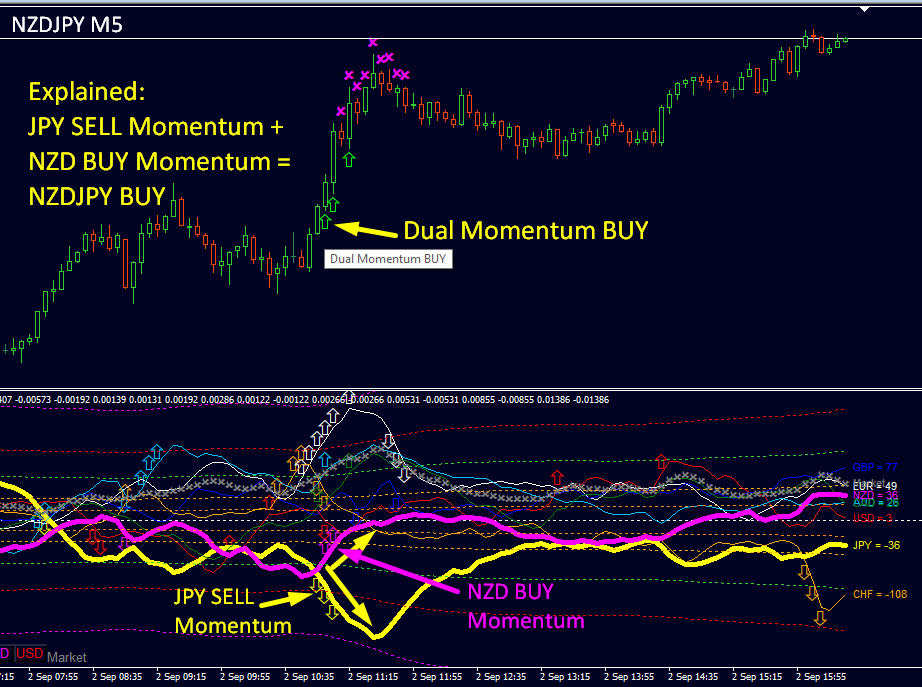
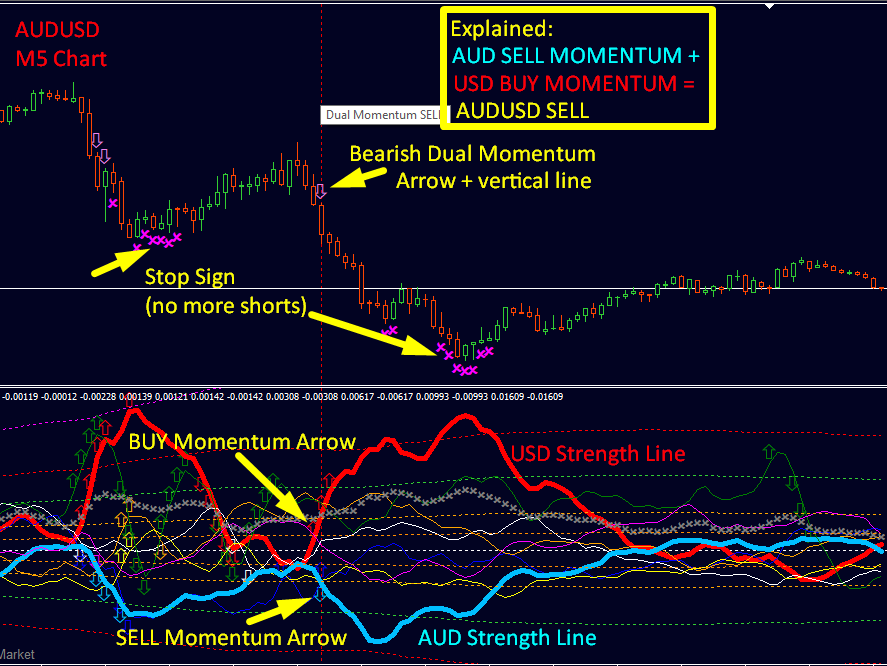
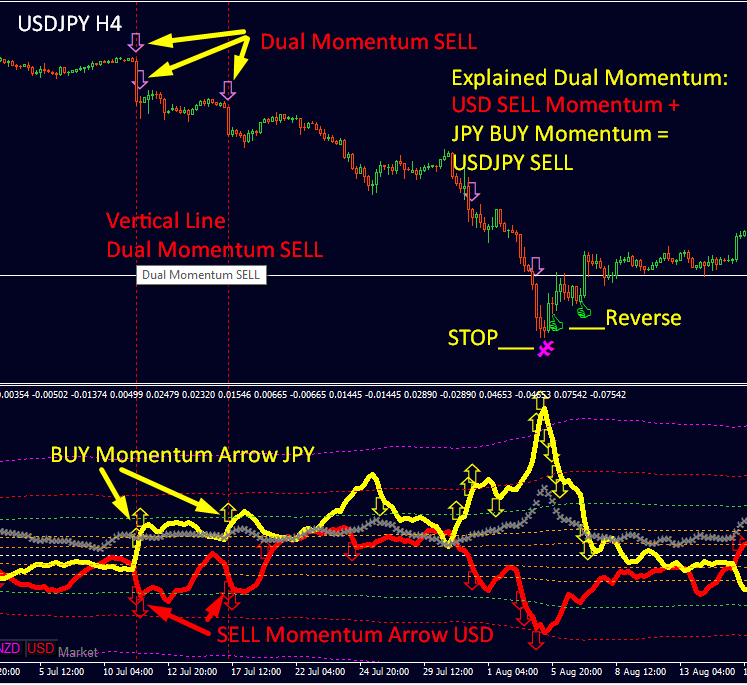
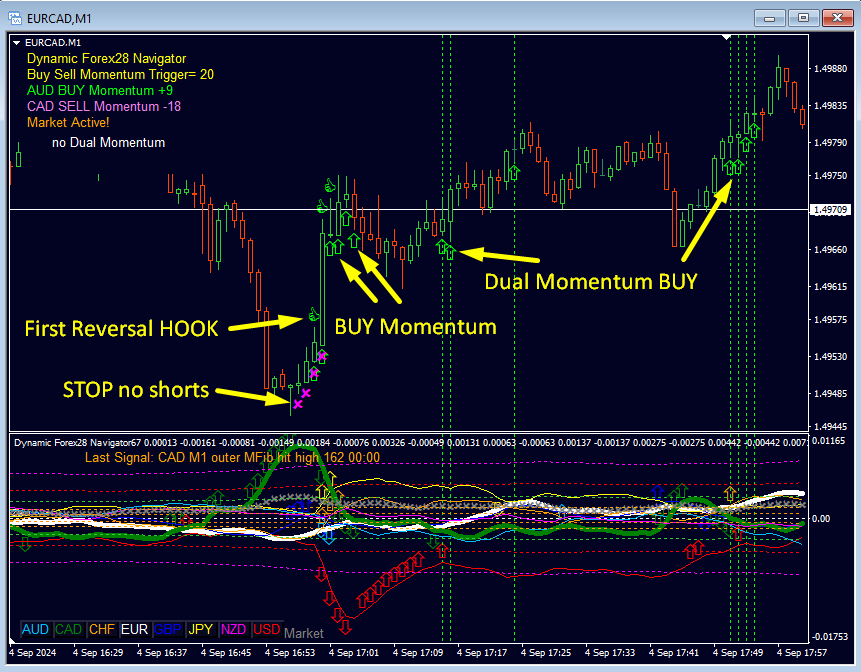
- 28 对的双重动量买入和卖出。
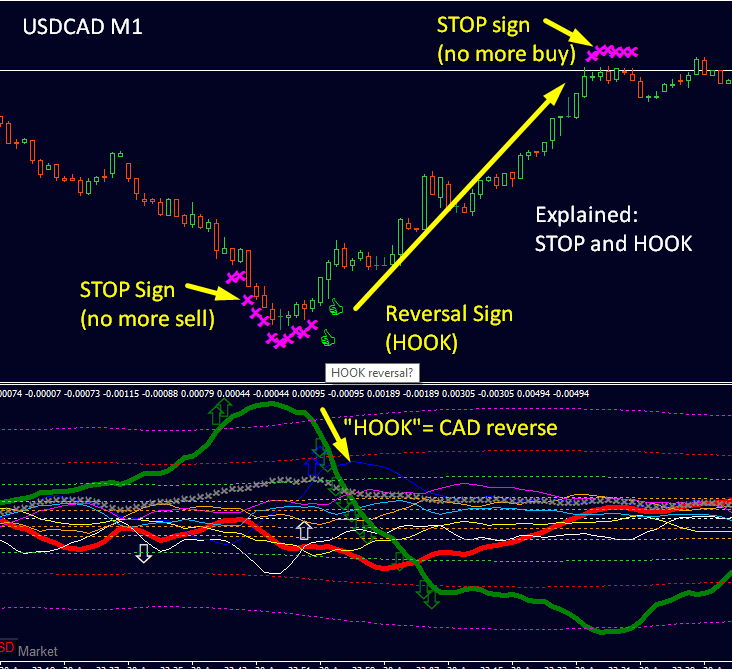
- 超买/超卖警告外部范围和止损。
- 反转和回调警报。
- 特殊交叉级别模式通知。
优化性能。
- 减少数据调用以获得更快的经纪人反馈。
- 自动支持图表以增强可靠性。
用户友好界面。
- 快速图表切换按钮。
- 布局直观,信号和信息清晰。
适用对象:
- 适合所有交易者——从初学者到专家。
- 非常适合那些希望在交易策略中利用货币强势的人。
入门:
使用 Dynamic Forex28 Navigator 提升您的交易。获得在外汇市场保持领先所需的洞察力和工具。
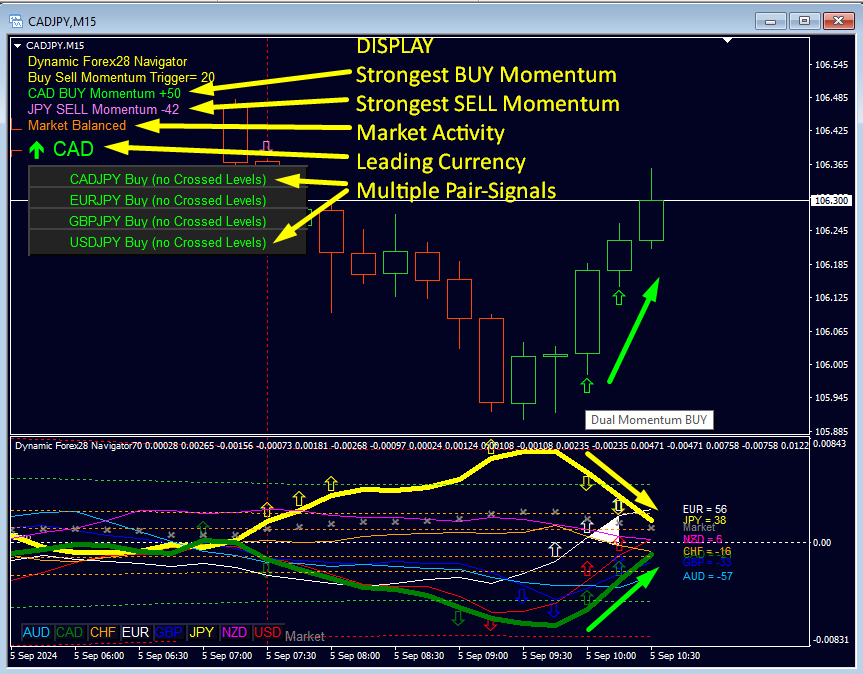
Dynamic Forex28 Navigator 新显示概览。
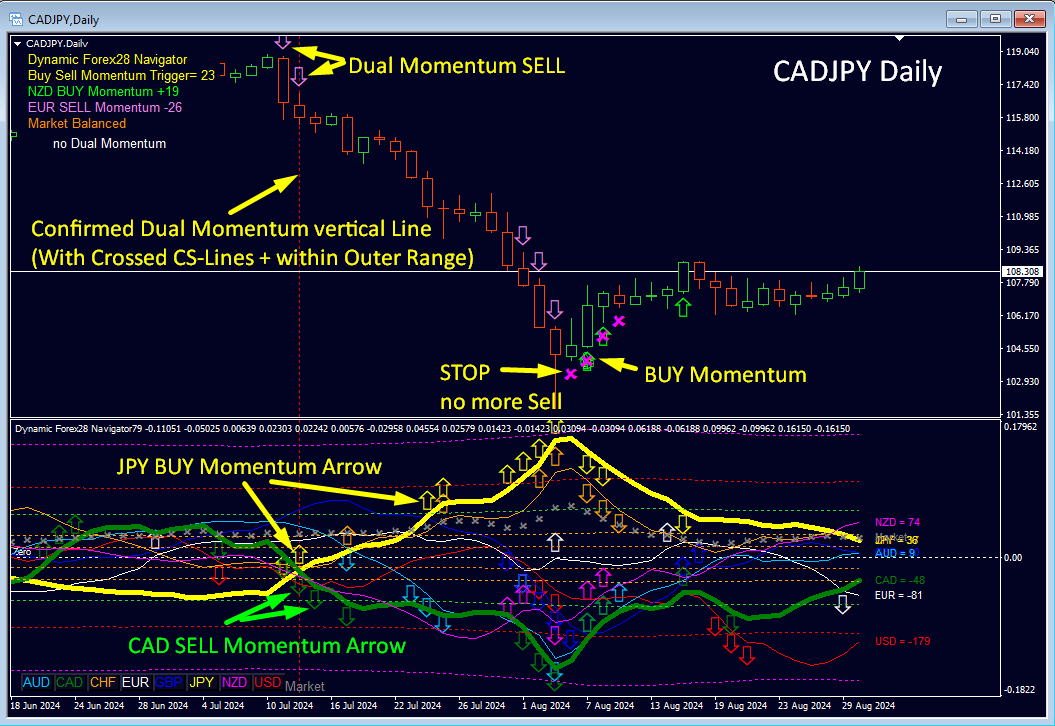
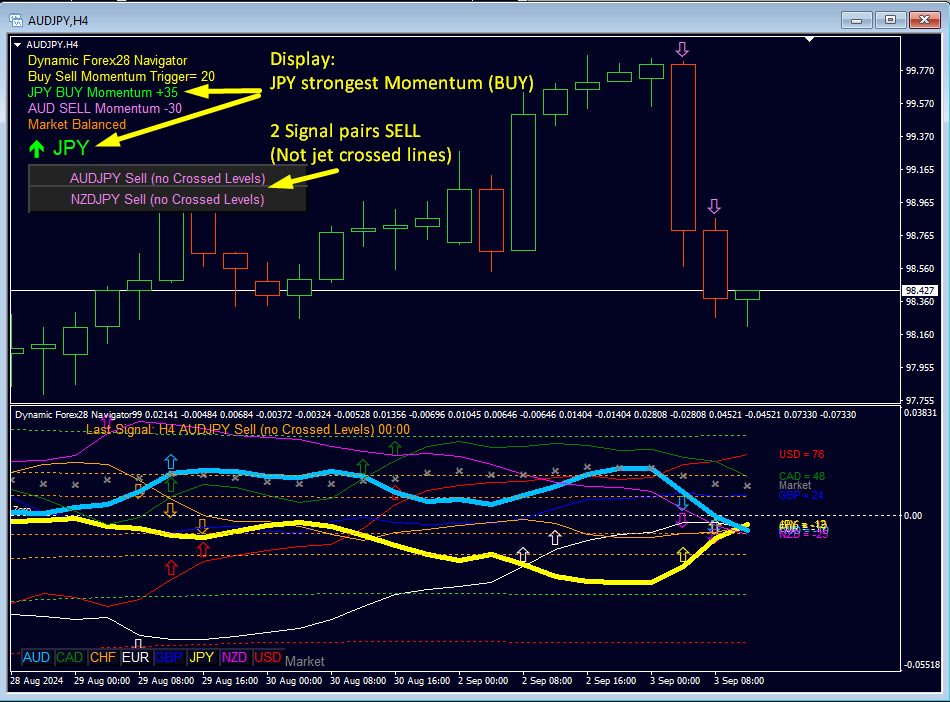
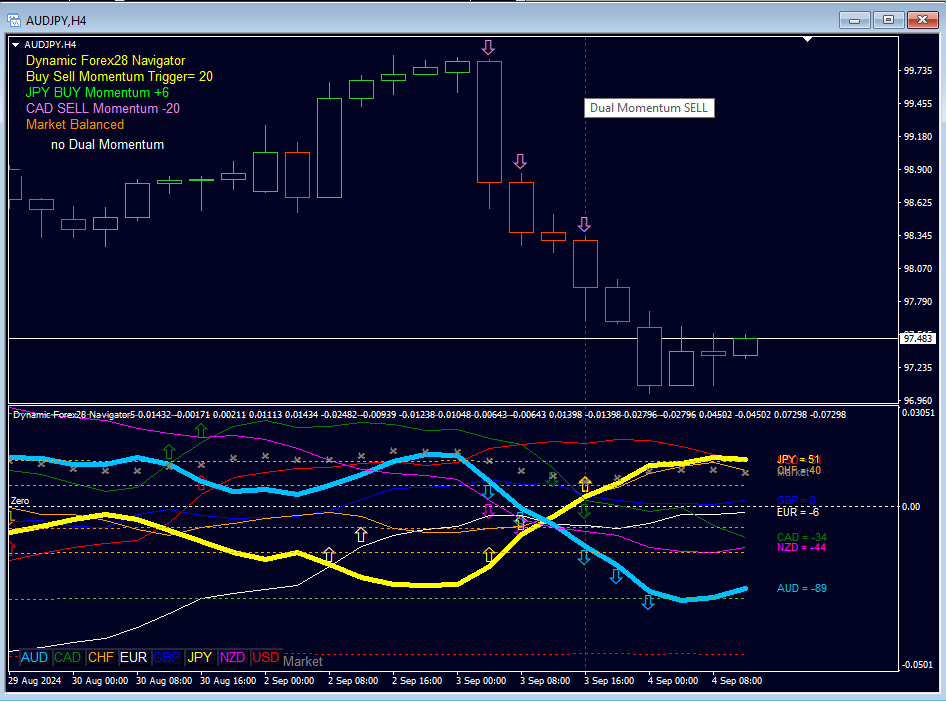
- 动量变化触发器 23。描述:表示当前动量值输入设置为 23,当满足指定条件时触发 买入和卖出动量箭头。
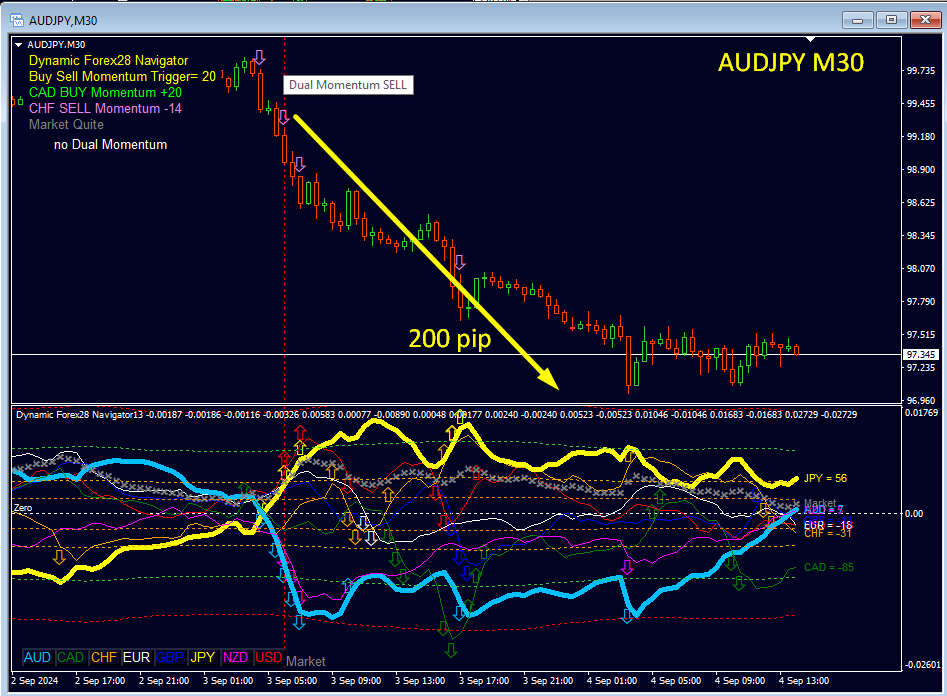
- 买入动量。描述:显示上涨势头最强的货币(例如,NZD 27 买入动量),以绿色显示其值。
- 卖出动量。描述:显示下跌势头最强的货币(例如,USD -29 卖出动量),以红色显示其值。
- 市场活动。描述:提供实时和整个市场状况,具有五种可能的状态,包括高波动时期的“市场波动!”等警告。
- 绝对货币动量。描述:突出显示买入和卖出动量最大的货币,无论是最强还是最弱,让交易者快速了解重大市场走势。
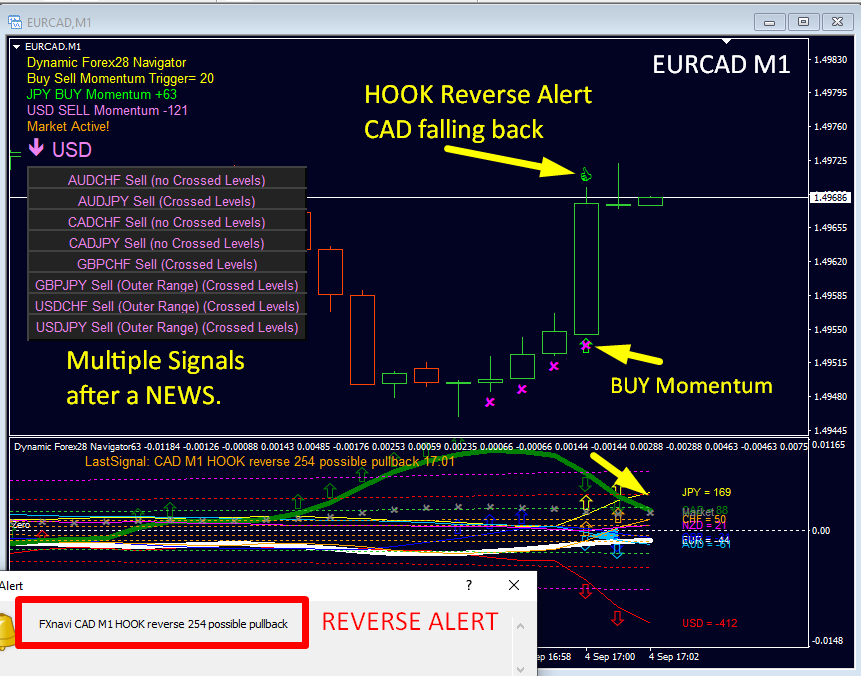
- 收盘价买入/卖出的双动量信号(带警报)。描述:列出符合指定条件的多个信号,表示双动量。每个信号包括货币对、操作(买入/卖出)和条件满足的确认(“交叉水平”和“外部范围”),其中货币已交叉或达到外部范围。单击信号可打开相应的图表。
在收盘时进行交易,永不重绘!
动态 Forex28 导航器的关键输入参数。
买入和卖出动量设置。
- 买入卖出动量触发器在 Fib 斜率(18-26)上。设置买入和卖出动量市场斐波那契水平(23 斜率)以指示动量。
- 绘制买入和卖出动量箭头(子窗口)。在图表子窗口中显示箭头以指示强势货币买入和卖出动量。
双动量警报设置。
- 为双动量绘制箭头(主窗口)。显示所有检测到的双动量信号的箭头(基础货币和报价货币的强动量)。
- 在双动量上绘制 V 线。使用过滤器在已确认的双动量信号上绘制垂直线。
- 警报双动量。
双动量过滤器设置。
- 显示外部范围信息。在图表中显示外部范围信息以便更好地进行分析。
- 外部范围最大水平 (100-161)。设置超卖/超买区域的外部范围最大水平。
- 显示 CS 交叉水平信息。显示交叉水平以及外部范围信息。
CS 警报设置。
- 警报外部范围触发 HIT。当货币强度达到外部范围市场斐波那契水平时发出警报。
- 警报外部范围触发 HOOK。当货币强度从外部范围回落时发送回调/反转警报。
设置反转或退出。
- 警报外部水平 HIT。当达到外部范围斐波那契水平时发出警报。
- 警报外部水平 HOOK(反转)。警报反转 HOOK 以防潜在反转。
- HOOK 外部斐波那契触发水平 (161-262)。上述斐波那契水平。
- Hook 最小双动量 (20-48)。
- 绘制反转 HOOK 箭头(拇指)。
- 绘制外部斐波那契止损。指示图表上的外部市场斐波那契止损水平。
- 外部斐波那契止损值(100-261)。上述最小斐波那契值。
CS CROSS 警报设置。
- 激活货币交叉水平功能。启用货币交叉水平标志以获取关键市场信号。
- 交叉斐波那契斜率(20-46)。最小双重动量。
- 警报货币交叉水平。启用后,针对货币交叉水平事件发出警报。
常规警报设置。
- 启用弹出警报。打开关键市场事件的弹出警报。
- 发送电子邮件警报。发送货币强度信号的电子邮件警报。
- 发送推送通知。向您的手机发送推送通知以进行警报。
其他设置。
- 在新窗口中打开快速图表。允许通过单击两个货币名称或警报按钮快速切换图表,在单独的窗口中打开新货币对。
- 打开支持图表。打开支持图表以保持经纪商信息更新和可靠。
- 从警报中排除货币对。使用逗号分隔列表指定要从警报中排除的货币对。
- 使用专家 (EA) 的 PIN。向专家顾问发送 PIN 以增强性能。
提示:
- 使用我的模板。给我发消息索要入门包!
- 如果您不想中断指标,请使用“在新窗口中打开图表”。
- 保持在更高时间范围内的趋势(动量)。
- 寻找货币双重动量作为交易设置。
- 特别:要更新 MT4 图表历史记录,将打开 7 个支持图表(请参阅手册)!此功能可以停用。
- 查看我的个人资料上的新闻和博客,了解交易系统和交易示例。
如果您有任何问题,我会随时帮助您。
祝你未来有很多绿色点。
此致,Bernhard
(注:本页面已自动翻译。如需查看英文原文,请访问:https://www.mql5.com/en/market/product/122172)


Outstanding Product – Reliable and Effective!