• 概要
  • レビュー (1)
  • コメント (26)
  • 最新情報

Dynamic Forex28 Navigator

5

Dynamic Forex28 Navigator - 次世代の Forex 取引ツール。

現在 49% オフ。

Dynamic Forex28 Navigator は、長年人気のインジケーターを進化させたもので、3 つの機能を 1 つにまとめています。
  1. Advanced Currency Strength28 インジケーター (レビュー 695 件)  +
  2. Advanced Currency IMPULSE with ALERT (レビュー 520 件) +
  3. CS28 コンボ シグナル (ボーナス)。

インジケーターの詳細 https://www.mql5.com/en/blogs/post/758844

次世代の Strength インジケーターが提供するもの 
  • オリジナルで気に入っていたすべての機能が、新機能と精度の向上によって強化されました。

主な機能:

独自の通貨強度計算式。

  • すべての時間枠でスムーズかつ正確な強度ライン。
  • トレンドの特定と正確なエントリーに最適です。

ダイナミックマーケットフィボナッチレベル (マーケットフィボナッチ)。
  • このインジケーターに固有のユニークな機能。
  • フィボナッチは価格チャートではなく通貨の強度に適用されます。
  • 正確な反転ゾーンのためにリアルタイムの市場活動に適応します。

リアルタイムの市場モメンタム。
  • 9番目のラインは、市場がアクティブかパッシブかを示します。
  • 取引のタイミングに不可欠です。

包括的なアラートと表示。
  • 各通貨の最強の買いと売りのモメンタム。
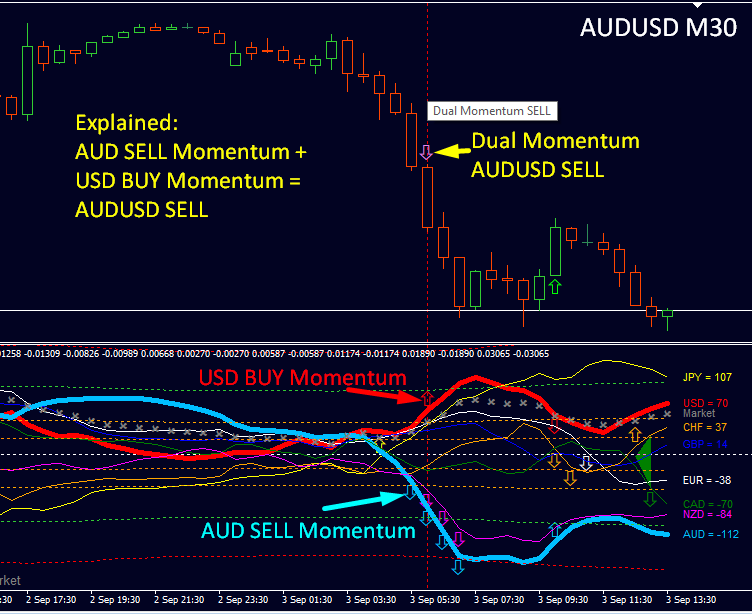
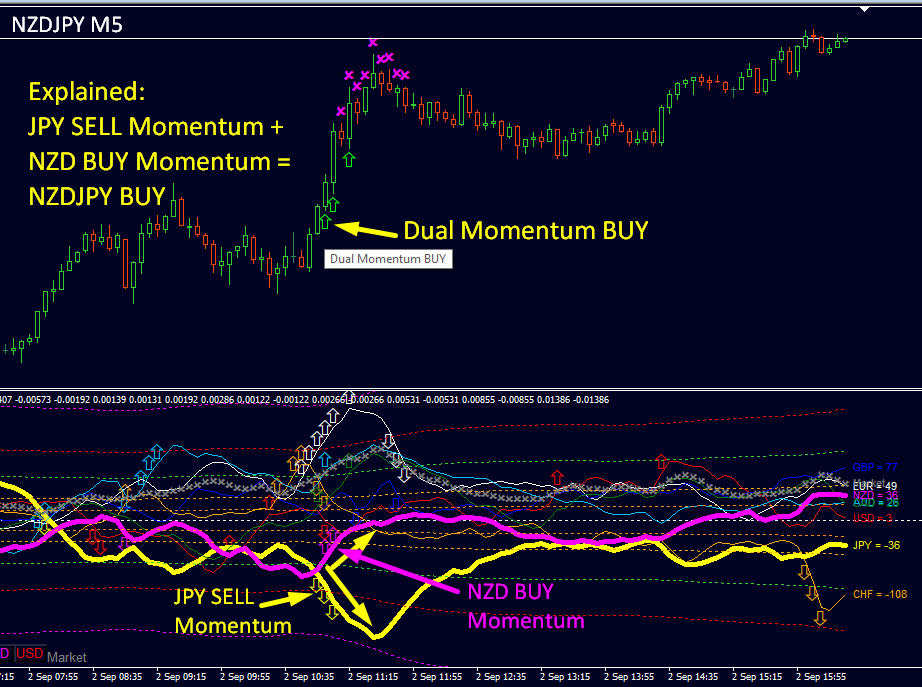
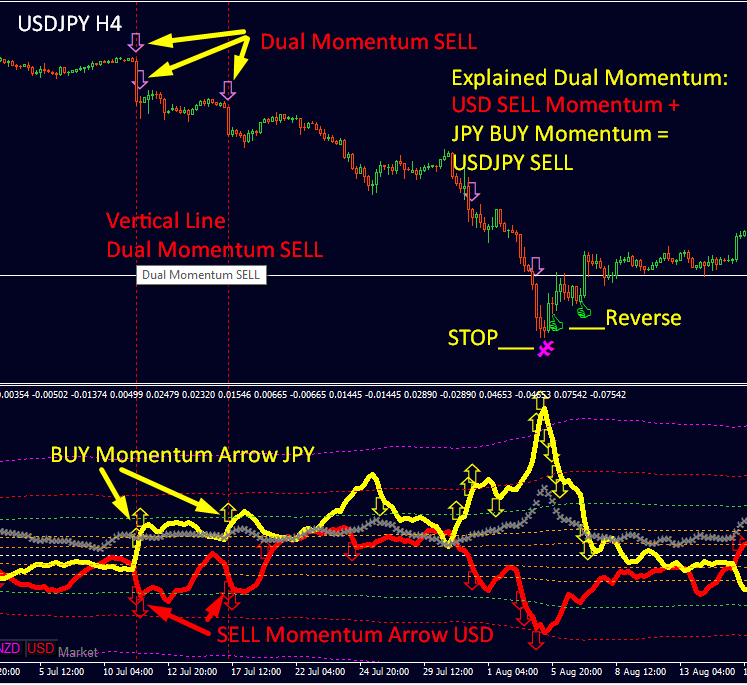
  • 28ペアのデュアルモメンタム買いと売り。
  • 買われすぎ/売られすぎの警告、範囲外とストップ。
  • 反転とプルバックのアラート。
  • 特別なクロスレベルパターン通知。

最適化されたパフォーマンス。
  • データ呼び出しを減らしてブローカーフィードを高速化。
  • 信頼性を高める自動サポートチャート。

ユーザーフレンドリーなインターフェース。
  • チャート切り替えボタンが速い。
  • 明確なシグナルと情報を備えた直感的なレイアウト。

対象者: 
  • 初心者からエキスパートまで、すべてのトレーダーに適しています。
  • 取引戦略で通貨の強さを活用したい方に最適です。

開始方法:

Dynamic Forex28 Navigator で取引を向上させましょう。Forex 市場で優位に立つために必要な洞察とツールを手に入れましょう。

ユーザーマニュアル: こちらをクリックしてください https://www.mql5.com/en/blogs/post/758844

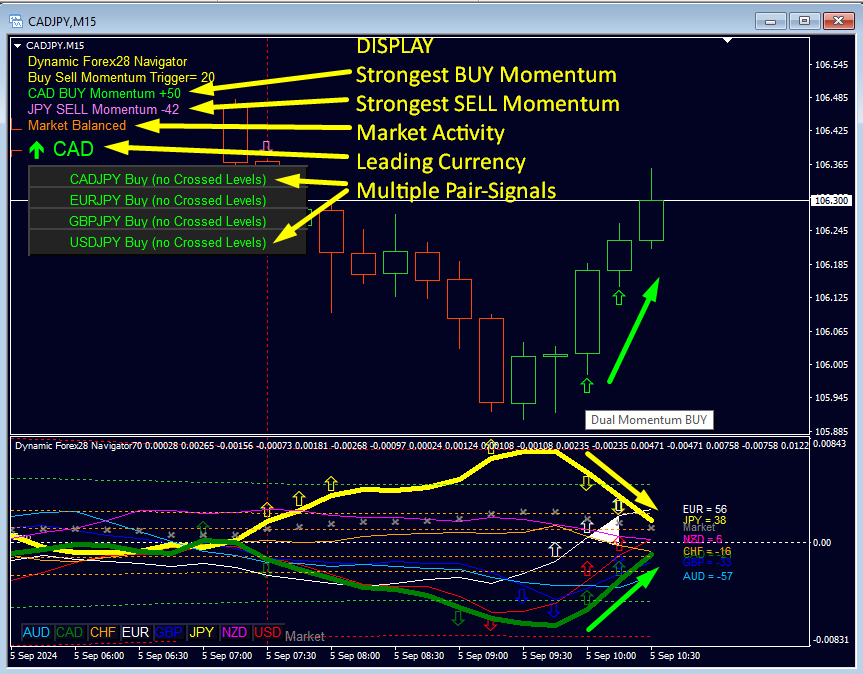
Dynamic Forex28 Navigator の新しい表示の概要。
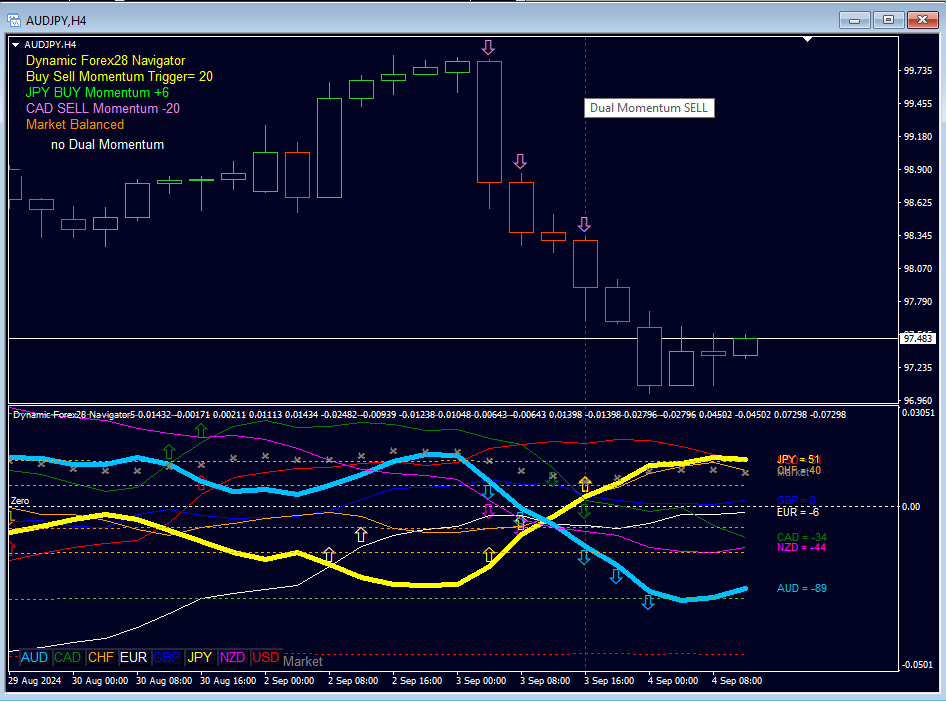
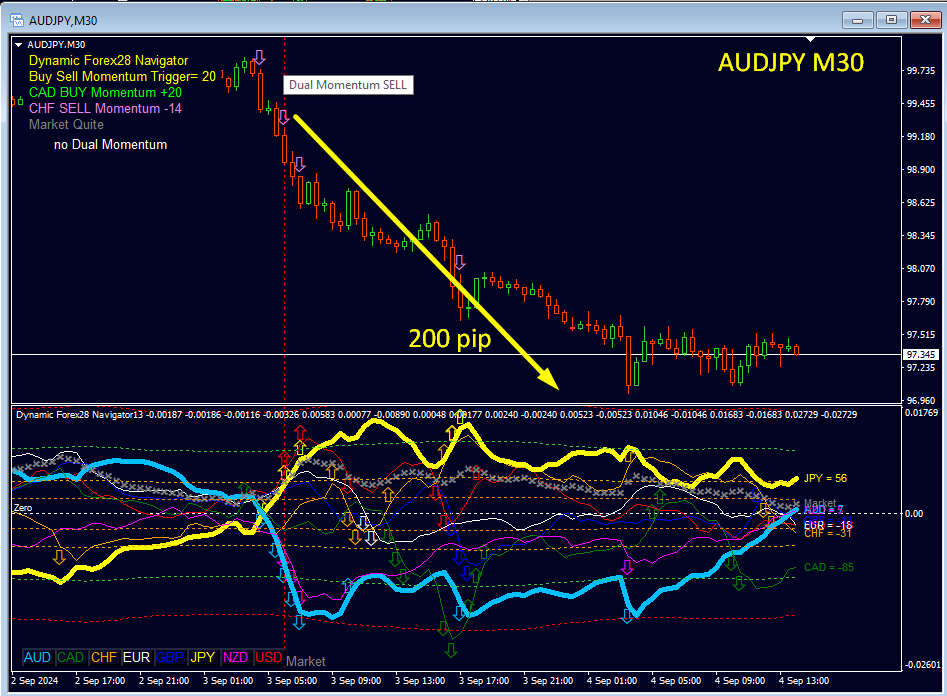
  1. モメンタム変更トリガー 23。説明: 現在のモメンタム値入力が 23 に設定されていることを示します。指定された条件が満たされると、BUY & SELL モメンタム矢印がトリガーされます。
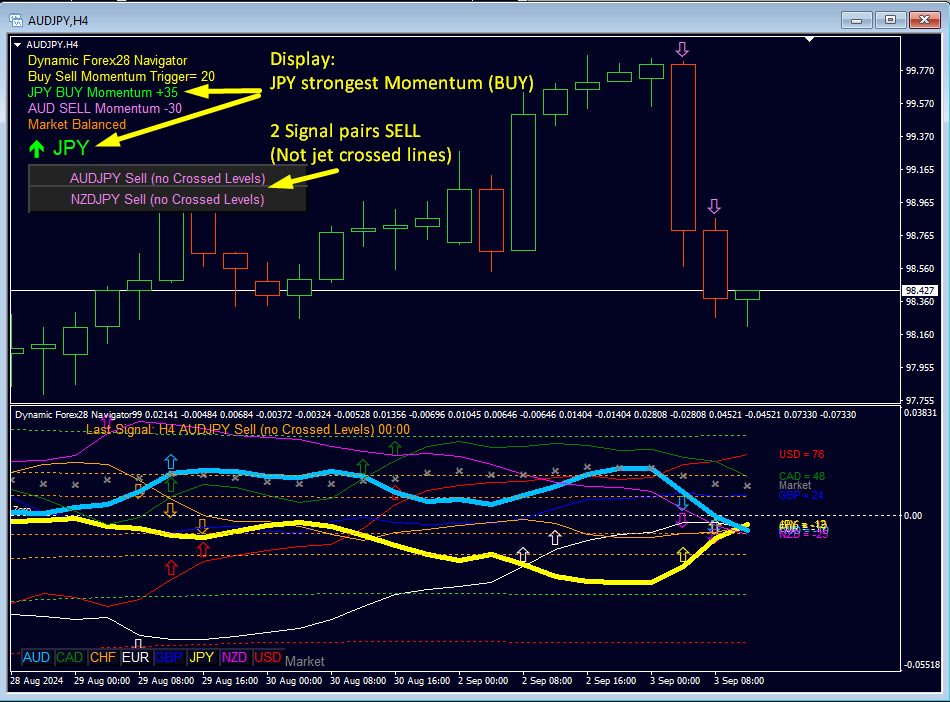
  2. BUY モメンタム。説明: 最も強い上昇モメンタムを持つ通貨 (例: NZD 27 買いモメンタム) を表示し、値を緑色で表示します。
  3. 売りモメンタム。説明: 最も強い下降モメンタムを持つ通貨 (例: USD -29 売りモメンタム) を表示し、値を赤色で表示します。
  4. 市場アクティビティ。説明: リアルタイムおよび市場全体の状況を 5 つのステータスで提供し、ボラティリティの高い期間には「市場が不安定!!」などの警告を表示します。
  5. 絶対通貨モメンタム。説明: 最も強いまたは最も弱い、最も強い買いおよび売りモメンタムを持つ通貨を強調表示し、トレーダーに重要な市場の動きの概要を提供します。
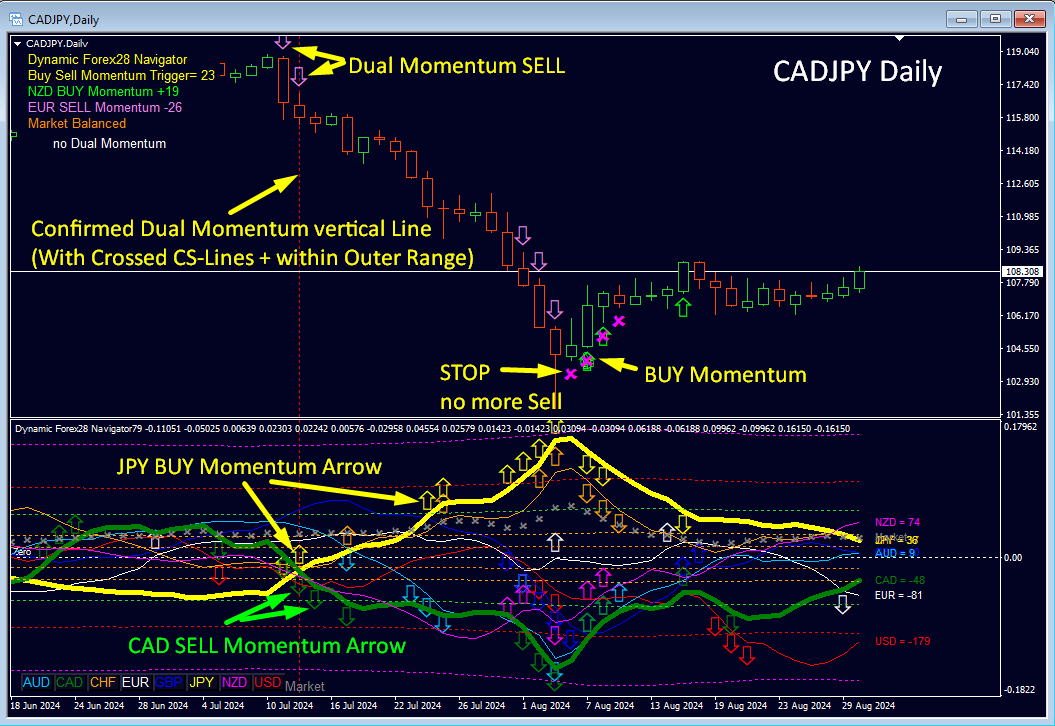
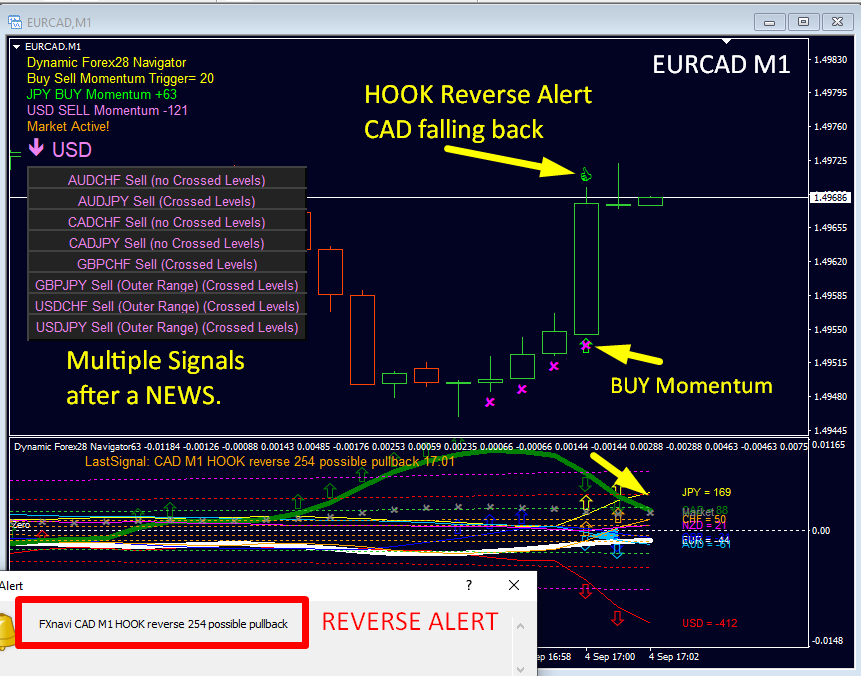
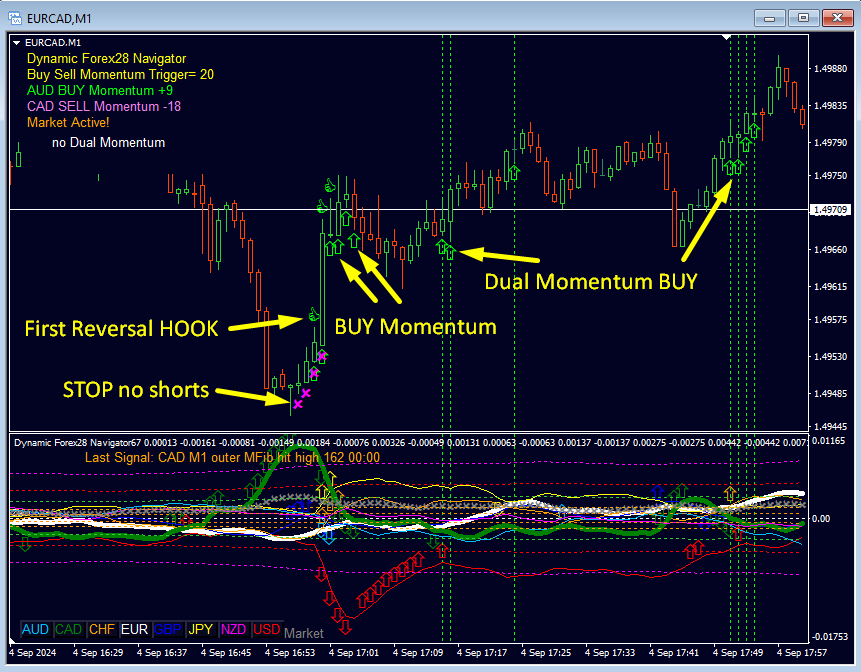
  6. クローズドバーの BUY/SELL (アラート付き) のデュアルモメンタムシグナル。説明: 指定された条件を満たす複数のシグナルをリストし、デュアルモメンタムを示します。各シグナルには、通貨ペア、アクション(買い/売り)、および通貨が外側の範囲を越えたか、外側の範囲に到達した条件(「交差レベル」および「外側の範囲」)の確認が含まれます。シグナルをクリックすると、対応するチャートが開きます。

バーの終値で取引し、再描画は行いません。

ダイナミック Forex28 ナビゲーターの主な入力パラメータ。


買いと売りのモメンタム設定。

  • フィボナッチ スロープ (18-26) で買いと売りのモメンタムをトリガーします。モメンタムを示すために、買いと売りのモメンタム マーケット フィボナッチ レベル (23 スロープ) を設定します。
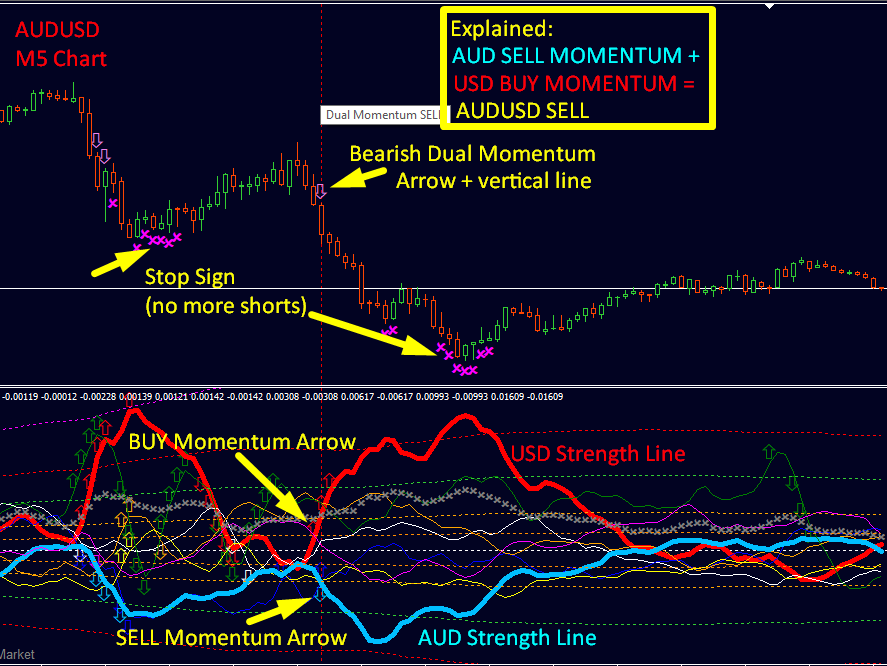
  • 買いと売りのモメンタム矢印を描画します (サブウィンドウ)。チャートのサブウィンドウに矢印を表示して、強い通貨の買いと売りのモメンタムを示します。


デュアル モメンタム アラート設定。

  • デュアル モメンタムの矢印を描画します (メイン ウィンドウ)。検出されたすべてのデュアル モメンタム シグナル (ベース通貨とクォート通貨の強いモメンタム) の矢印を表示します。
  • デュアル モメンタムに V ラインを描画します。フィルターを使用して、確認済みのデュアル モメンタム シグナルに垂直線を描画します。
  • デュアル モメンタムをアラートします。


デュアル モメンタム フィルター設定。

  • 範囲外情報を表示。チャートに範囲外情報を表示して、より適切な分析を行います。
  • 外側の外側範囲最大レベル (100-161)。売られすぎ/買われすぎゾーンの外側の外側範囲最大レベルを設定します。
  • CS 交差レベル情報を表示。外側範囲情報とともに交差レベルを表示します。


CS アラート設定。

  • アラート外側範囲トリガー HIT。通貨の強さが外側範囲市場のフィボナッチ レベルに達したときにアラートします。
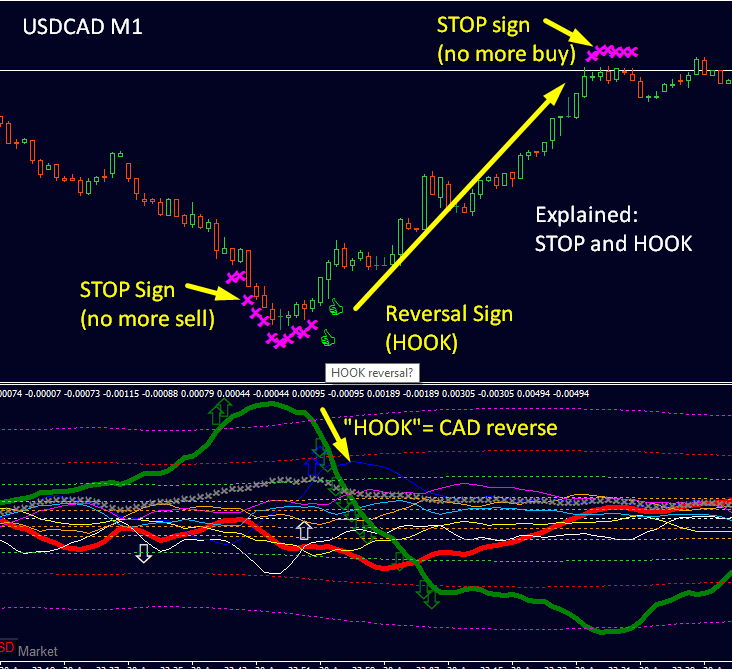
  • アラート外側範囲トリガー HOOK。通貨の強さが外側範囲から低下したときにプルバック/反転のアラートを送信します。


設定リバーサルまたは終了。

  1. アラート外側レベル HIT。外側範囲フィボナッチにヒットしたときにアラートします。
  2. アラート外側レベル HOOK (リバーサル)。潜在的なリバーサルに対してリバーサル HOOK をアラートします。
  3. HOOK 外側フィボナッチ トリガー レベル (161-262)。上記のフィボナッチ レベル。
  4. フック最小デュアル モメンタム (20-48)。
  5. 反転フック矢印(つまみ)を描きます。
  6. 外側フィボナッチストップを描きます。チャート上の外側の市場フィボナッチストップレベルを示します。
  7. 外側フィボナッチストップ値(100-261)。上記の最小フィボナッチ。


CS クロスアラート設定。

  • 通貨クロスレベル機能を有効にします。主要な市場シグナルの通貨クロスレベルサインを有効にします。
  • クロスフィボスロープ(20-46)。最小デュアルモメンタム。
  • 通貨クロスレベルをアラートします。有効にすると、通貨クロスレベルイベントのアラートが発生します。


一般アラート設定。

  • ポップアップアラートを有効にします。主要な市場イベントのポップアップアラートをオンにします。
  • 電子メールアラートを送信します。通貨の強さのシグナルの電子メールアラートを送信します。
  • プッシュ通知を送信します。アラートのプッシュ通知を携帯電話に送信します。


その他の設定。

  • クイックチャートを新しいウィンドウで開きます。 2 つの通貨名またはアラート ボタンをクリックすると、チャートをすばやく切り替えることができ、新しいペアが別のウィンドウで開きます。
  • サポート チャートを開く。ブローカー フィードを最新かつ信頼できる状態に保つために、サポート チャートを開きます。
  • アラートからペアを除外する。コンマ区切りのリストを使用して、アラートから除外するペアを指定します。
  • エキスパート (EA) に PIN を使用する。パフォーマンスを向上させるために、エキスパート アドバイザーに PIN を送信します。


ヒント: 

  1. 私のテンプレートを使用します。スターター パックを要求するメッセージを送信してください。
  2. インジケーターを中断したくない場合は、「新しいウィンドウでチャートを開く」を使用します。
  3. より高い時間枠のトレンド (モメンタム) 内にとどまります。
  4. トレード設定として通貨デュアル モメンタムを探します。
  5. 特別: MT4 チャート履歴を更新するには、7 つのサポート チャートが開きます (マニュアルを参照)。この機能は無効にできます。
  6. 取引システムとトレード例については、プロフィールのニュースとブログを確認してください。


質問がある場合はいつでもお手伝いします。今後もグリーンピップが沢山出ることを祈っています。

よろしくお願いいたします、ベルンハルト


(注: このページは自動翻訳されています。元の英語版については、https://www.mql5.com/en/market/product/122172 をご覧ください)


レビュー 1
bollie15
34
bollie15 2024.10.04 13:09 
 

I like this seller his indicators and I instantly see the thousands of hours of experience he has and has put into creating these indicators. I must also add to the fact that this strategy he uses in trading is super simple, something I never tought of, but once you apply it in practice with this indicator it just works. It provides an edge and that is what we need as traders, EDGE! So this review is well deserved. He helped me out a lot with anything I needed and still does, even after the sale is done. I will never trade another strategy!

おすすめのプロダクト
これは、キャンドルの終値を予測する指標です。 このインジケータは、主にD1チャートでの使用を目的としていますが. この指標は、従来の外国為替取引とバイナリオプション取引の両方に適しています。 インジケーターは、スタンドアロンのトレーディングシステムとして使用することも、既存のトレーディングシステムへの追加として機能させることもできます。 このインジケーターは、現在のキャンドルを分析し、キャンドル自体の内部の特定の強度係数と、前のキャンドルのパラメーターを計算します。 したがって、この指標は、市場の動きのさらなる方向性と現在のキャンドルの終値を予測します。 この方法のおかげで、この指標は、短期の日中取引だけでなく、中期および長期の取引にも適しています。 インジケーターを使用すると、市場の状況の分析中にインジケーターが生成する潜在的な信号の数を設定できます。 インジケーターの設定には、このための特別なパラメーターがあります。 また、インジケーターは、チャート上のメッセージの形式で、電子メールで、およびPUSH通知の形式で、新しい信号について通知することができます。 購入後は必ず私に書いて
Was: $249  Now: $99   Market Profile defines a number of day types that can help the trader to determine market behaviour. A key feature is the Value Area, representing the range of price action where 70% of trading took place. Understanding the Value Area can give traders valuable insight into market direction and establish the higher odds trade. It is an excellent addition to any system you may be using. Blahtech Limited presents their Market Profile indicator for the MetaTrader community. Ins
Gold Bricks FX USES THE TREND WAVE INDICATOR AND IT CAN IDENTIFY THE BEGINNING AND THE END OF A NEW WAVE TREND MOVEMENT. AS AN OSCILLATOR, THE INDICATOR IDENTIFIES THE OVERBOUGHT AND OVERSOLD ZONES. IT WORKS GREAT TO CATCH THE SHORT TERM PRICE REVERSALS AND USES A MARTINGALE STRATEGY TO CLOSE ALL TRADES IN PROFIT. USE DEFAULT SETTINGS ON H1 OR HIGHER TIME FRAME ON ANY PAIR FOR MORE ACCURATE TRADES WHY THIS EA : Smart entries calculated by 4 great strategies The EA can be run on even a
Scalping Snake Proは、トレーダーに価格逆転の瞬間を示し、再描画しないユニークなスキャルピングインジケーターです。このインジケーターは、インターネット上の他の多くのインジケーターとは異なり、その値を再描画しません。それはあなたが取引を開くのに遅れないことを可能にする最初のバーにシグナルを描きます。このインジケーターは、シグナルが表示されたときに電話と電子メールでトレーダーに通知を送信します。このすべての機能をたったの147ドルで手に入れることができます。 この指標と取引する方法は? H1タイムフレームを開きます。通貨ペアGBPUSDまたはEURUSD。インジケーターが青い線を引く最初のバーを待っています。 TakeProfitを購入して+20ポイントを設定する取引を開始します。 StopLossは反対方向のシグナル、つまり赤い線になります。売り取引を開始するには、インジケーターが赤い線を引く最初のバーを待ちます。その後、販売取引を開始します。利益を20ポイント獲得します。 StopLossは反対方向、つまり青い線の信号になります。 このインジケーターは再描画されて
We present you the indicator "Candle closing counter", which will become your indispensable assistant in the world of trading. That’s why knowing when the candle will close can help: If you like to trade using candle patterns, you will know when the candle will be closed. This indicator will allow you to check if a known pattern has formed and if there is a possibility of trading. The indicator will help you to prepare for market opening and market closure. You can set a timer to create a p
Basic Support and Resistance インジケータは、テクニカル分析を強化するために必要なソリューションです。このインジケータを使用すると、チャートにサポートレベルとレジスタンスレベルを投影できます/ mt5バージョン 機能 フィボナッチレベルの統合: サポートと抵抗レベルとともにフィボナッチレベルを表示するオプションを使用すると、私たちの指標は市場行動と逆転領域の可能性についてさらに深い洞察を提供します。 パフォーマンスの最適化: 各バーの開口部のみで拡張ラインを更新するオプションを使用すると、インジケータは、サポートレベルと抵抗レベルの精度を犠牲にすることなく最適なパフォーマンスを保証します。 入力 メイン設定 Timeframe:  この入力を通じて、より高い時間枠のサポートラインとレジスタンスラインをチャート上に表示することを選択できます。 Support/Resistance Strength [Number of Bars]:  この入力を使用して、サポートと抵抗の強度を決定できます。数が高いほど、サポート/抵抗がより強くなります。 Pri
TWO PAIRS SQUARE HEDGE METER INDICATOR Try this brilliant 2 pairs square indicator It draws a square wave of the relation between your two inputs symbols when square wave indicates -1 then it is very great opportunity to SELL pair1 and BUY Pair2 when square wave indicates +1 then it is very great opportunity to BUY pair1 and SELL Pair2 the inputs are : 2 pairs of symbols         then index value : i use 20 for M30 charts ( you can try other values : 40/50 for M15 , : 30 for M30 , : 10 for H1 ,
[ MT5 Version ] Supply and Demand Multitimeframe Supply and Demand Multitimeframe is the first indicator in the market that combines multiple aspects like trading volume, price structure and momentum to identify Supply and Demand zones for every asset. The Supply and Demand indicator analyzes simultaneously up to 4 different TFs and represents their information in the current graph. Its interactive UI highlights everytime the price enters a Supply or Demand zone even if the zones are not visib
Market Profile 3
Hussien Abdeltwab Hussien Ryad
3 (2)
Market Profile 3 MetaTrader 4 indicator  — is a classic Market Profile implementation that can show the price density over time, outlining the most important price levels, value area, and control value of a given trading session. This indicator can be attached to timeframes between M1 and D1 and will show the Market Profile for daily, weekly, monthly, or even intraday sessions. Lower timeframes offer higher precision. Higher timeframes are recommended for better visibility. It is also possible t
FREE
The Chaikin Oscillator is a technical indicator developed by Marc Chaikin that combines price and volume data to measure the accumulation and distribution of a financial instrument. It aims to identify potential buying and selling opportunities in the market. The Chaikin Oscillator is calculated by subtracting a 10-day exponential moving average of the Accumulation Distribution Line (ADL) from a 3-day exponential moving average of the ADL. Here's how to use the Chaikin Oscillator indicator in tr
Noize Absorption Index - is the manual trading system that measures the difference of pressure between bears forces and bulls forces. Green line - is a noize free index that showing curent situation. Zero value of index shows totally choppy/flat market.Values above zero level shows how powerfull bullish wave is and values below zero measures bearish forces.Up arrow appears on bearish market when it's ready to reverse, dn arrow appears on weak bullish market, as a result of reverse expectation. S
First and foremost, the Insight Flow Indicator stands out as a Non-Repainting, Non-Redrawing, and Non-Lagging tool. This makes it a prime choice for both manual and algorithmic trading, ensuring reliable and consistent signals. User Manual: Settings, Inputs, and Strategy The Insight Flow Indicator leverages price action, strength, and momentum to provide a clear edge in the market. Equipped with advanced filters, it eliminates noise and false signals, enhancing trading potential. By using multip
まず第一に、この取引ツールはノンリペイント、ノンリドロー、ノンラグの指標であり、プロの取引に理想的ですことを強調する価値があります。 オンラインコース、ユーザーマニュアル、デモ。 スマートプライスアクションコンセプトインジケーターは、新米から経験豊富なトレーダーまで、非常 に強力なツールです。Inner Circle Trader AnalysisやSmart Money Concepts Trading Strategiesなど、20以上の有用な指標を1つに組み合わせています。このインジケーターはスマートマネーコンセプトに焦点を当て、大手機関の取引方法を提供し、彼らの動きを予測するのに役立ちます。 特に、流動性分析に優れており、機関がどのように取引しているかを理解しやすくしています。市場のトレンドを予測し、価格の動きを慎重に分析するのに優れています。機関の戦略とトレードを合わせることで、市場の動向についてより正確な予測ができます。このインジケーターは多目的であり、市場構造を分析し、重要な注文ブロックを特定し、さまざまなパターンを認識するのに優れています。 このインジケー
This is a new strategy for SUPPLY DEMAND areas It is based on a calculation using the tick volume to detect the big price action in market for both bear /bull actions this smart volume action candles are used to determine the supply and demand areas prices in between main supply and demand lines indicate sideway market  up arrows will be shown when prices moves above the main supply and the secondary supply lines Down arrows will be shown when prices moves below the main demand and the secondary
マーケットシェーバー   マーケットスカルパー このインジケーターはRPTradeProSolutionsシステムの一部です。 Market Scalperは、プライスアクション、ダイナミックサポート、レジスタンスを使用した毎日のトレンド指標です。 誰でも使用できるように設計されており、トレーディングの初心者でも使用できます。 決して塗り直さないでください。 表示は近いものから近いものへと示されます。 単独で使用するように設計されているため、他のインジケーターは必要ありません。 明確でシンプルな表示を提供します どのように機能しますか MarketShaverはDualTimeFramesシステムを使用しています。 主な傾向はより高いTFによって取られますが、より速いものは取引を閉じるために使用されます トレードは1つずつ示され、同時に2つのトレードが存在することはありません。 マーケットシェーバーは次のことを示しています。 いつ取引するか いつそれを止めるか、利益か損失か。 貿易報酬 適切な期間終了TFを設定するのに役立つ多くの統計 マーケットシェーバーは動作します
A tall upper shadow occurs when the price moves during the period, but goes back down, which is a bearish signal. A tall lower shadow forms when bears push the price down, but bulls pull it back up, which leaves a long line or shadow. This is considered a bullish signal. Some technical analysts believe a tall or long shadow means the stock will turn or reverse. Some believe a short or lower shadow means a price rise is coming. In other words, a tall upper shadow means a downturn is coming, whil
A technical indicator that calculates its readings on trading volumes. In the form of a histogram, it shows the accumulation of the strength of the movement of the trading instrument. It has independent calculation systems for bullish and bearish directions. Works on any trading instruments and time frames. Can complement any trading system. The indicator does not redraw its values, the signals appear on the current candle. It is easy to use and does not load the chart, does not require additi
Time Bubble ***Specialized for GBPJPY 1H time frame*** (tested for two years with success rates about 82%) Time Circle's smart algorithm detects the price circles with time . give strong signals at the right time as result of combine the price and time. our team spent months to develop this indicator specially for GBPJPY ..with high success rates about 82% win trades over two years .tested from December 2016 to November 2018. *** in last two years total signals 1012 with 829 Wins and
Forex Gump
Andrey Kozak
2.4 (5)
Forex Gump is a fully finished semi-automatic trading system. In the form of arrows, signals are displayed on the screen for opening and closing deals. All you need is to follow the instructions of the indicator. When the indicator shows a blue arrow, you need to open a buy order. When the indicator shows a red arrow, you need to open a sell order. Close orders when the indicator draws a yellow cross. In order to get the most effective result, we recommend using the timeframes H1, H4, D1. There
After working during many months, with the help of Neural Networks, we have perfected the ultimate tool you are going to need for identifying key price levels (Supports and Resistances) and Supply and Demand zones. Perfectly suitable to trigger your trades, set up your future actions, decide your Take Profit and Stop Loss levels, and confirm the market direction. Price will always move between those levels, bouncing or breaking; from one zone to another, all the remaining movements are just mark
フィボナッチリトレースと拡張ラインツール DiNapoliポイント取引方法とゴールデンセクション取引を使用するトレーダーにとって理想的なMT4プラットフォームのフィボナッチリトレースと拡張ラインツール 主な特長: あなたはフィボナッチリトレースメントの複数のセットを直接描くことができ、重要なリターンポイント間の関係は一目瞭然です。 2.フィボナッチ拡張を描画することができます。 3.フィボナッチフォールドバックとラインの延長は、簡単な観察と数値表示のために左右に動かすことができます。 4.チャートは非常に爽やかな 5.数字キーでサイクルを切り替えることができます。 ファンクションキー: 1。 [戻るを押す、要求に応じて描画する、最大8つのグループにする 2。拡張]を描くには[押す] 3。 \を押すと、現在のサイクルの下にあるすべての拡張機能と折り畳みが削除されます 4。フォールドバックを移動して削除して展開する (1)最初のフォールドバックセットのF5行をクリックします。 一度クリックすると(黄色に変わります)、キーボードのDel
Super Reversal Pattern Indicator Unlock the power of advanced pattern recognition with our Super Reversal Pattern Indicator. Designed for traders seeking precision and reliability, this indicator identifies one of the most effective reversal patterns in technical analysis, offering a significant edge in your trading strategy. Key Features: Non-Repainting Accuracy: Enjoy the confidence of non-repainting technology. Once a Super Reversal Pattern is detected, it remains static, providing consis
Trend Bilio - an arrow indicator without redrawing shows potential market entry points in the form of arrows of the corresponding color: upward red arrows suggest opening a buy, green down arrows - selling. The entrance is supposed to be at the next bar after the pointer. The arrow indicator Trend Bilio visually "unloads" the price chart and saves time for analysis: no signal - no deal, if an opposite signal appears, then the current deal should be closed. It is Trend Bilio that is considered
The Volume by Price Indicator for MetaTrader 4 features Volume Profile and Market Profile TPO (Time Price Opportunity). Volume and TPO histogram bar and line charts. Volume Footprint charts. TPO letter and block marker collapsed and split structure charts. Static, dynamic and flexible range segmentation and compositing methods with relative and absolute visualizations. Session hours filtering and segment concatenation with Market Watch and custom user specifications. Graphical layering, positio
Introduction to Chart Pattern MT Chart Pattern MT is a chart pattern scanner to detect the triangle pattern, falling wedge pattern, rising wedge pattern, channel pattern and so on. Chart Pattern MT uses highly sophisticated chart pattern detection algorithm. However, we have designed it in the easy to use with intuitive user interface. Chart Pattern MT will show all the patterns in your chart in the most efficient format for your trading. You do not have to do tedious manual pattern detection an
The Penta-O is a 6-point retracement harmonacci pattern which usually precedes big market movements. Penta-O patterns can expand and repaint quite a bit. To make things easier this indicator implements a twist: it waits for a donchian breakout in the right direction before signaling the trade. The end result is an otherwise repainting indicator with a very reliable trading signal. The donchian breakout period is entered as an input. [ Installation Guide | Update Guide | Troubleshooting | FAQ | A
Volume Profile Indicator for MT4 Gain a trading edge with the "Volume Profile" indicator for MetaTrader 4 (MT4). This advanced technical analysis tool allows you to precisely identify key support and resistance levels based on transaction volume. Easily visualize market areas of high interest, where trading volumes are highest, and use this information to make more informed trading decisions. Key Features: Clear and detailed visualization : The indicator displays volume histograms directly on th
Magic Filter MTF is perfect for any strategy. you do not need to load the chart with extra indicators like this one indicator will replace all additional filters for you it can also be a great strategy. it combines well with trading at local minima and maximums (resistance levels) multi-timeframe-multi-currency indicator 4 screen system is used 4 rows of arrows UTB indicators adjusted for different periods when two arrows pointing in the same direction on the same timeframe coincide
To get access to MT5 version please click here . - This is the exact conversion from TradingView: "Stochastic Momentum Index" By "UCSgears". - This is a popular version of stochastic oscillator on tradingview. - This is a light-load processing and non-repaint indicator. - Buffers are available for the lines on chart. - You can message in private chat for further changes you need. Thanks for downloading
このプロダクトを購入した人は以下も購入しています
This indicator is based on the mathematics of the great trader W.D. Ganna. With its help, you can easily find strong levels by analyzing swings to find the optimal entry point. The indicator works on all instruments and all timeframes. The indicator is fully manual and has control buttons. All you need to do is press the NEW button, a segment will appear, which you can place on any movement, swing or even 1 candle that you want to analyze. By placing the segment, press the OK button. A grid (th
Previous Price : $323.00 Current Price: $359.00 Future Price: Will increase soon NOTICE Please DO NOT buy this indicator if you are just learning about smart money movement . You need to have some experience with accumulation and distribution to fully grasp the gravity of this indicator. Since smart money does not play by the book , so this indicator was only developed to find their trail that they did not bother to hide . If the signals do not correspond to your trading style, this is not the
Enigmera
Ivan Stefanov
5 (3)
エニグメラ:市場の中核 https://www.enigmera.com はじめに このインディケータと取引システムは、金融市場に対する驚くべきアプローチです。ENIGMERAは、フラクタルサイクルを使用して、サポートとレジスタンスレベルを正確に計算します。本格的な蓄積局面を示し、方向性と目標を示します。 トレンド中でも調整中でも機能するシステムです。 どのように作動するのか? ENIGMERAは、支持線・抵抗線、目標線、乖離線の3つのラインで構成されています。このシステムは、過去のデータを現在と未来に外挿する典型的な市場指標とは異なり、現在の完全な画像を提供します。支持線上にある場合、それは本当の支持を意味し、抵抗線上にある場合、それは本当の抵抗を意味する。ある水準が破られた場合、それはトレンドの変化を意味する。再描画はしない。 市場は常に進化しているため、ENIGMERAはその評価ツールを適応させ、定期的に戦略を修正しています。  これにより、すべてのシナリオが徹底的に評価されることが保証されます。この市場指標の独自性は、その能力を見れば明らかです。  ENIGM
製品を購入する前に、以下の情報をお読みください。 Apollo Pips PLUS SP はユニークな製品です。これは、私の新しい「アポロ ピップス」インジケーターと、私のすべての取引インジケーターにアクセスできる「スーパー パック」ボーナスを手に入れたい人のためのものです。 Apollo Pips PLUS SP 製品を購入すると、実際には私の Apollo Pips インジケーターのまったく新しいバージョンを購入することになります。このバージョンのインジケーターには改良されたアルゴリズムと使いやすいパラメーターがあり、あらゆる市場およびあらゆる取引スタイルでインジケーターを使用する機会が得られます。 この製品の購入者は、私のスーパーボーナスとして、他のすべてのインジケーターにも無料でアクセスできます!私のすべての取引ツールにアクセスしたい場合は、この製品が最適です!:) しかし、これがすべてではありません!:) この製品のすべての購入者は、私の新しいインジケーターを無料で入手する資格もあります!:)新しい取引インジケーターを利用できるようになりました。私の特権のある「スーパー パッ
Gold Channel is a volatility-based indicator, developed with a specific timing algorithm for the XAUUSD pair, which consists of finding possible corrections in the market. This indicator shows two outer lines, an inner line (retracement line) and an arrow sign, where the theory of the channel is to help identify overbought and oversold conditions in the market. The market price will generally fall between the boundaries of the channel. If prices touch or move outside the channel it is a tra
TrendMaestro
Stefano Frisetti
5 (3)
note: this indicator is for METATRADER4, if you want the version for METATRADER5 this is the link:  https://www.mql5.com/it/market/product/108106 TRENDMAESTRO ver 2.4 TRENDMAESTRO recognizes a new TREND in the bud, he never makes mistakes. The certainty of identifying a new TREND is priceless. DESCRIPTION TRENDMAESTRO identifies a new TREND in the bud, this indicator examines the volatility, volumes and momentum to identify the moment in which there is an explosion of one or more of these data a
Bomb Bank Signal
Igor Pereira Calil
5 (1)
Bomb Bank シグナル: MetaTrader 4 の信頼度インジケーター Bomb Bank Signal は、金融市場で最も関連性の高いトレンドを特定するように設計された MetaTrader 4 の強力なインジケーターです。動きを正確に予測するツールをお探しなら、Bomb Bank が最適です。 仕組み: このインジケーターは、出来高分析、ローソク足終値、対称トレンドという 3 つの異なる方法を組み合わせて、売買の機会を検出してシグナルを送ります。 Bomb Bank は、買いの機会を特定するときは「爆弾」のようなものであり、売りシグナルを検出するときは「ドクロ」のようなものです。 ボムバンクはなぜ違うのですか? 完全な信頼性: Bomb Bank Signal は信号を削除しません。一度シグナルが発せられると、シグナルは残り続けるので、チャンスを逃すことはありません。 極めて高い精度: Bomb Bank は誤った信号を送信しません。リアルタイムで最新情報を更新し、市場の進化に合わせて調整しながら、以前のシグナルの透明性を維持します。 ライブアップデ
How to use Pair Trading Station Pair Trading Station is recommended for H1 time frame and you can use it for any currency pairs. To generate buy and sell signal, follow few steps below to apply Pair Trading Station to your MetaTrader terminal. When you load Pair Trading Station on your chart, Pair Trading station will assess available historical data in your MetaTrader platforms for each currency pair. On your chart, the amount of historical data available will be displayed for each currency pai
Indicator : RealValueIndicator Description : RealValueIndicator is a powerful tool designed specifically for trading on the EURUSD pair. This indicator analyzes all EUR and USD pairs, calculates their real currency strength values, and displays them as a single realistic value to give you a head start on price. This indicator will tell you moves before they happen if you use it right. RealValueIndicator allows you to get a quick and accurate overview of the EURUSD currency pair tops and bottoms,
今、147ドル(いくつかの更新後に499ドルに増加します) - 無制限のアカウント(PCSまたはMac) RelicusRoad ユーザー マニュアル + トレーニング ビデオ + プライベート Discord グループへのアクセス + VIP ステータス 市場の新しい見方 RelicusRoad は、外国為替、先物、暗号通貨、株式、および指数の世界で最も強力な取引インジケーターであり、トレーダーに収益を維持するために必要なすべての情報とツールを提供します。初心者から上級者まで、すべてのトレーダーが成功するためのテクニカル分析と取引計画を提供します。これは、将来の市場を予測するのに十分な情報を提供する重要な取引指標です。意味をなさないチャート上のいくつかの異なる指標ではなく、完全な解決策を信じています.これは、信号、矢印 + 価格アクション情報を表示するオールインワンのインジケーターで、他に類を見ない非常に正確です。 強力な AI に基づいて、RelicusRoad は不足している情報とツールを提供して、あなたを教育し、トレーディングのプロ、成功したトレーダーにします。
Precautions for subscribing to indicator This indicator only supports the computer version of MT4 Does not support MT5, mobile phones, tablets The indicator only shows the day's entry arrow The previous history arrow will not be displayed (Live broadcast is for demonstration) The indicator is a trading aid Is not a EA automatic trading No copy trading function The indicator only indicates the entry position No exit (target profit)  The entry stop loss point is set at 30-50 PIPS Or the front
プレシジョン・インデックス・オシレーター(Pi-Osc)は、Precision Trading SystemsのRoger Medcalfによるものです。 バージョン2は、チャートにスーパーファストでロードされるように注意深く再コードされ、その他の技術的な改良も組み込まれて、エクスペリエンスを向上させています。 Pi-Oscは、市場が強制的に行かなければならない、すべての人のストップを取り除くためのポイントである、極限のエクソースト・ポイントを見つけるために設計された正確な取引タイミング信号を提供するために作成されました。 この製品は、極限のポイントがどこにあるかを知るという古代の問題を解決し、トレーダーの生活をはるかにシンプルにします。 これは、業界標準のオシレーターとは異なる強力な要素を持つ高度なコンセンサス・インジケーターです。 使用されている一部の機能には、需要指数、マネーフロー、RSI、スティリング、パターン認識、出来高分析、標準偏差の極値などがあり、異なる長さでこれらのバリエーションが多く含まれています。 初めて見ると、訓練されていない目には、他の
The Nihilist 5.0 Indicator includes Forexalien and Nihilist Easy Trend trading strategies and systems. It is composed of an MTF Dashboard where you can analyze the different input possibilities of each strategy at a glance. It has an alert system with different types of configurable filters. You can also configure which TF you want to be notified on your Metatrader 4 platform and Mobile application The indicator has the option to view how could be a TP and SL by using ATR or fixed points, even
ECM Elite Channel is a volatility-based indicator, developed with a specific time algorithm, which consists of finding possible corrections in the market. This indicator shows two outer lines, an inner line (retracement line) and an arrow sign, where the channel theory is to help identify overbought and oversold conditions in the market. The market price will generally fall between the boundaries of the channel. If prices touch or move outside the channel, it's a trading opportunity. The
Septermber OFFER 85% OFF next price for unlimited version will be 2500$. This is the only time you can get this institutional and professional indicator at this price for unlimited version. Don't dare to miss this. The tool I am about to introduce to you you can't compare it with other tools due to its strategy and accuracy level in predicting the next price directional movement. This tool is designed for serious traders who have decided to make a difference through trading. Be the next person t
Dear Traders this is my another tool called " Swing Master Indicator ". As the name above the indicator is designed to help you in swing trading by capturing the low and highs of the price. You may us this tool with any trading strategy and style from scalping to position trading. It is made for level of traders including newbies and advanced traders even prop-firms, hedge funds and banks to help them make sold market analysis. I create tools for serious traders who want to make a difference in
Introduction to X3 Chart Pattern Scanner X3 Cherart Pattern Scanner is the non-repainting and non-lagging indicator detecting X3 chart patterns including Harmonic pattern, Elliott Wave pattern, X3 patterns, and Japanese Candlestick patterns. Historical patterns match with signal patterns. Hence, you can readily develop the solid trading strategy in your chart. More importantly, this superb pattern scanner can detect the optimal pattern of its kind. In addition, you can switch on and off individu
This indicator is based on the Gann Signal indicator and acts as a market scanner. All you need to do is fill in the selected currency pairs in the settings and that’s it. Next, the indicator itself will view all these currency pairs and time frames from M5 to D1 simultaneously. When a new signal appears, the indicator will give you an Alert and also draw the letter N where this new signal will be.
Please send me Direct message on MQL5 CHAT after purchasing the Indicator for Training and Installation Support There are some additional files that is important to use with the Indicator . So be sure to contact me after purchasing the Indicator So that I can add you for training and support . If you find any difficulty with installation then send me Direct message here So that I can connect with you via Anydesk or Teamview for the product installation. " Smart Order Block Indicator " to find
The indicator is designed to work on any trading platform. The program is based on proprietary algorithms and W.D.Ganna's mathematics, allowing you to calculate target levels of price movement based on three points with the highest degree of certainty. It is a great tool for stock trading. The indicator has three buttons: NEW - call up a triangle for calculation. DEL - delete the selected triangle. DELS - completely remove all constructions. The probability of achieving the goals is more than 80
ADX Shark Scalper – The Ultimate Hybrid Indicator for Precision Scalping Dive into the markets with the ADX Shark Scalper , a powerful and versatile tool designed for traders who seek precision in every trade. This cutting-edge indicator seamlessly combines multiple advanced technical signals into one streamlined system, allowing you to spot good buy and sell opportunities with ease. At its core, the ADX Shark Scalper leverages the power of trend and momentum detection through the integration of
もちろんです。以下は、提供いただいたテキストの日本語への翻訳です: MT4用の天文学指標をご紹介します:究極の天体トレーディングコンパニオン トレーディング体験を天空の高みに高める準備はできていますか?私たちの革命的なMT4用の天文学指標をご紹介します。この革新的なツールは、複雑なアルゴリズムの力を借りて、類まれなる天文学的洞察と精密な計算を提供します。 あなたの指先で宇宙の情報を: 宝のような天文学的データが明らかになる包括的なパネルをご覧ください。惑星の地理的/太陽中心座標、太陽と地球の距離、星の大きさ、伸び、星座、黄道座標および赤道座標、さらには水平座標まで、それぞれが綿密に計算され美しく表示されています。指標によって生成される垂直線は時間値に対応し、トレーディングの旅に宇宙の視点を提供します。 惑星のラインと関係: グラフを飾る惑星のラインの魔法を体験し、スケールと角度をカスタマイズできます。直感的なコントロールパネルを介して各惑星のラインの表示を簡単に切り替えることができます。指定された時刻範囲内での合会、六分会、四分会、三分会、対会、逆行の指標で天体の関係の芸術を発見してく
Gann Signal is a very simple indicator at first glance, but hidden inside is many years of experience in studying W.D.Ganna methods. The indicator gives accurate BUY/SELL signals, without redrawing. The indicator is very easy to use. All you need to do is attach it to your chart and follow its recommendations. The indicator constantly analyzes the market for entry opportunities. When such an opportunity appears, the indicator gives a signal in the form of an arrow. I repeat, all signals are NOT
Connect Indicator is a tool used for connecting indicators between the MQL market and MT4. The connected indicators are made by our group and can be used for other applications, such as sending messages to the Line application or Telegram application. If you have any questions, please don't hesitate to ask us to receive support. Function and indicator buffer Buffer one is the high price of the previous candle. Buffer two is the high price of the previous candle. Usage To connect indicators to fu
Al in one level
Kundan Kumar Srivastava
5 (1)
This indicator is collection of important dynamic support and resistance giving a trader crystal clear idea , where to sell and where to buy. it completely complements trend lines, support, resistance, and sideways market and allow a trader to make sustainable profits. The thickness of lines suggests its strengths, the thicker the dynamic line, the stronger is rejection or pullback allowing a trader to make multi-fold profit, as they can clearly see them. Introducing Your Ultimate Trading Edge
This product is based on the methodologies of Gann, his follower Don E. Hall. The Indicator builds a working view grid, which is used to analyze graphics. The Pyrapoint tool, developed by Don Hall, is a grid based on the Pythagorean cube. In his calculations he uses the Gann Square 9 methodology and the relationship between Price and Time. This tool is used to predict changes in trend and overall market actions. More information about the method   HERE
This indicator ( dashboard) provides trend for multi currency on multi timeframe Charts. It gives entries and Stoploss on the chart itself  if the currency pair is uptrend then the cell color is displayed as Green and if its downtrend the cell displays the color as Red Alerts are generated whenever the trend changes on that particular timeframe. can customize the time frames as desired
ZeusArrow Smart Liquidity Finder  Smart Liquidity Finder is Ai controlled indicator based on the Idea of Your SL is My Entry. It scan and draws the major Liquidity areas on chart partitioning them with Premium and Discount Zone and allows you find the best possible trading setups and help you decide the perfect entry price to avoid getting your Stop Loss hunted . Now no more confusion about when to enter and where to enter. Benefit from this one of it's kind trading tool powered by Ai an trade
Max Payneは、矢印の形でシグナルを与える反転/トレンドシグナルインジケーターです。このインジケーターは、同じバーの終値でシグナルを出します。このインジケーターは、異なる期間でチャート上に複数回ドロップして、シグナルの2倍/3倍の確認を取得できます。 このインジケーターは、あらゆる取引スタイルに合わせて高度に調整できますが、再描画やバックペイントは一切行われません。購入後には、使用したテンプレートとともにスクリーンショットに表示される完全なシステムが表示されます。 ----------------- 取引方法: トレンドフィルター(購入後に得られるペイントレンド)が方向に一致している間、同じバーでトリプル確認が得られるまで待ちます 取引を開始し、買い取引の場合は金色の矢印 (テンプレート) より下、売り取引の場合は金色の矢印 (テンプレート) より上にストップロスを設定します。終了シグナルは最初の反対側の白い点のシグナル (テンプレート) です。 ----------------- パラメーター : 信号周期:矢印周期 フィルター: 信号フィルター 距離 : ローソクからの矢印
作者のその他のプロダクト
現在20%OFF! 初心者やエキスパートトレーダーのためのベストソリューション! このダッシュボードソフトウェアは、28の通貨ペアで動作しています。それは私達の主要な指標(高度な通貨の強さ28と高度な通貨インパルス)の2に基づいています。それは全体の外国為替市場の大きい概観を与えます。それは、すべての(9)時間枠で28の外国為替ペアのための高度な通貨の強さの値、通貨の動きの速度と信号を示しています。チャート上で1つのインディケータを使用して市場全体を観察し、トレンドやスキャルピングの機会をピンポイントで見つけることができたら、あなたのトレードがどのように改善されるか想像してみてください。 このインディケータには、強い通貨と弱い通貨の識別、潜在的な取引の識別と確認がより簡単になるような機能が搭載されています。このインディケータは、通貨の強さや弱さが増加しているか減少しているか、また、すべての時間枠でどのように機能しているかをグラフィカルに表示します。 新機能として、現在の市場環境の変化に適応するダイナミックなマーケットフィボナッチレベルが追加され、すでに当社のAdvan
現在33%オフ 初心者にもエキスパートトレーダーにも最適なソリューション このインジケーターは独自の機能と新しい公式を多数内蔵しており、ユニークで高品質かつ手頃な取引ツールです。このアップデートでは、2つの時間枠ゾーンを表示できるようになります。より長いTFだけでなく、チャートTFとより長いTF(ネストゾーンを表示)の両方を表示できます。すべてのSupply Demandトレーダーの皆さんのお気に召すはずです。:) 重要情報の公開 Advanced Supply Demandの可能性を最大化するには、 https://www.mql5.com/ja/blogs/post/720245 にアクセスしてください。   エントリーまたはターゲットの正確なトリガーポイントを正確に特定できれば取引がどのように改善されるか想像してみてください。新しい基盤となるアルゴリズムに基づいて構築されているため、買い手と売り手の間の潜在的な不均衡をさらに簡単に特定できます。これは、最も強い需要と供給のゾーンと、過去のパフォーマンス(古いゾーンを表示)がグラフィカルに表現されるためです。これらの機能は、最適
初心者やエキスパートトレーダーに最適なソリューション! このインジケーターは、独自の機能と新しい計算式を取り入れた、ユニークで高品質、かつ手頃な価格のトレーディングツールです。たった1枚のチャートで28の為替ペアの通貨強度を読み取ることができます。新しいトレンドやスキャルピングチャンスの引き金となるポイントを正確に特定することができるので、あなたのトレードがどのように改善されるか想像してみてください。 ユーザーマニュアルはこちら  https://www.mql5.com/en/blogs/post/697384 これが最初の1本、オリジナルだ! 価値のないクローンを買わないでください。 特別な サブウィンドウの矢印で強い通貨の勢いを表示 GAPがあなたのトレードを導く! 基準通貨や気配値が売られすぎ・買われすぎのゾーン(外相フィボナッチレベル)にあるとき、個別チャートのメインウィンドウに警告表示。 通貨がレンジの外側から反落した場合、プルバック/リバーサルのアラート。 クロスパターンの特別なアラート 複数の時間枠を選択可能で、トレンドを素早く確認できます。通貨強
Advanced Supply Demand
Bernhard Schweigert
4.91 (295)
現在33%オフ 初心者にもエキスパートトレーダーにも最適なソリューション このインジケーターは独自の機能と新しい公式を多数内蔵しており、ユニークで高品質かつ手頃な取引ツールです。このアップデートでは、2つの時間枠ゾーンを表示できるようになります。より長いTFだけでなく、チャートTFとより長いTF(ネストゾーンを表示)の両方を表示できます。すべてのSupply Demandトレーダーの皆さんのお気に召すはずです。:) 重要情報の公開 Advanced Supply Demandの可能性を最大化するには、 https://www.mql5.com/ja/blogs/post/720245 にアクセスしてください。   エントリーまたはターゲットの正確なトリガーポイントを正確に特定できれば取引がどのように改善されるか想像してみてください。新しい基盤となるアルゴリズムに基づいて構築されているため、買い手と売り手の間の潜在的な不均衡をさらに簡単に特定できます。これは、最も強い需要と供給のゾーンと、過去のパフォーマンス(古いゾーンを表示)がグラフィカルに表現されるためです。これらの機能は、最適
現在20%OFF! 初心者やエキスパートトレーダーに最適なソリューションです。 このインディケータは、エキゾチックペア・コモディティ・インデックス・先物など、あらゆるシンボルの通貨の強さを表示することに特化したインディケータです。金、銀、原油、DAX、US30、MXN、TRY、CNHなどの通貨の強さを表示するために、9行目にどのシンボルでも追加することができます。独自の機能を多数搭載し、新しい計算式を採用したため、ユニークで高品質、かつ手頃な価格のトレーディングツールとなっています。新しいトレンドやスキャルピングチャンスのトリガーポイントを正確に把握することができるため、あなたのトレードがどのように改善されるか想像してみてください。 ユーザーマニュアル:ここをクリック   https://www.mql5.com/en/blogs/post/708876 すべての時間枠に対応します。あなたはすぐにトレンドを見ることができるようになります! 新しいアルゴリズムに基づいて設計されているため、潜在的な取引の特定と確認がより簡単になります。これは、8つの主要通貨と1つのシンボ
現在26%オフ 初心者やエキスパートトレーダーに最適なソリューション! このインジケーターは、独自の機能と新しい計算式を取り入れた、ユニークで高品質、かつ手頃な価格のトレーディングツールです。たった1枚のチャートで28の為替ペアの通貨強度を読み取ることができます。新しいトレンドやスキャルピングチャンスの引き金となるポイントを正確に特定することができるので、あなたのトレードがどのように改善されるか想像してみてください。 ユーザーマニュアルはこちら  https://www.mql5.com/en/blogs/post/697384 これが最初の1本、オリジナルだ! 価値のないクローンを買わないでください。 特別な サブウィンドウの矢印で強い通貨の勢いを表示 GAPがあなたのトレードを導く! 基準通貨や気配値が売られすぎ・買われすぎのゾーン(外相フィボナッチレベル)にあるとき、個別チャートのメインウィンドウに警告表示。 通貨がレンジの外側から反落した場合、プルバック/リバーサルのアラート。 クロスパターンの特別なアラート 複数の時間枠を選択可能で、トレンドを素早く
現在31%オフ! 初心者やエキスパートトレーダーに最適なソリューション! このインジケータは、独自の機能と秘密の数式を組み込んだ、ユニークで高品質かつ手頃な価格のトレーディングツールです。たった1枚のチャートで28の通貨ペアのアラートを表示します。新しいトレンドやスキャルピングチャンスの引き金となるポイントを正確に把握することができるので、あなたのトレードがどのように改善されるか想像してみてください! 新しい基本的なアルゴリズムに基づいて構築されているため、潜在的な取引の特定と確認がより簡単になります。これは、通貨の強さや弱さが加速しているかどうかをグラフィカルに表示し、その加速のスピードを測定するためです。加速すると物事は明らかに速く進みますが、これはFX市場でも同じです。つまり、反対方向に加速している通貨をペアにすれば、利益を生む可能性のある取引を特定することができるのです。 通貨の勢いを示す縦の線と矢印は、あなたの取引の指針となるでしょう。 ダイナミックマーケットフィボナッチ23レベルはアラートトリガーとして使用され、市場の動きに適応します。もしインパルスが黄色
このインディケータは、当社の2つの製品 Advanced Currency IMPULSE with ALERT  +   Currency Strength Exotics . のスーパーコンビネーションです。 このインジケーターは全ての時間枠で作動し、8つの主要通貨と1つのシンボルの強弱のインパルスをグラフで表示します。 このインジケータは、金、エキゾチックペア、商品、インデックス、先物など、あらゆるシンボルの通貨強度の加速度を表示することに特化されています。金、銀、原油、DAX、US30、MXN、TRY、CNHなどの通貨強度の加速度(インパルスまたは速度)を表示するために、任意のシンボルを9行目に追加できる、この種の最初のものです。 新しいアルゴリズムに基づいて構築され、潜在的な取引の特定と確認がさらに容易になりました。これは、通貨の強さや弱さが加速しているかどうかをグラフィカルに表示し、その加速の速度を測定するためです。加速すると物事は明らかに速く進みますが、これはFX市場でも同じです。つまり、反対方向に加速している通貨をペアリングすれば、潜在的に利益を生む取
現在20%OFF! このダッシュボードは、複数のシンボルと最大9つのタイムフレームで動作するソフトウェアの非常に強力な部分です。 このソフトは、弊社のメインインジケーター(ベストレビュー:Advanced Supply Demand)をベースにしています。    Advanced Supply Demand ダッシュボードは、素晴らしい概要を提供します。それは示しています。  ゾーン強度評価を含むフィルタリングされた需給値。 ゾーン内/ゾーンへのPips距離。 ネストされたゾーンがハイライトされます。 選択されたシンボルの4種類のアラートを全ての(9)時間枠で提供します。 それはあなたの個人的なニーズに合わせて高度に設定可能です。 あなたの利益! すべてのトレーダーにとって最も重要な質問です。 市場に参入するのに最適なレベルはどこか? 成功のチャンスとリスク/リターンを得るために、強力な供給/需要ゾーン内またはその近くで取引を開始します。 損切りの最適な位置はどこですか? 最も安全なのは、強力な供給/需要ゾーンの下/上にストップを置くことで
現在20%OFF! 初心者やエキスパートトレーダーに最適なソリューションです。 このインジケータは、新しいフォーミュラとともに多くの独自の機能を組み込んでいるため、手頃な価格のトレーディングツールとなっています。 アドバンスド・アキュムレーテッド・カレンシー・ボリューム・インディケーターは、主要28通貨ペアに特化し、すべての時間枠で機能します。1つのチャート上でAUD, CAD, CHF, EUR, GBP, JPY, NZD, USDのすべての通貨ボリューム(C-Volume)を抽出する新しい計算式です。これは、トレードにおいて大きなアドバンテージとなります。ボリュームトレーダーはその使い方を知っているはずです。もしあなたが初心者なら、極端な値を読む方法を学び、あなたの取引の武器に加えましょう。 C-Volumeを銃としてではなく、盾として考えてください。 メインチャートに警告サインが表示され、間違った取引に入ることを警告してくれます。 これは、一般的に使用されているペアの単純なVolumeではありません。外国為替市場をスキャンし、各通貨の出来高を抽出し、C
My Trades in Pips
Bernhard Schweigert
4.81 (16)
見逃せないトレーディングツールです。このインジケータは、チャート上のすべてのトレード/ディールを、そのシンボルが付いている状態で表示します。利益または損失が何ピップスかを表示します。選択により、より良い分析のためにサブウインドウを通して垂直線を印刷します。 プロバージョンはこちらです。マイトレード履歴PRO https://www.mql5.com/en/market/product/50206 また、入金通貨と合計pipsのトレードの合計結果についての情報も追加されます。 当日のトレードのみ、または指定された数のバー内のトレードのみを表示するよう選択できます。 マジックナンバーを指定したトレードを表示することができます。0を指定すると、すべての取引が表示されます。マジックナンバーを指定すると、そのEAの取引のみが表示されます。マウスオーバーすると、注文番号、コメント、マジックナンバーが表示されます。 このインジケータは、主に私の他の通貨強度の専門インジケータの1つと一緒に使用されます。 https://www.mql5.com/en/blogs/post/679
FREE
現在26%OFF! このインディケータは、当社のメインインディケータ( Advanced Currency Strength 28   &  Advanced Currency IMPULSE with ALERT )の両方のスーパーコンビネーションです。28の外国為替ペアのTICK-UNITSとアラートシグナルの通貨強度の値を示しています。11種類のTick-Unitが使用可能です。1、2、3、4、5、6、10、12、15、20、30秒の11種類です。サブウィンドウのTick-Unitバーは、秒単位のタイマーに1ティック以上含まれる場合に表示され、左側にシフトされます。 たった1枚のチャートで、28のFXペアをスキャルピングできます。スキャルピングのチャンスとなるトリガーポイントを正確に把握することで、スキャルピングが上達することを想像してみてください。 1分足よりも短い期間で動作する市場初の通貨強度インジケーターです! このインジケータは、素早いインとアウトを行い、小さなピップを切り取ることを望む高速スキャルパーのためのものです。 ユーザーマニュアル: ここをクリ
現在20%オフ! 初心者やエキスパートトレーダーのためのベストソリューション! トレードを見直すことは、成功するトレーダーへの第一歩です。 成功するトレーダーは、定期的に自分の取引パフォーマンスを見直す習慣があります。 このツールは、まさにそれを行うのに役立ちます。 このツールであなたの取引を追跡することで、レビュープロセスが最も効果的になります。 手動取引またはEAの取引を分析します。 3つの一般的なビューを使用してください。ボタンをクリックするだけで切り替えることができます。 クローズド・トレード オープントレード クローズ+オープントレード すべての取引は、各シンボルごとに表示されます。他のシンボルに移動するには、シンボル名のボタンをクリックします。 新規にオープンした取引とクローズした取引にはAlertを使用します。オープントレードを監視するのに非常に便利です。EA、シグナル、または手動で開始されるかもしれません。 利益またはPIPsの結果を切り替えるには、ボタンをクリックするだけです。 利益 PIPs 次に、3つの分析タイ
初心者やエキスパートトレーダーに最適なソリューション! このインジケータは、独自の機能と秘密の数式を組み込んだ、ユニークで高品質かつ手頃な価格のトレーディングツールです。たった1枚のチャートで28の通貨ペアのアラートを表示します。新しいトレンドやスキャルピングチャンスの引き金となるポイントを正確に把握することができるので、あなたのトレードがどのように改善されるか想像してみてください! 新しい基本的なアルゴリズムに基づいて構築されているため、潜在的な取引の特定と確認がより簡単になります。これは、通貨の強さや弱さが加速しているかどうかをグラフィカルに表示し、その加速のスピードを測定するためです。加速すると物事は明らかに速く進みますが、これはFX市場でも同じです。つまり、反対方向に加速している通貨をペアにすれば、利益を生む可能性のある取引を特定することができるのです。 通貨の勢いを示す縦の線と矢印は、あなたの取引の指針となるでしょう。 ダイナミックマーケットフィボナッチ23レベルはアラートトリガーとして使用され、市場の動きに適応します。もしインパルスが黄色のトリガーラインに当た
フィルタ:
bollie15
34
bollie15 2024.10.04 13:09 
 

I like this seller his indicators and I instantly see the thousands of hours of experience he has and has put into creating these indicators. I must also add to the fact that this strategy he uses in trading is super simple, something I never tought of, but once you apply it in practice with this indicator it just works. It provides an edge and that is what we need as traders, EDGE! So this review is well deserved. He helped me out a lot with anything I needed and still does, even after the sale is done. I will never trade another strategy!

Bernhard Schweigert
82062
開発者からの返信 Bernhard Schweigert 2024.10.04 13:52
Thank you so much for the excellent review, my friend! 🌟
Your kind words mean a lot, and I truly appreciate you taking the time to share your experience. If you ever need anything or have any questions, don't hesitate to reach out. Wishing you continued success and many green pips ahead! 💹😊
レビューに返信
バージョン 1.1 2024.10.12
Update Description for Dynamic Forex28 Navigator - Version 1.1

We are excited to announce the release of Version 1.1 of Dynamic Forex28 Navigator!

Key Improvements:

Optimized Calculation Functions: The core algorithms have been fine-tuned to deliver faster and more accurate results, ensuring you have the most reliable data to base your trading decisions on.
Enhanced Export Capabilities: We’ve improved the export functionality for smoother and more efficient use in external applications. This feature is designed to support advanced users with specific needs. Please contact me.

Stay ahead of the game with this free update and enhance your overall trading performance!

Happy trading, and update today!