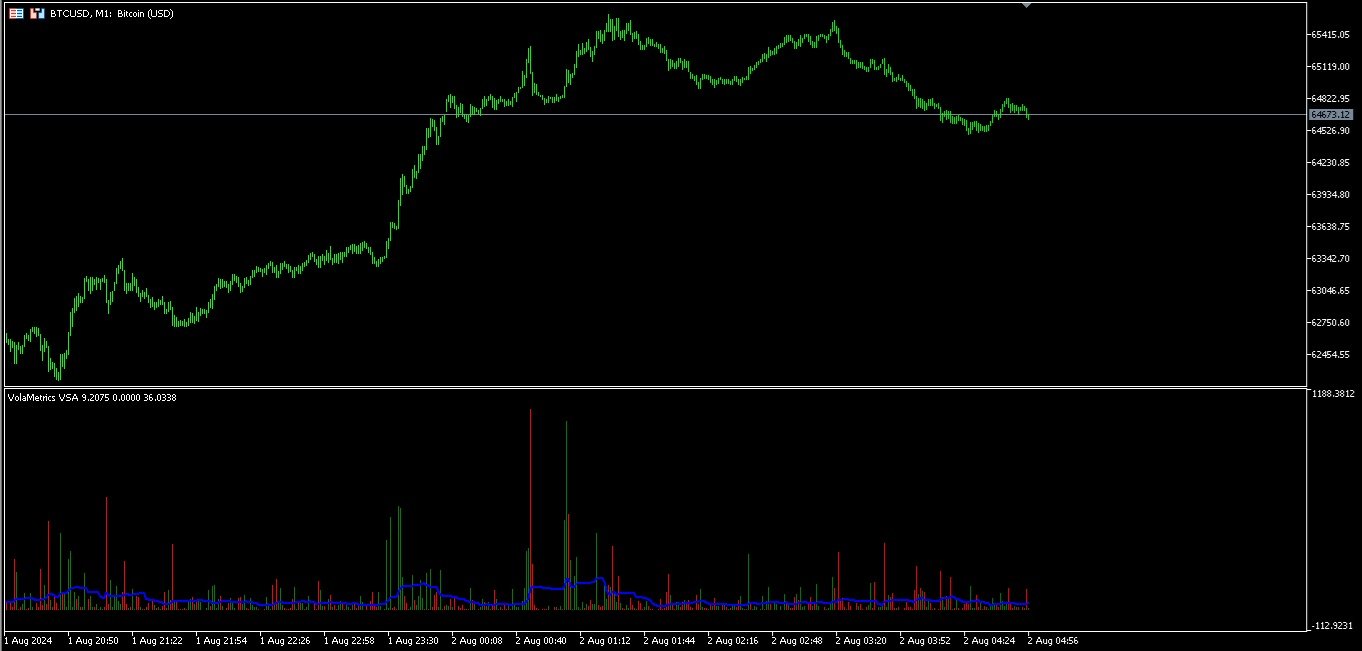
VolaMetrics VSA
- 指标
- Thalles Nascimento De Carvalho
- 版本: 1.0
- 激活: 5
VolaMetrics VSA 📊 | 技术分析中的强大助手
VolaMetrics VSA 是一种技术分析指标,结合了 Volume Spread Analysis (VSA) 方法论和详细的 交易量分析。旨在 识别 和 跟踪重大价格变动,VolaMetrics VSA 利用 交易量 和 价格差 的互动,提供有价值的洞察,帮助做出交易决策。
Volume Spread Analysis (VSA) 的基础 📈
Volume Spread Analysis (VSA) 是一种在技术分析中受到尊敬的方法,专注于理解 交易量、价格差(spread) 和 价格收盘 在特定时间段内的关系。VSA 基于这样一个理念,即最有信息的操盘手(聪明的钱)影响价格变动,通过识别 积累或分配信号,可以预测价格的重要变化。
VolaMetrics VSA 的工作原理 ⚙️
VolaMetrics VSA 自动化了传统的 VSA 分析,提供了一个可靠的工具来 检测潜在的反转信号 或 趋势延续信号。它分析 交易量 和 价格差 在多个周期中的表现,寻找可能指示重大机构活动的模式。
-
交易量分析 🔍: 监测交易量,以 检测异常的增加或减少,这可能预示着市场中大玩家的活动。
-
价格差 💵: 结合交易量分析价格差,以评估 价格变动的强度 或 弱点,帮助理解价格变动背后的动态。
-
市场背景 🛠️: 考虑 支撑位和阻力位 等因素,以调整 VSA 信号的解释,提高分析准确性。
反转信号和交易量 🚀
VolaMetrics VSA 能够有效识别 反转信号,如 交易量枯竭 或 过高的交易量,这些信号通常会在趋势变化前出现。这些信号基于对交易量和价格差的详细分析,帮助交易者识别市场的潜在转折点。
实际应用 🎯
-
积累/分配检测 🏦: 识别 积累 或 分配 阶段,这些阶段通常会在重大价格变动前出现。
-
趋势确认 ✅: 帮助验证 现有趋势的强度,支持决定是否维持或调整头寸。
-
反转信号 🔄: 显示可能的趋势反转信号,如 交易量枯竭 或 高交易量,使交易者能够更好地准备潜在的变化。
结论 📌 | 严肃交易者的可靠工具
VolaMetrics VSA 是一个宝贵的工具,适合寻求基于实际交易量和价格数据的详细技术分析的交易者。它细致入微的方法允许更准确地阅读市场,帮助做出明智的决策。