VolaMetrics VSA
- Indicateurs
- Thalles Nascimento De Carvalho
- Version: 1.0
- Activations: 5
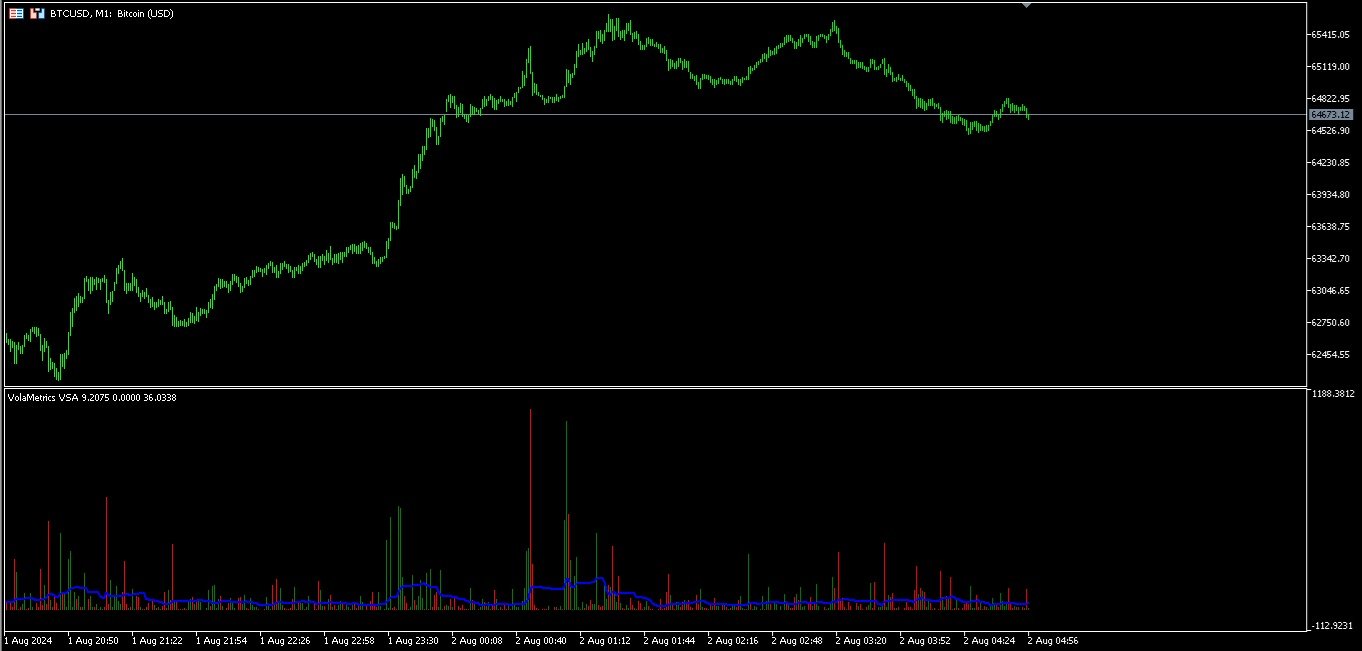
VolaMetrics VSA 📊 | Un Puissant Allié dans l'Analyse Technique
Le VolaMetrics VSA est un indicateur d'analyse technique qui combine la méthode Volume Spread Analysis (VSA) avec une analyse détaillée du volume des transactions. Conçu pour identifier et suivre les mouvements significatifs des prix, le VolaMetrics VSA utilise l'interaction entre volume et écart de prix pour fournir des insights précieux qui peuvent aider à prendre des décisions de trading.
Les Fondements de la Volume Spread Analysis (VSA) 📈
La Volume Spread Analysis (VSA) est une méthode respectée en analyse technique, centrée sur la compréhension de la relation entre volume de transactions, écart de prix et prix de clôture sur une période donnée. Basée sur l'idée que les opérateurs les mieux informés (smart money) influencent les mouvements des prix, la VSA permet d'identifier les signaux d'accumulation ou de distribution qui précèdent souvent des changements importants des prix.
Comment Fonctionne VolaMetrics VSA ⚙️
VolaMetrics VSA automatise l'analyse traditionnelle de la VSA et fournit un outil fiable pour détecter les signaux de retournement ou les signaux de continuation de tendance. L'indicateur analyse le volume des transactions et l'écart de prix sur plusieurs périodes et recherche des motifs indiquant une activité institutionnelle significative.
-
Analyse du Volume 🔍 : Surveille le volume pour détecter les augmentations ou diminutions anormales, ce qui peut signaler l'activité des grands acteurs du marché.
-
Écart de Prix 💵 : Analyse l'écart de prix en conjonction avec le volume pour évaluer la force ou la faiblesse d'un mouvement et comprendre la dynamique derrière les variations de prix.
-
Contexte du Marché 🛠️ : Prend en compte des facteurs tels que les supports et les résistances pour ajuster l'interprétation des signaux VSA, augmentant ainsi la précision de l'analyse.
Signaux de Retournement et Volume 🚀
VolaMetrics VSA est efficace pour identifier les signaux de retournement, comme l'épuisement du volume ou un volume excessivement élevé, qui précèdent souvent les changements de tendance. Ces signaux sont générés à partir d'une analyse détaillée du volume et de l'écart de prix, aidant les traders à identifier les points de retournement potentiels sur le marché.
Applications Pratiques 🎯
-
Détection d'Accumulation/Distribution 🏦 : Identifie les phases d'accumulation ou de distribution, qui précèdent souvent des mouvements importants des prix.
-
Confirmation de Tendances ✅ : Aide à valider la force d'une tendance existante, soutenant les décisions de maintien ou d'ajustement des positions.
-
Signaux de Retournement 🔄 : Fournit des signaux de possibles retournements de tendance, tels que l'épuisement du volume ou un volume élevé, permettant une meilleure préparation aux changements potentiels.
Conclusion 📌 | Un Outil Fiable pour les Traders Sérieux
Le VolaMetrics VSA est un outil précieux pour les traders cherchant une analyse technique approfondie basée sur des données réelles de volume et de prix. Son approche minutieuse et précise permet une lecture plus précise du marché, soutenant les décisions éclairées.