MultiSymbol and TF Chart Integrated
- 指标
- Martin Alejandro Bamonte
- 版本: 1.0
- 激活: 10
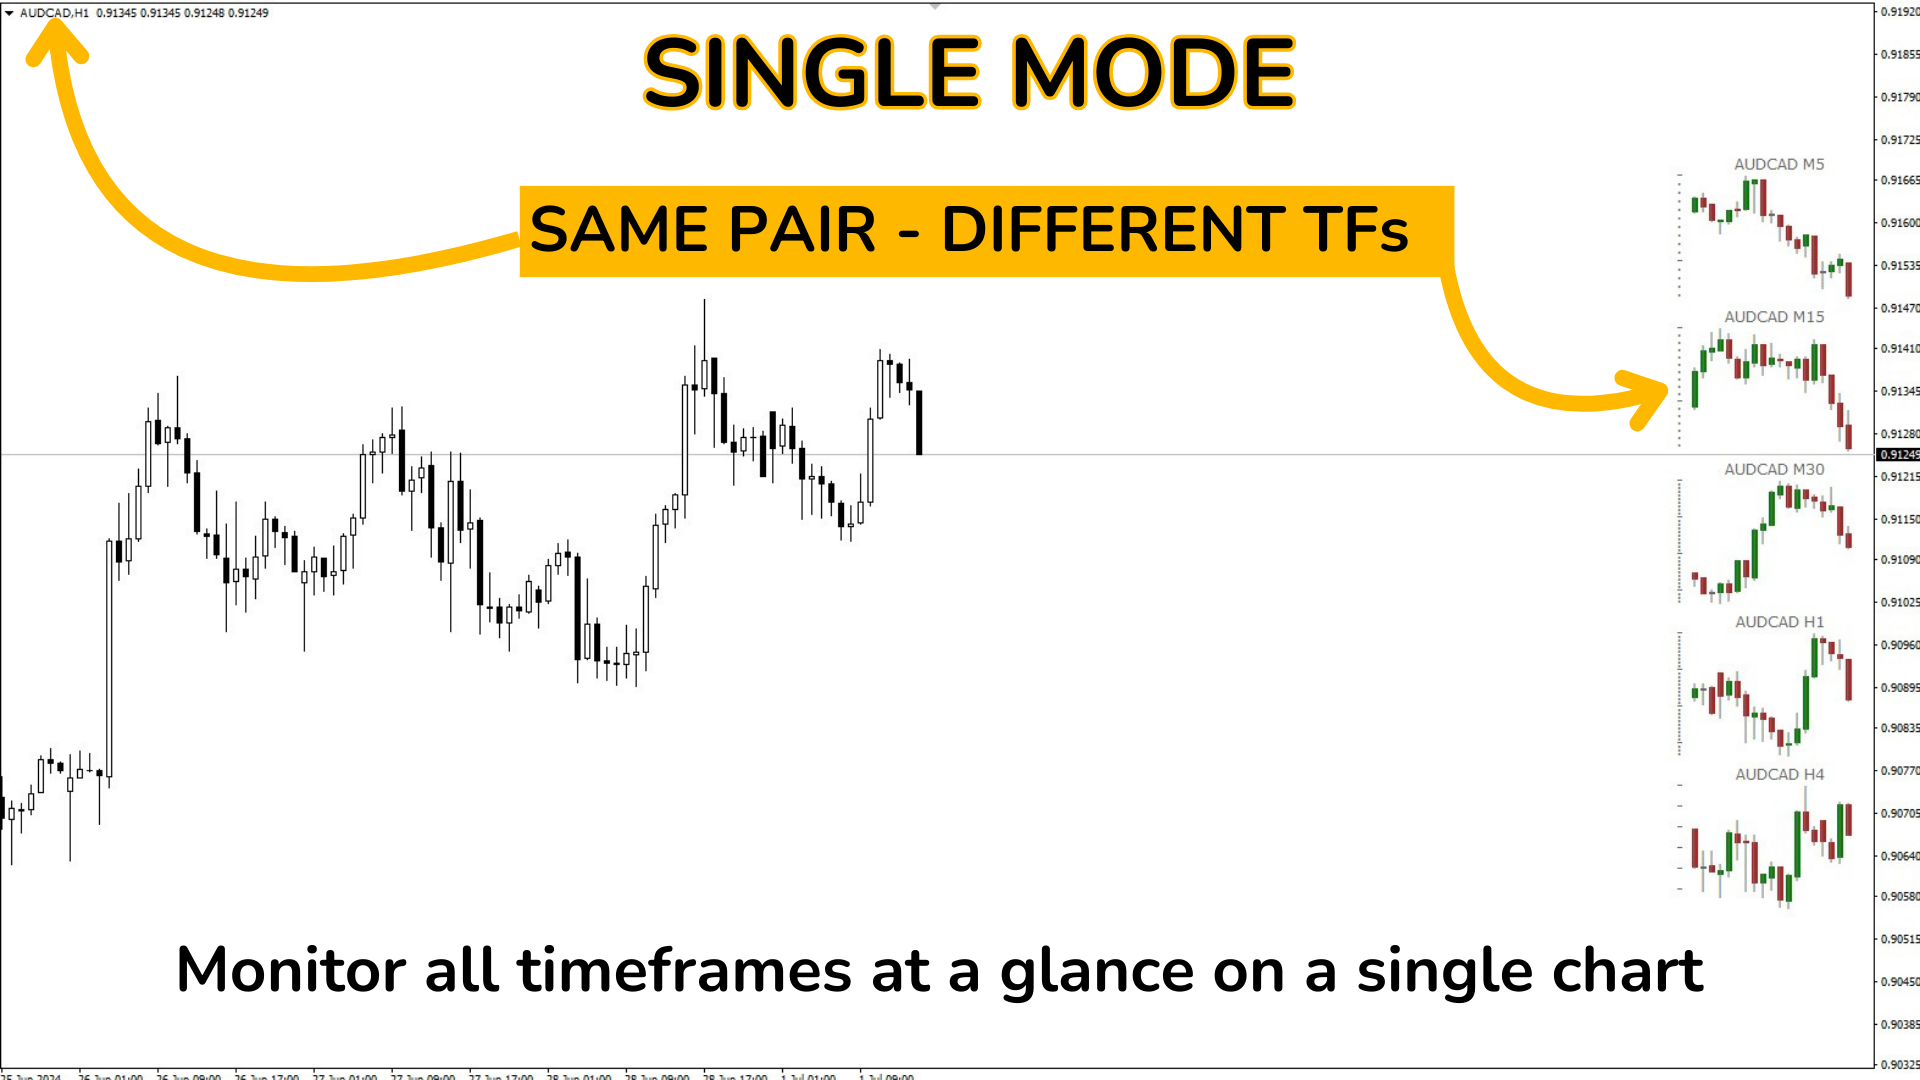
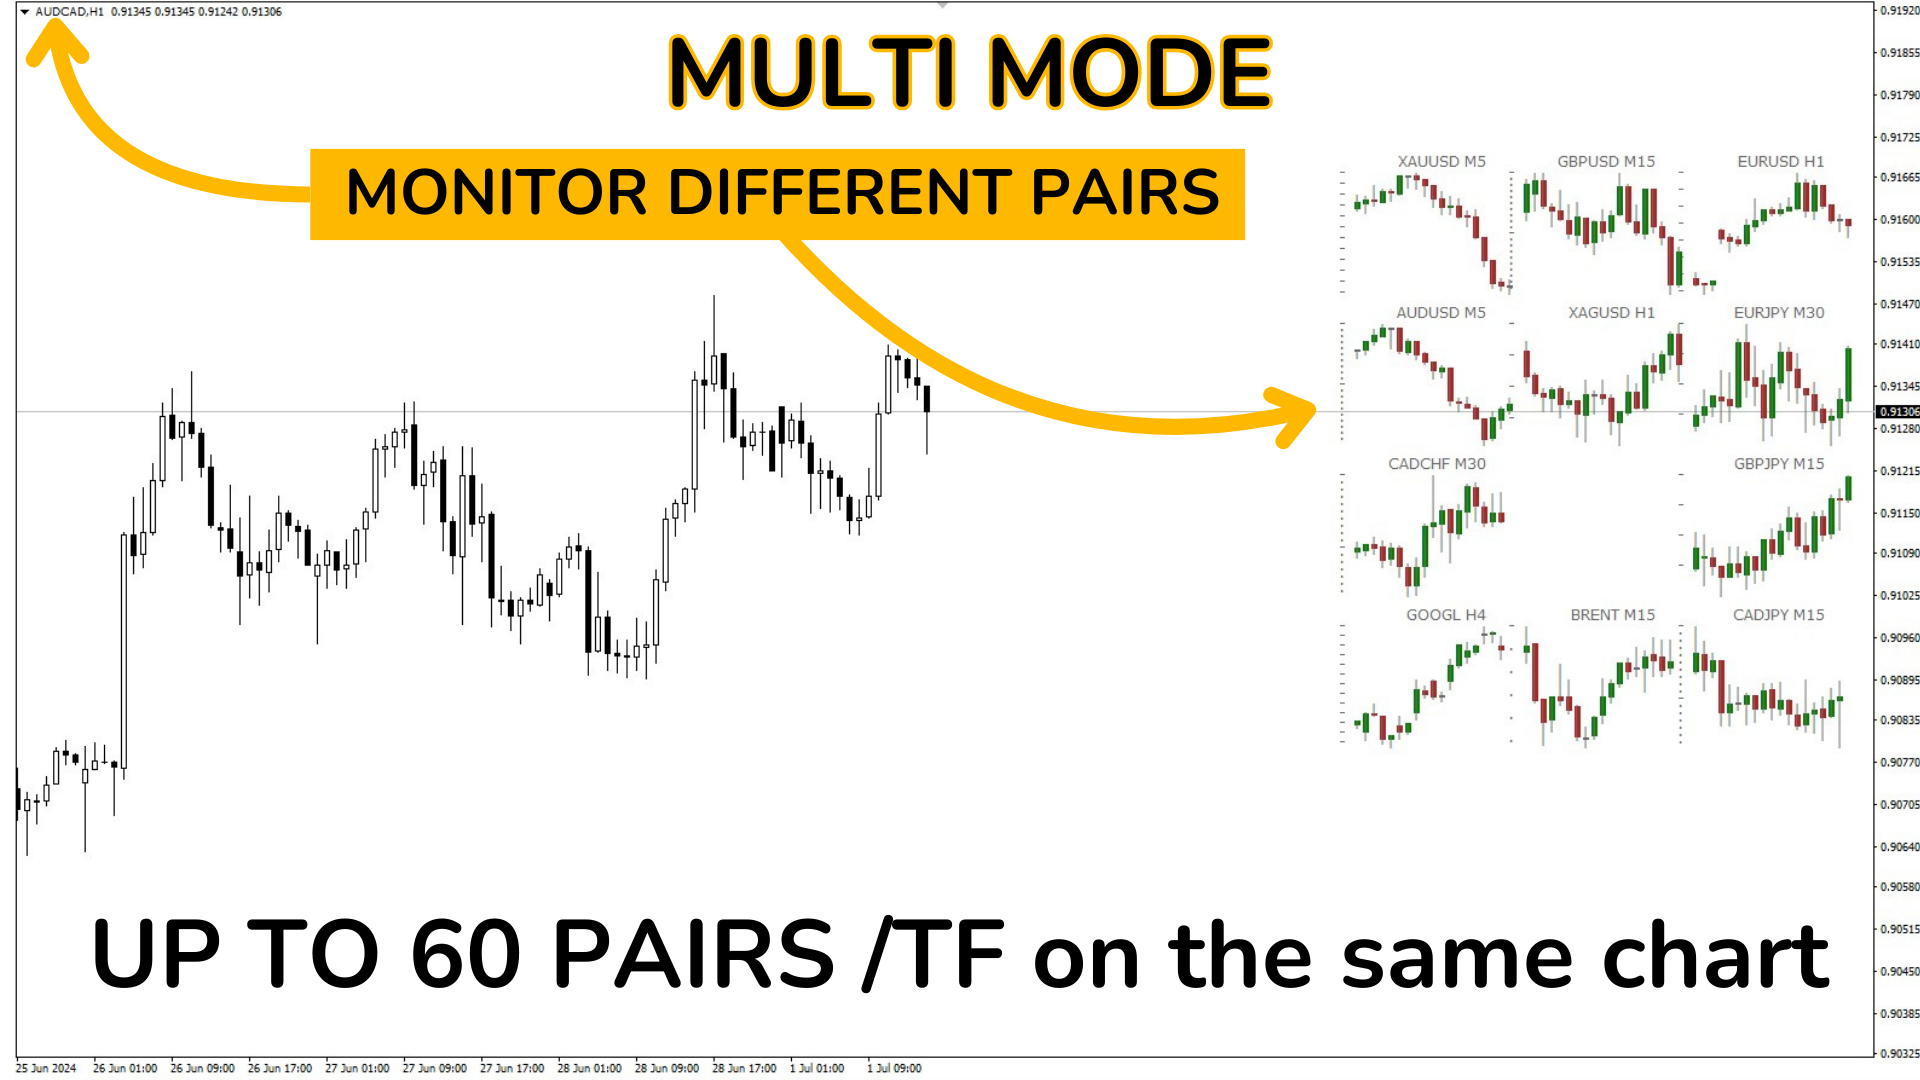
"MultiSymbol & TF Chart Integrated" 指标旨在快速提供全面的市场视图,允许您在单个图表上监控多达60个货币对(多模式)或在所有时间框架中查看您交易的货币对(简单模式)。
主要优点:
全面监控: 允许在单个图表上一目了然地实时监控所有所需的货币对。
节省时间: 避免了在图表之间切换的需要,实时查看每个货币对的行为。
趋势分析: 非常适合趋势交易者,允许您查看更高的时间框架以在做出决策前确认趋势。
极端定制化: 根据您的具体需求调整指标的每个方面。
极端定制化:
高度可配置的指标参数:
符号和时间框架:
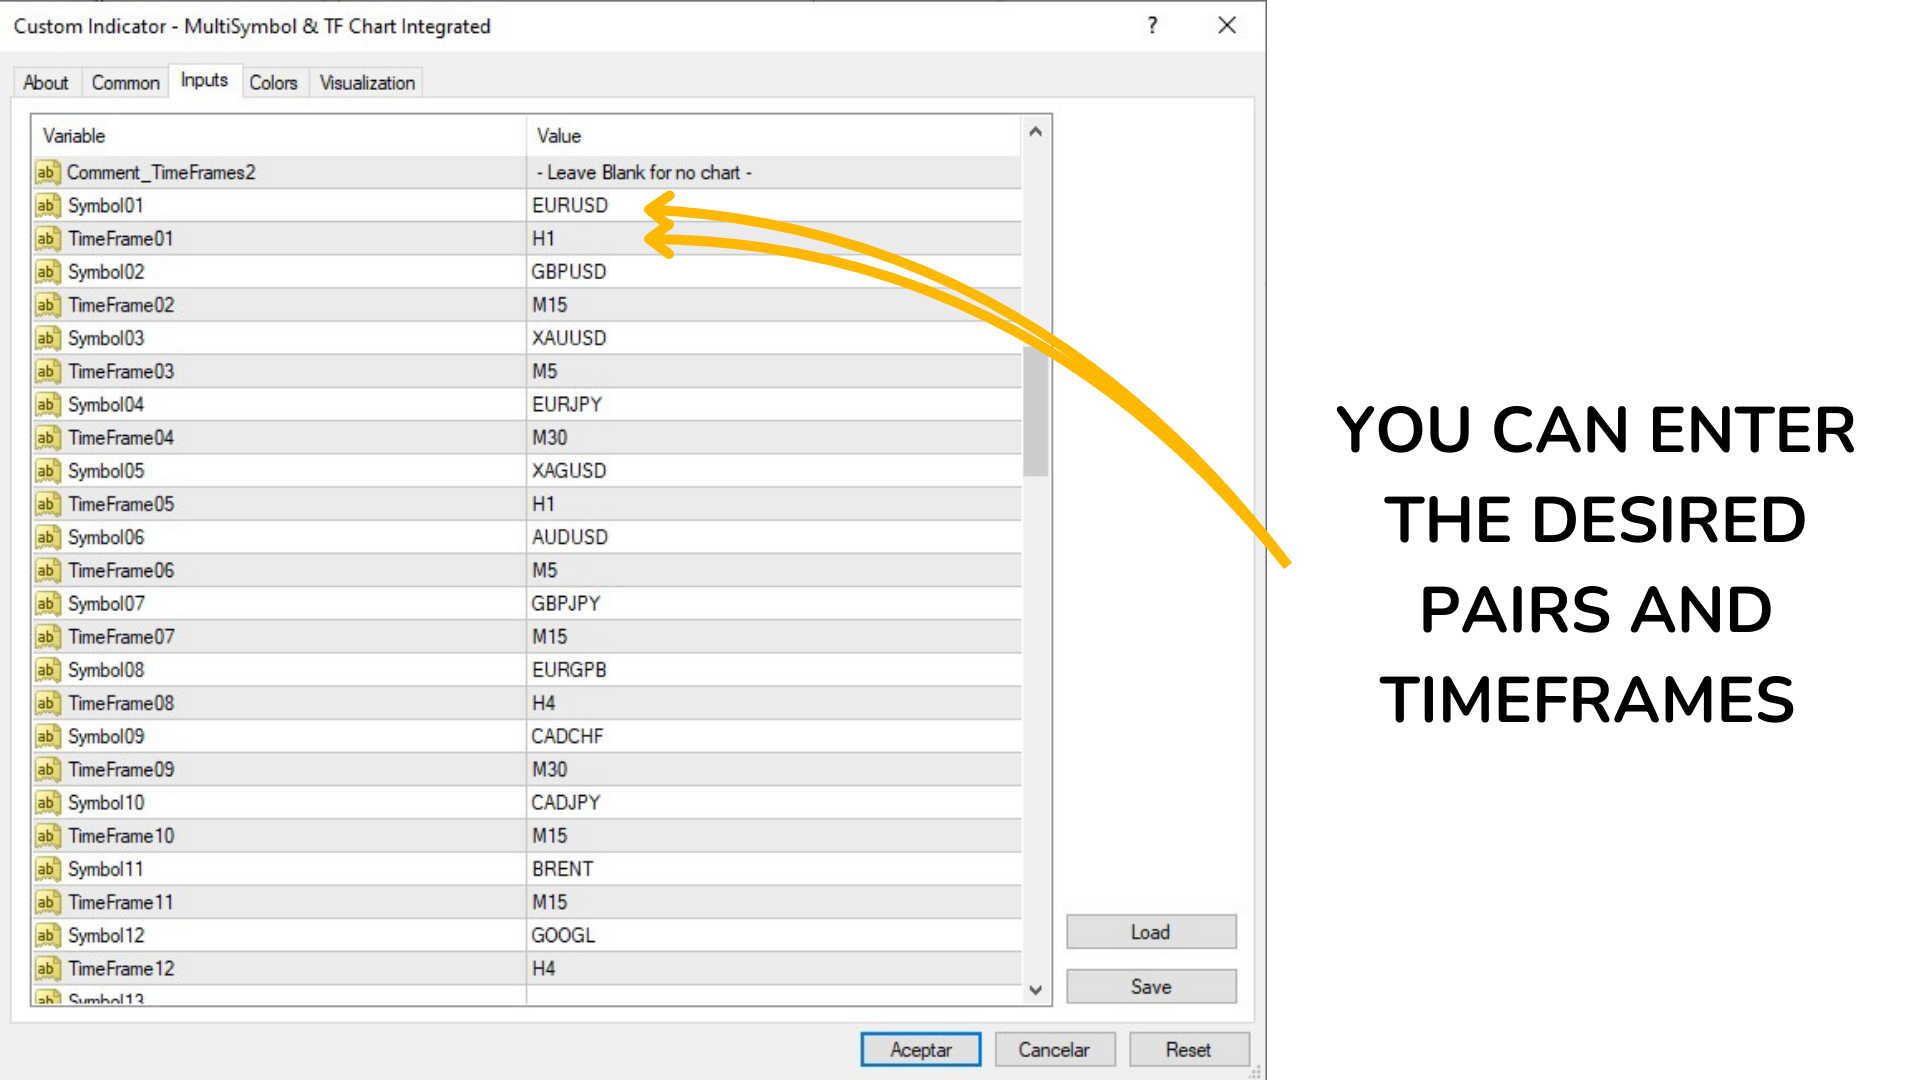
- 允许配置多达60个不同的符号。
- 每个符号可以有自己的时间框架(例如,M1,M5,M15,M30,H1,H4,D1,W1,MN1)。
显示模式:
- 简单模式: 配置具有特定时间框架的单个图表。
- 多模式: 配置具有不同符号和时间框架的多个图表。
颜色配置:
- 可定制的看涨和看跌蜡烛颜色。
- 蜡烛灯芯的颜色。
- 价格刻度的颜色。
缩放和定位:
- 基于价格范围和ATR的图表自动缩放。
- 使用像素参数定位图表。
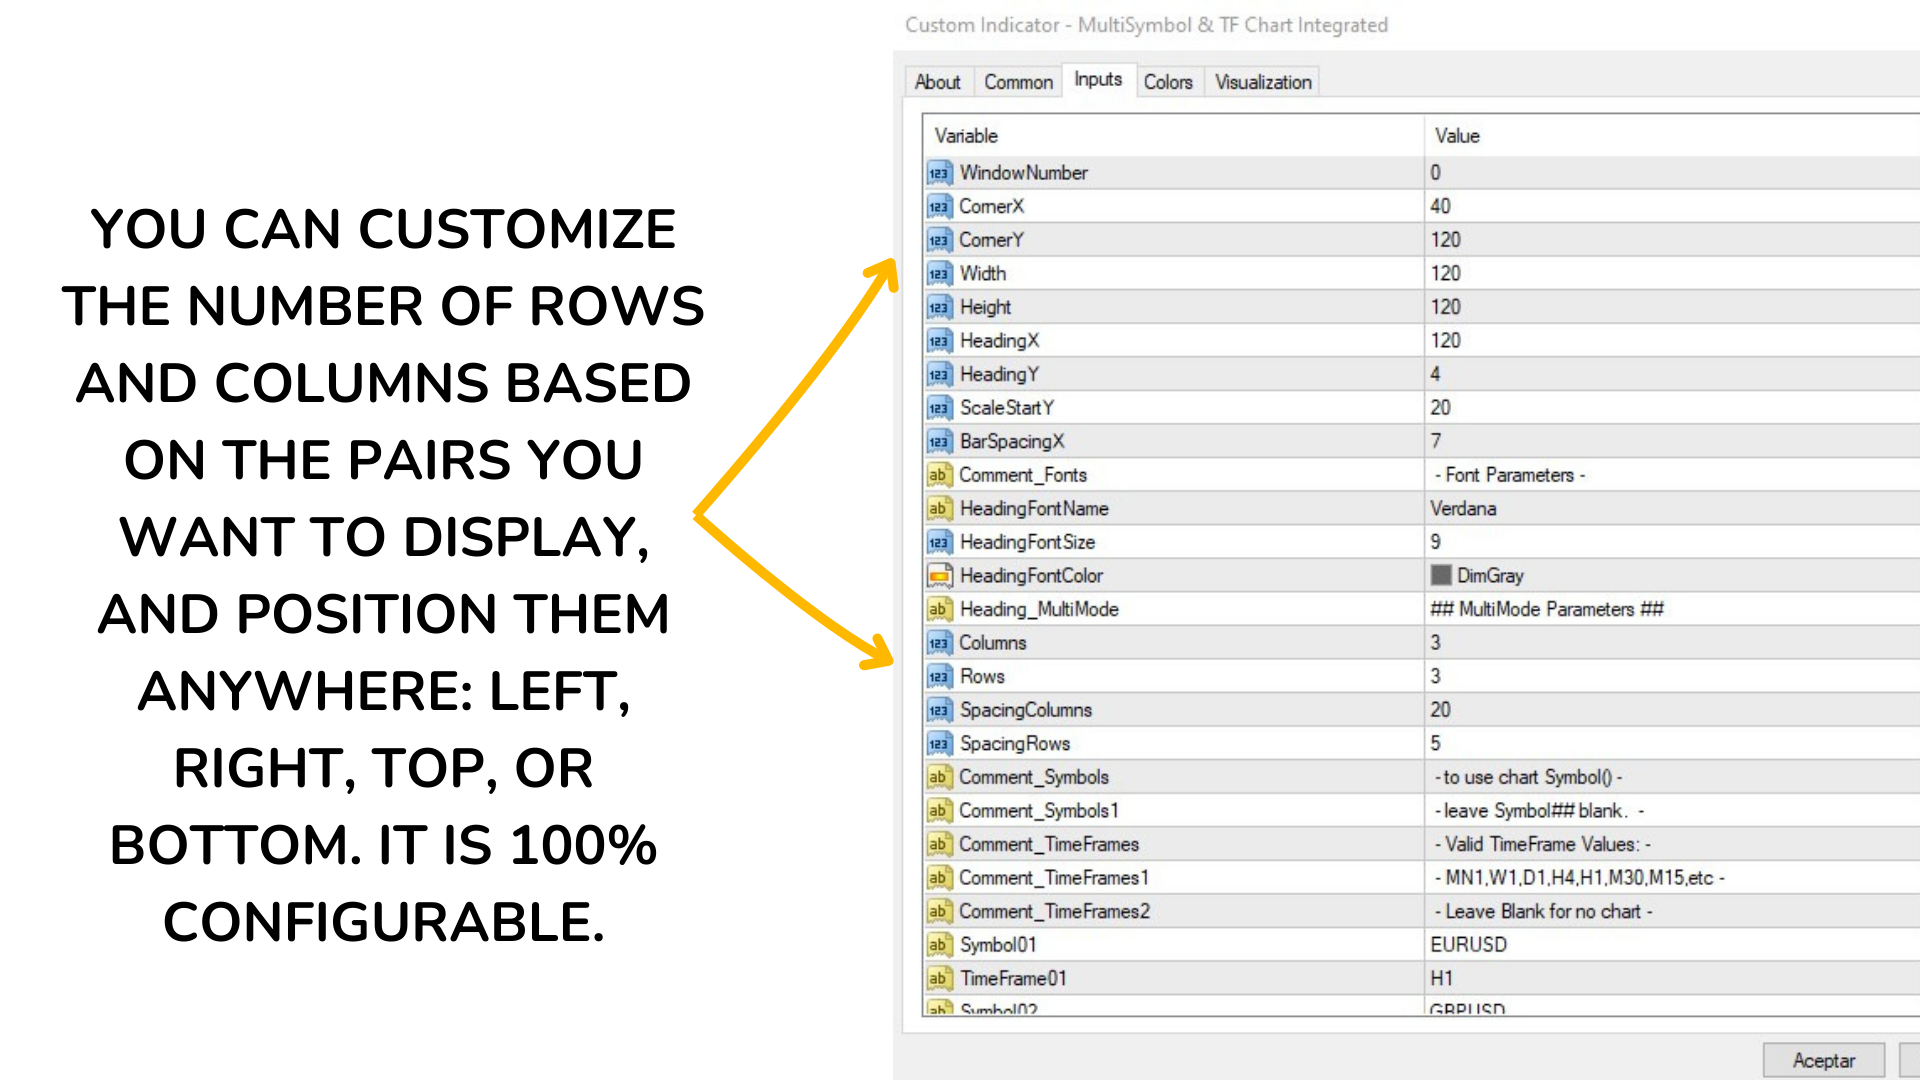
- 图表布局的行数和列数。
- 列与列之间的间距和行与行之间的间距。
- 图表窗口中的初始位置(X,Y)。
- 图表的像素大小(宽度和高度)。
字体配置:
- 标题和标签的字体名称和大小。
- 标题的字体颜色。
条形图配置:
- 每个图表上显示的条形图数量。
- 条形图之间的像素距离。
"MultiSymbol & TF Chart Integrated" 指标是任何寻求最大化时间的交易者必备的工具,可以快速查看所有所需的货币对,并根据策略交易最合适的货币对。其高度定制性和易用性使其成为所有级别交易者的理想选择。
使用指南根据您的具体需求调整参数:
指标外部参数的详细说明:
简单模式
Heading_SingleMode: ## 简单模式参数 ##
描述: 简单模式参数的标题(单个图表)。
Comment_TimeFrame: - MN1,W1,D1,H4,H1,M30,M15,等 -
描述: 指示有效时间框架的评论。
TimeFrame: H4
描述: 定义简单模式下图表的时间框架。您可以使用MN1(月度),W1(周),D1(每日),H4(4小时)等值。
Comment_Corner: - TopLeft=0,TR=1,BL=2,BR=3 -
描述: 解释图表在窗口中位置的值的评论。
Corner: 1
描述: 定义图表将在窗口中放置的角落。可能的值:0(左上角),1(右上角),2(左下角),3(右下角)。
多模式
Heading_ChartParam: ## 图表参数 ##
描述: 多模式参数的标题(多个图表)。
MultiMode: true
描述: 启用(true)或禁用(false)多模式。
CandleMode: false
描述: 定义是否显示蜡烛(true)或条形图(false)。
BarsToDisplay: 18
描述: 每个图表上显示的条形图或蜡烛数量。
AutoScale: true
描述: 启用(true)或禁用(false)基于价格范围和ATR(平均真实范围)的图表自动缩放。
ATRBars: 20
描述: 用于计算ATR的条形图数量。
ATRPixelsY: 30
描述: 分配给ATR进行缩放的垂直像素数。
颜色配置
WickColor: DimGray
描述: 蜡烛灯芯的颜色。
BullBarColor: Green
描述: 看涨蜡烛或条形图的颜色。
BearBarColor: FireBrick
描述: 看跌蜡烛或条形图的颜色。
ScaleColor: DimGray
描述: 价格刻度的颜色。
定位
Comment_Positioning: - 定位(以像素为单位) -
描述: 表示以下参数用于像素定位的评论。
WindowNumber: 0
描述: 将显示图表的窗口编号。通常,0是主窗口。
CornerX: 40
描述: 图表的初始X位置(以像素为单位)。
CornerY: 120
描述: 图表的初始Y位置(以像素为单位)。
Width: 120
描述: 图表的宽度(以像素为单位)。
Height: 120
描述: 图表的高度(以像素为单位)。
字体配置
HeadingFontName: Verdana
描述: 用于标题和标签的字体名称。
HeadingFontSize: 9
描述: 标题和标签的字体大小。
HeadingFontColor: DimGray
描述: 标题的字体颜色。
多模式配置
Heading_MultiMode: ## 多模式参数 ##
描述: 多模式特定参数的标题。
Columns: 3
描述: 图表的列数。
Rows: 3
描述: 图表的行数。
SpacingColumns: 20
描述: 图表列之间的像素间距。
SpacingRows: 5
描述: 图表行之间的像素间距。
符号和时间框架(共60个)
Symbol01: EURUSD
描述: 第一个图表的符号。您可以配置多达60个不同的符号。
TimeFrame01: H1
描述: 第一个图表的时间框架。每个符号可以有自己的时间框架。
这些参数重复到Symbol60和TimeFrame60,默认情况下为空,每个交易者可以根据自己的需要进行配置。
"MultiSymbol & TF Chart Integrated" 指标高度可配置,允许交易者在单个图表上完全自定义显示多个符号和时间框架,促进技术分析并提高决策效率。