• 概要
  • レビュー
  • コメント

MultiSymbol and TF Chart Integrated

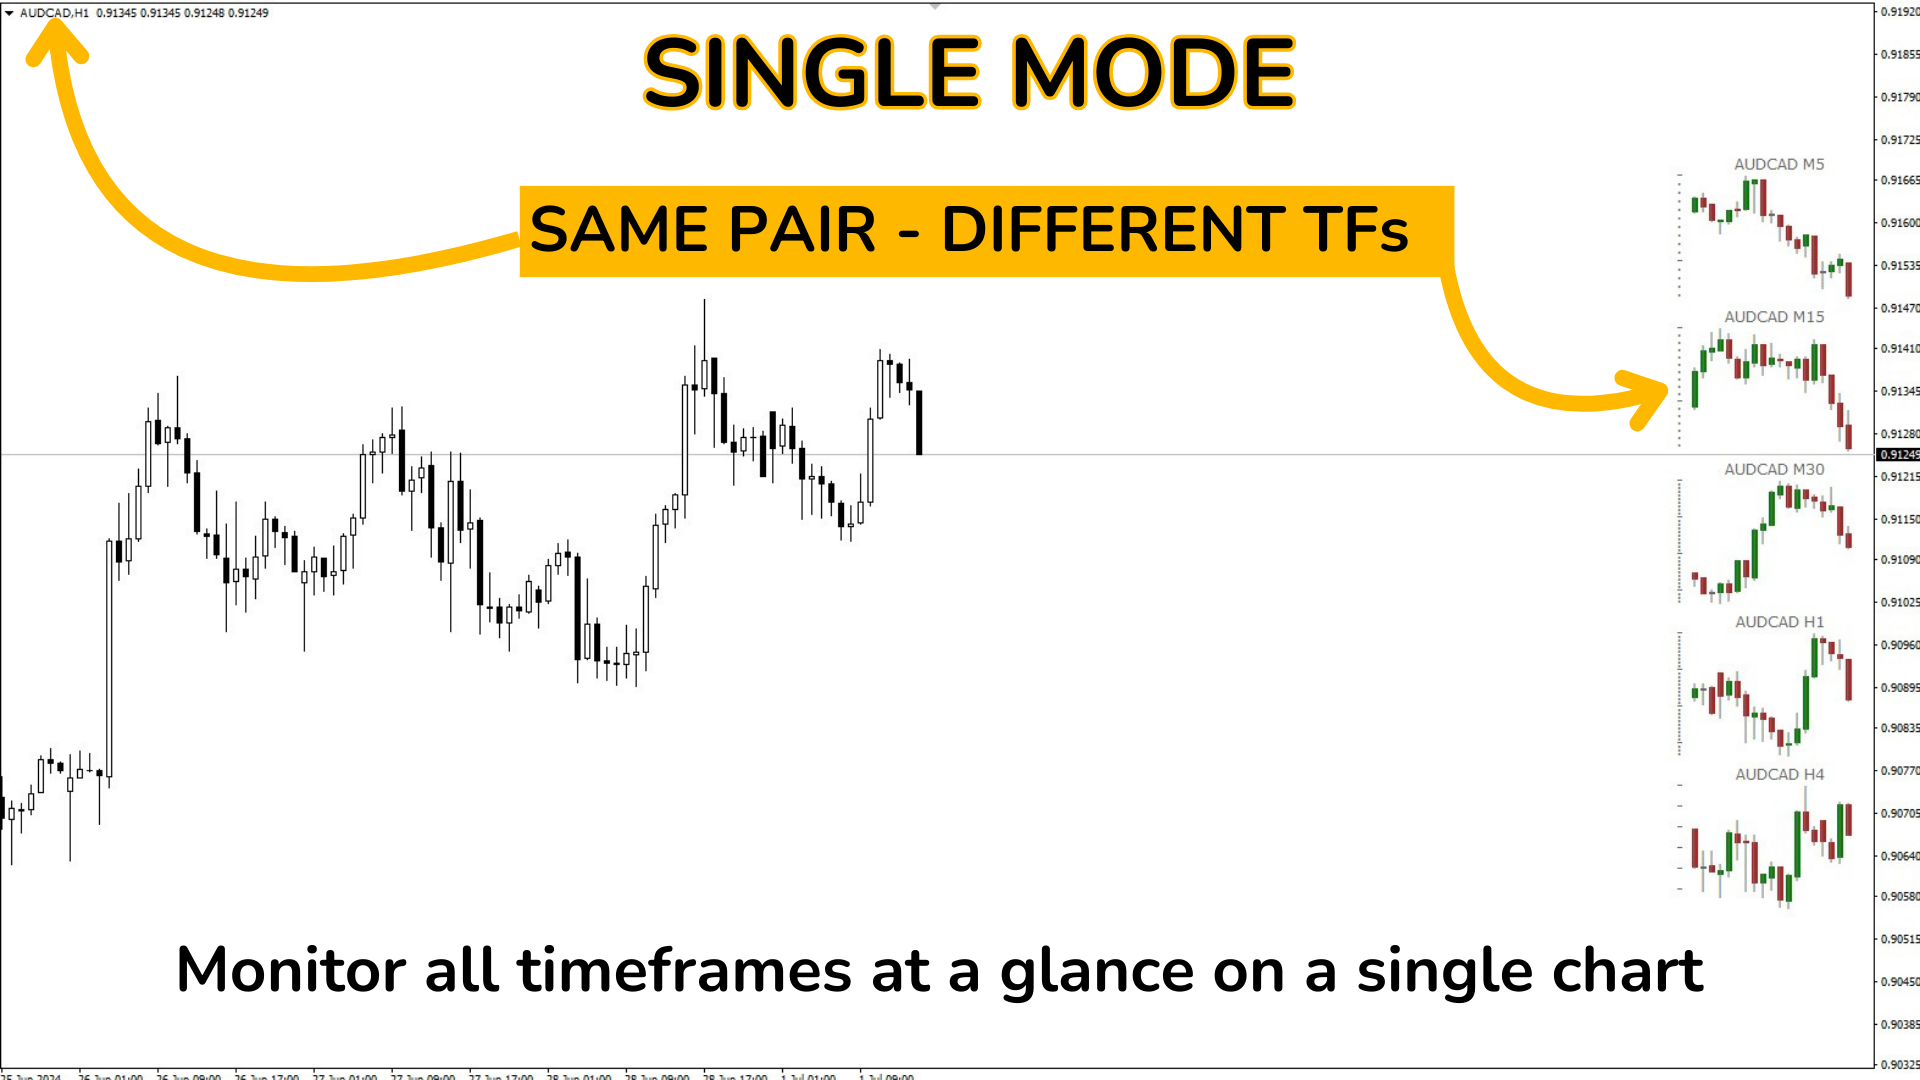
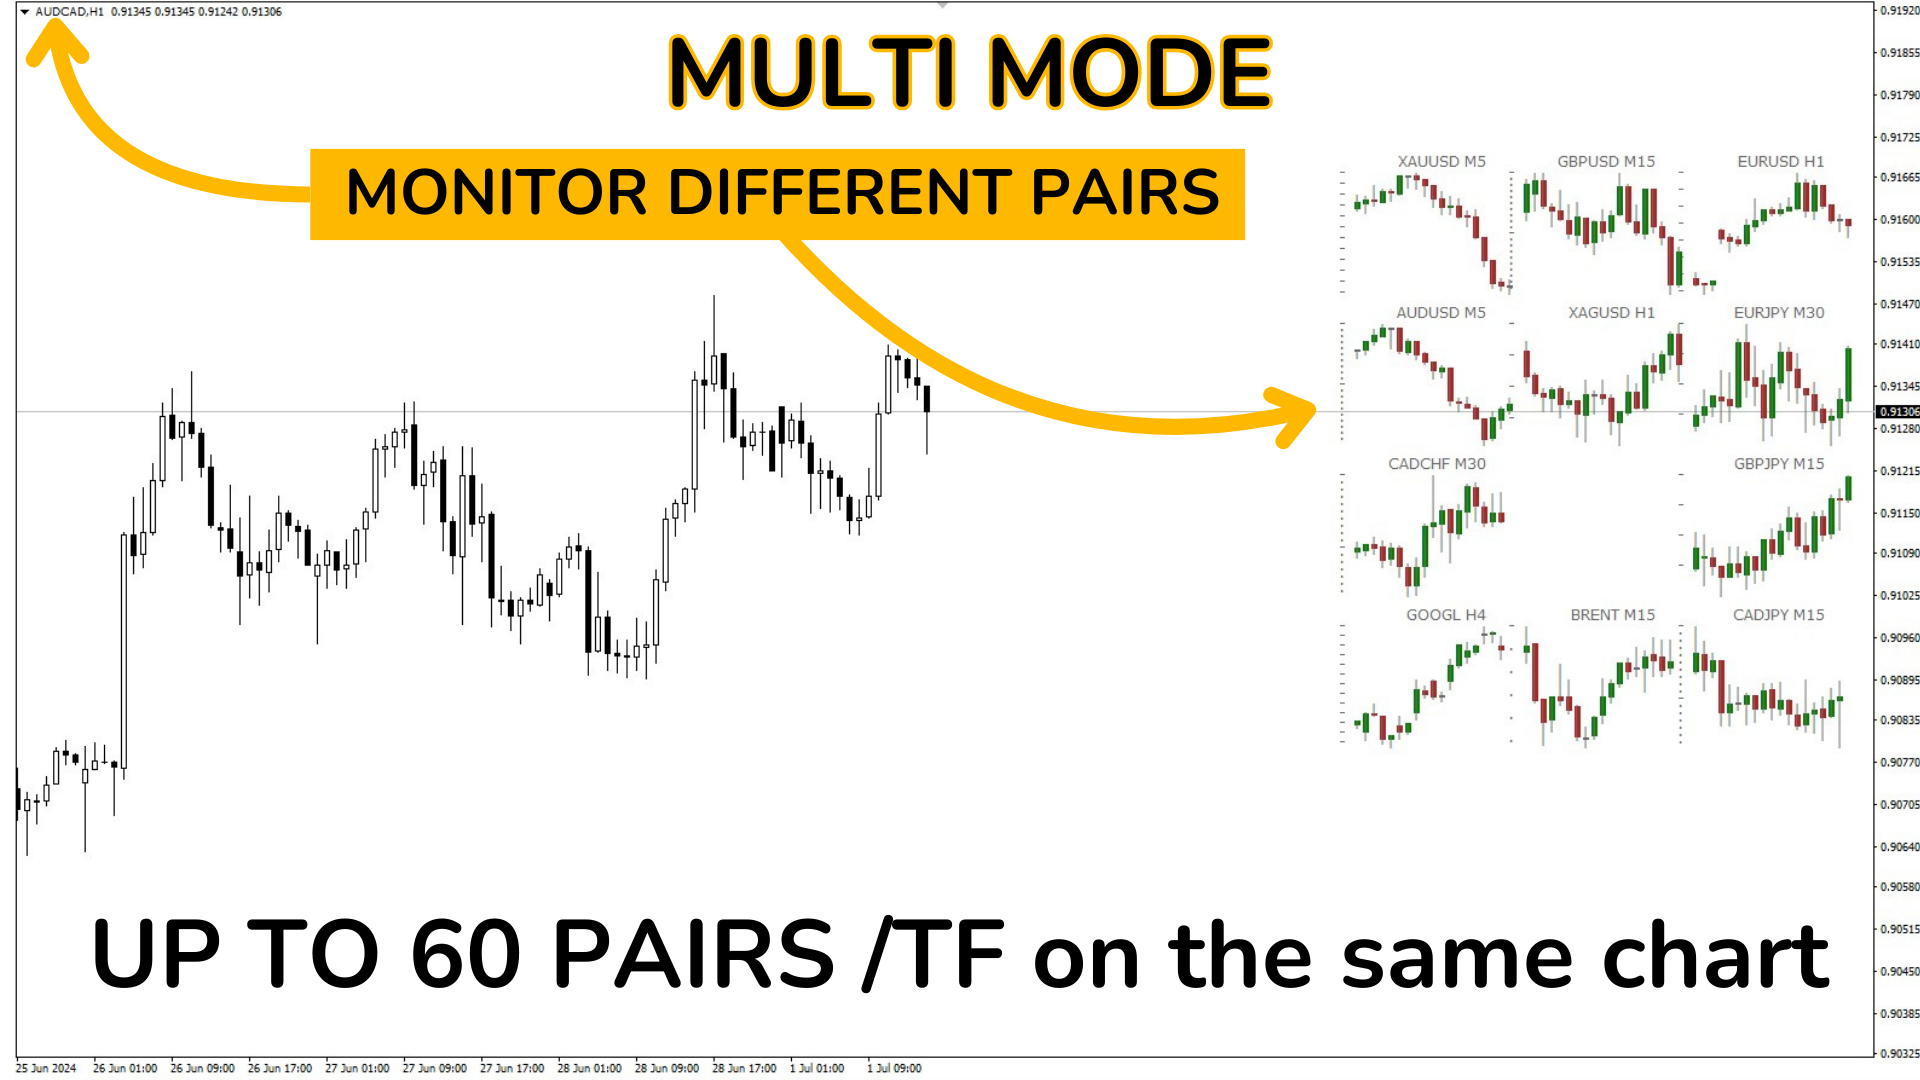
「MultiSymbol & TF Chart Integrated」インジケーターは、迅速に包括的な市場ビューを提供するために設計されており、好みの時間枠で最大60の通貨ペアを単一のチャートで監視すること(複数モード)や、すべての時間枠で取引しているペアを表示すること(シンプルモード)を可能にします。

主な利点:

完全監視: 単一のチャートで希望するすべてのペアを一目でリアルタイムで監視できます。
時間節約: チャート間の切り替えを避け、各ペアの動きをリアルタイムで確認できます。
トレンド分析: トレンドフォローのトレーダーに最適で、意思決定前にトレンドを確認するために上位の時間枠を見ることができます。
極端なカスタマイズ: インジケーターのすべての側面を特定のニーズに合わせて調整します。

極端なカスタマイズ:

高度に設定可能なインジケーターパラメーター:
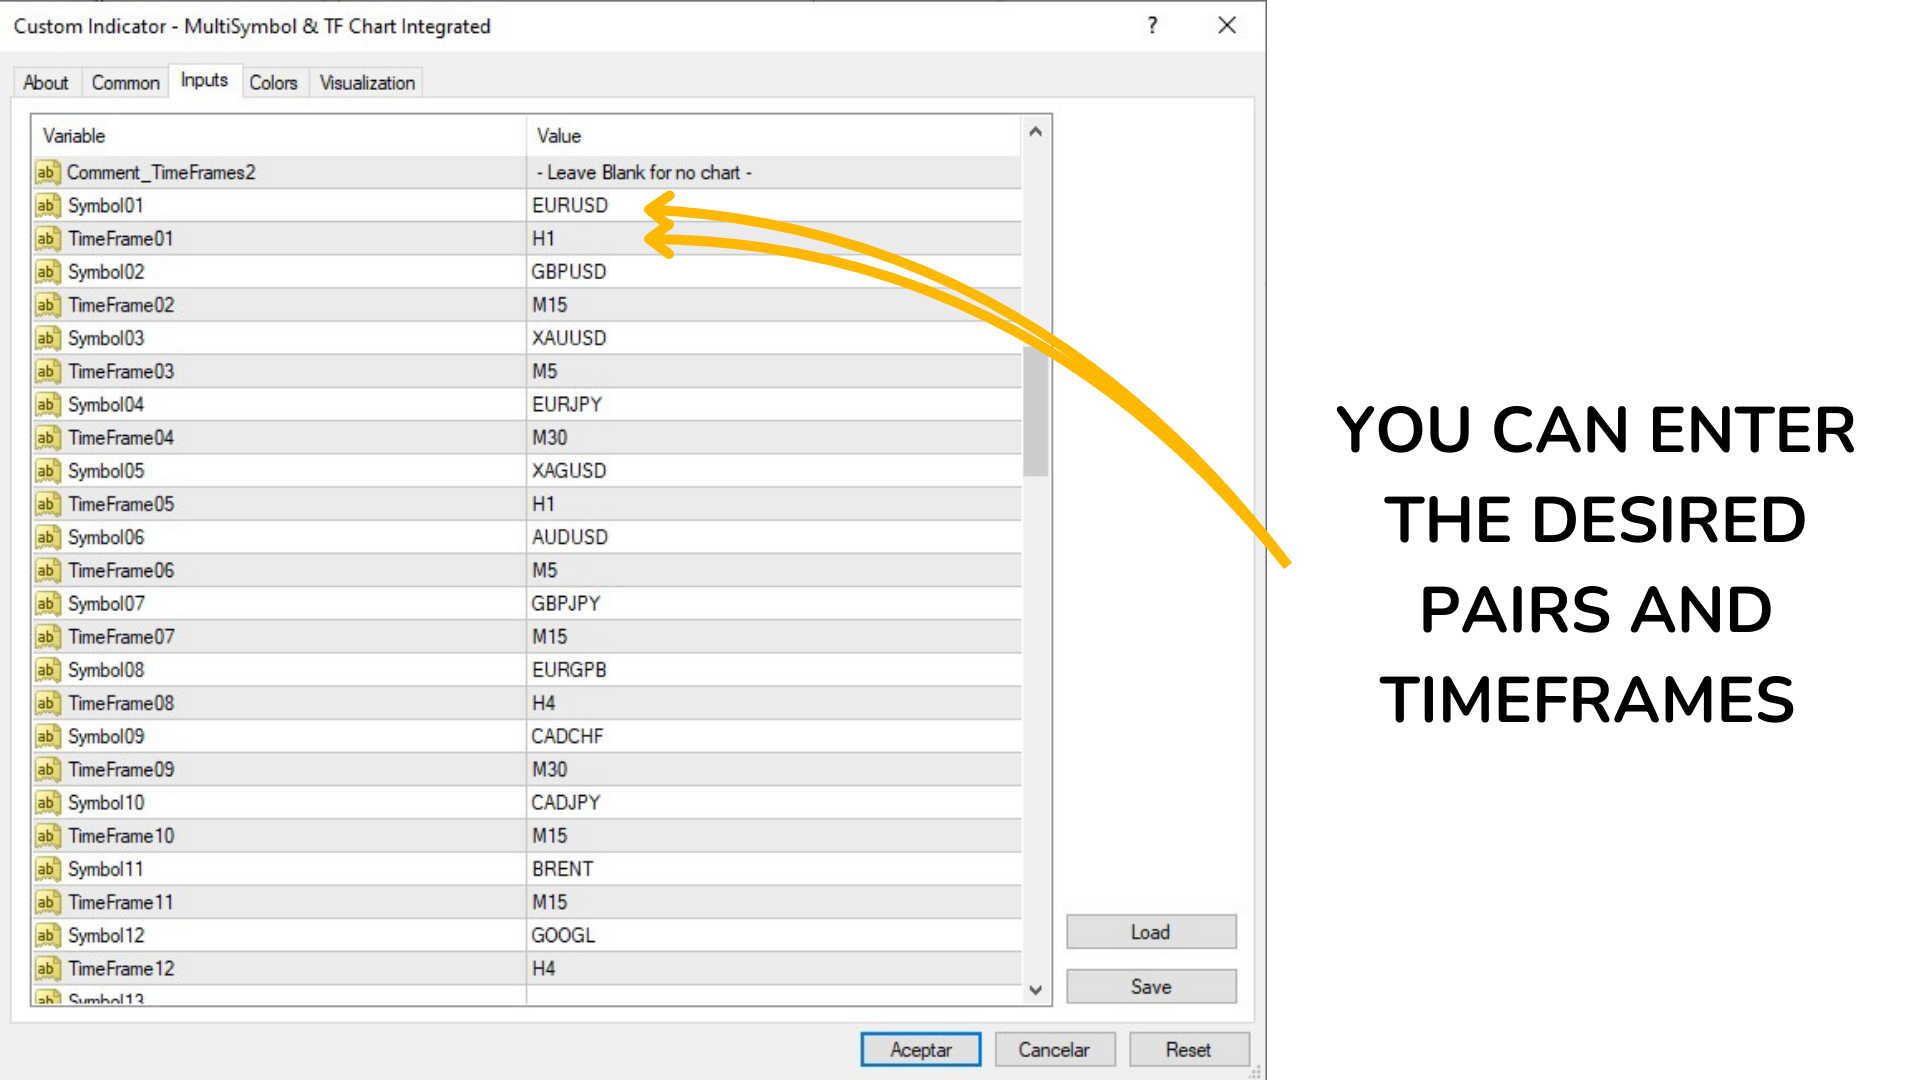
シンボルと時間枠:

  • 最大60の異なるシンボルを設定できます。
  • 各シンボルには独自の時間枠を持つことができます(例:M1、M5、M15、M30、H1、H4、D1、W1、MN1)。

表示モード:

  • シンプルモード: 特定の時間枠で単一のチャートを設定します。
  • 複数モード: 異なるシンボルと時間枠を持つ複数のチャートを設定します。

カラー設定:

  • 強気と弱気のキャンドルのカスタマイズ可能な色。
  • キャンドルの芯の色。
  • 価格スケールの色。

スケーリングとポジショニング:

  • 価格範囲とATRに基づくチャートの自動スケーリング。
  • ピクセルパラメーターを使用したチャートの位置決め。
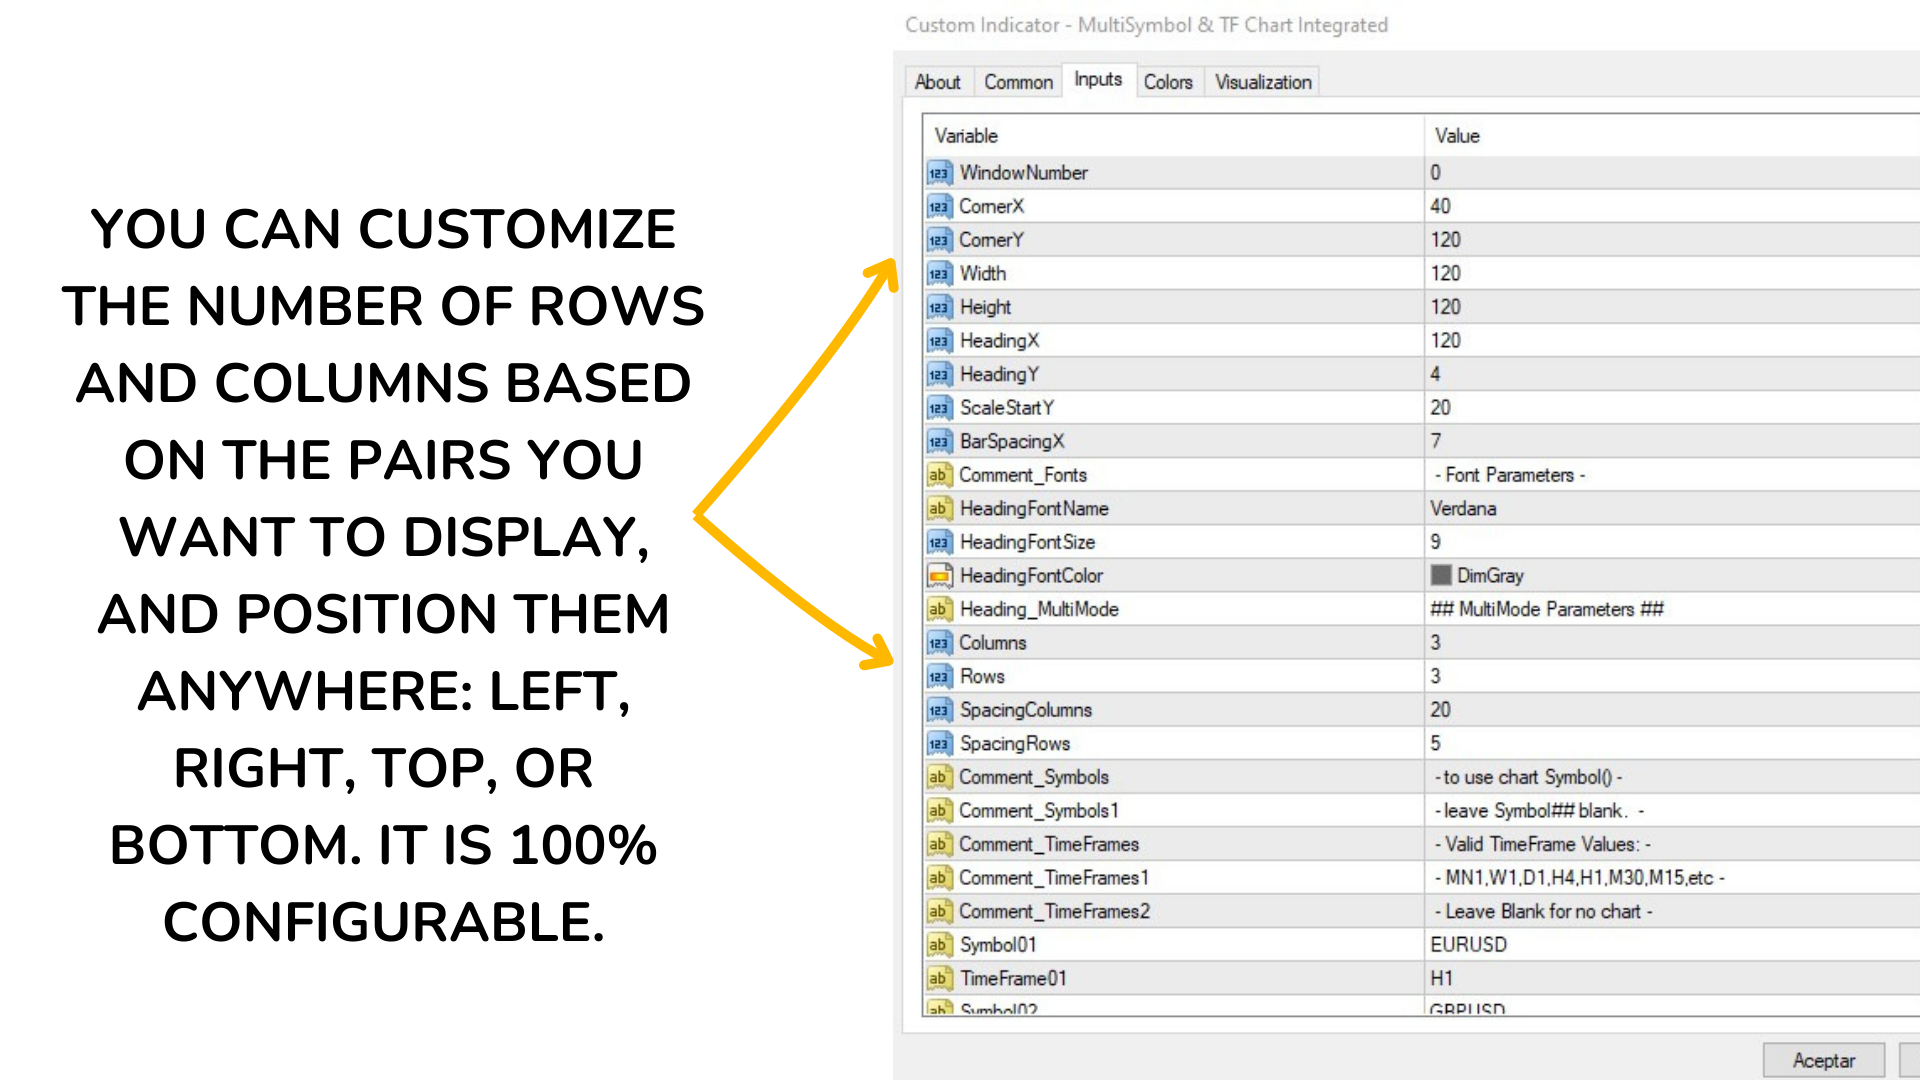
  • チャートレイアウトの行数と列数。
  • 列と行の間のスペーシング。
  • チャートウィンドウ内の初期位置(X、Y)。
  • ピクセル単位のチャートサイズ(幅と高さ)。

フォント設定:

  • 見出しとラベルのフォント名とサイズ。
  • 見出しのフォントカラー。

バー設定:

  • 各チャートに表示されるバーの数。
  • バー間のピクセル距離。

「MultiSymbol & TF Chart Integrated」インジケーターは、すべての希望するペアを迅速に確認し、戦略に最適なペアで取引するために時間を最大限に活用しようとするトレーダーにとって必須のツールです。その高度なカスタマイズと使いやすさにより、すべてのレベルのトレーダーにとって理想的な選択となります。

ガイドを使用して、特定のニーズに合わせてパラメーターを調整してください:

インジケーターの外部パラメーターの詳細説明:
シンプルモード
Heading_SingleMode: ## シンプルモードのパラメーター ##

説明: シンプルモードのパラメーターのタイトル(単一チャート)。

Comment_TimeFrame: - MN1,W1,D1,H4,H1,M30,M15,など -

説明: 有効な時間枠を示すコメント。

TimeFrame: H4

説明: シンプルモードでチャートの時間枠を定義します。MN1(月)、W1(週)、D1(日)、H4(4時間)などの値を使用できます。

Comment_Corner: - TopLeft=0,TR=1,BL=2,BR=3 -

説明: ウィンドウ内のチャート位置の値を説明するコメント。

Corner: 1

説明: チャートが配置されるウィンドウの角を定義します。可能な値:0(左上角)、1(右上角)、2(左下角)、3(右下角)。

複数モード
Heading_ChartParam: ## チャートパラメーター ##

説明: 複数モードのパラメーターのタイトル(複数チャート)。

MultiMode: true

説明: 複数モードを有効(true)または無効(false)にします。

CandleMode: false

説明: キャンドル(true)またはバー(false)を表示するかを定義します。

BarsToDisplay: 18

説明: 各チャートに表示されるバーまたはキャンドルの数。

AutoScale: true

説明: 価格範囲とATR(平均実際範囲)に基づくチャートの自動スケーリングを有効(true)または無効(false)にします。

ATRBars: 20

説明: ATR計算のために考慮されるバーの数。

ATRPixelsY: 30

説明: スケーリングのためにATRに割り当てられた垂直ピクセル数。

カラー設定
WickColor: DimGray

説明: キャンドルの芯の色。

BullBarColor: Green

説明: 強気のキャンドルまたはバーの色。

BearBarColor: FireBrick

説明: 弱気のキャンドルまたはバーの色。

ScaleColor: DimGray

説明: 価格スケールの色。

ポジショニング
Comment_Positioning: - ピクセル単位のポジショニング -

説明: 以下のパラメーターがピクセル単位のポジショニング用であることを示すコメント。

WindowNumber: 0

説明: チャートが表示されるウィンドウ番号。通常、0がメインウィンドウです。

CornerX: 40

説明: ピクセル単位のチャートの初期X位置。

CornerY: 120

説明: ピクセル単位のチャートの初期Y位置。

Width: 120

説明: ピクセル単位のチャートの幅。

Height: 120

説明: ピクセル単位のチャートの高さ。

フォント設定
HeadingFontName: Verdana

説明: 見出しとラベルに使用されるフォント名。

HeadingFontSize: 9

説明: 見出しとラベルのフォントサイズ。

HeadingFontColor: DimGray

説明: 見出しのフォントカラー。

複数モード設定

Heading_MultiMode: ## 複数モードのパラメーター ##

説明: 複数モードの特定のパラメーターのタイトル。

Columns: 3

説明: チャートの列数。

Rows: 3

説明: チャートの行数。

SpacingColumns: 20

説明: チャート列間のピクセル間隔。

SpacingRows: 5

説明: チャート行間のピクセル間隔。

シンボルと時間枠(合計60)
Symbol01: EURUSD

説明: 最初のチャートのシンボル。最大60の異なるシンボルを設定できます。

TimeFrame01: H1

説明: 最初のチャートの時間枠。各シンボルには独自の時間枠があります。

これらのパラメーターはSymbol60とTimeFrame60まで繰り返され、デフォルトでは空のままですが、各トレーダーは自分のニーズに合わせてそれらを設定できます。

「MultiSymbol & TF Chart Integrated」インジケーターは高度に設定可能で、トレーダーが単一のチャート上で複数のシンボルと時間枠を完全にカスタマイズして表示できるようにし、技術分析を容易にし、意思決定の効率を向上させます。


おすすめのプロダクト
Gold Venamax   - これは最高の株式テクニカル指標です。 指標アルゴリズムは資産の価格変動を分析し、ボラティリティと潜在的なエントリーゾーンを反映します。 インジケーターの機能: これは、快適で収益性の高い取引のためのマジックとトレンド矢印の 2 つのブロックを備えたスーパー インジケーターです。 チャート上にブロックを切り替えるための赤いボタンが表示されます。 マジックはインジケーター設定で設定されているため、異なるブロックを表示する 2 つのチャートにインジケーターをインストールできます。 Gold Venamax は、異なる矢印バッファー (GV と SF) を備えた 2 つのチャートに配置できます。 これを行うには、設定で異なる Magic を選択する必要があります。たとえば、あるマジック = 999、別のマジック = 666 を選択します。次に、チャート上の赤いボタンで矢印バッファを選択できます。 入力するのに最適な信号 = 両方のバッファ (GV および SF) の信号矢印 + 3 本すべての MA ライン (赤または青) の方向に従います。
このインディケータは、極値から3周期のセマフォと反転パターン123を構築する。シグナルは、2本目のローソク足の始点で発信されます。 このパターンは、さまざまな方法(テストポイント3、ブレイクアウト、その他)で取引することができます。チャネルの出口、またはトレンドラインのブレイクアウトは、エントリーポイントを見つけるための主なトリガーです。 アイコンはフィボナッチレベルに応じて色分けされています。黄色のアイコンは、シグナルが増幅されるレベルのテストを示します。 多通貨ダッシュボードを使用すると、123パターンがどの通貨ペアで発見され、何本のバーがそれに続いたかを追跡することができます。 フラクタル・ジグザグがベース。再描画可能。したがって、リンク先のブログでストラテジーを研究してください -   123 Fractal Trading With UPD1   。 入力パラメータ。 Bars Count – 表示する履歴。 Tooltip - オブジェクトの上にカーソルを置いたときにツールチップを表示するかどうか。 Show Semaphore - セマフォを有効、無効にします。
Very Accurate Market Trend Indicator! Advantages easy, nice visual and effective trend detection given Always opportunities works on all pairs Forex, Crypto, Commodities, Stocks, Indicies works on all timeframes, but higher TF 1-4Hr is more effective !!!! WARNING !!!! This is trend indicator, it searching for trends in the market! You need patience and you may see loosing trades in a row but that is normal! Do not panick! Once you detect the trends and its confirmed there will be plenty of pi
The Netsrac Correlation Trade Indicator (NCTI) was created to trade correlations between different assets. NCTI offers five different strategies to do this. Five different correlation trading strategies with two or three assets Fast access your assets with one click via asset buttons Your profit/loss at a glance Configurable alerts via screen or mobile You can use the indicator with every timeframe. Higher timeframes give fewer but better signals. If you have some questions or suggestions - ple
RSI Currency Strength Meter uses RSI (Relative Strength Index) to monitor how strong a currency is, or in other words, if it's being bought or sold by the majority compared to the other currencies. It displays the strength-lines of the currencies of the pair (base and counter currency of the chart) with changeable solid lines. Also, you can add up to five additional currencies to the "comparison pool". If you want to look and compare, for example, EUR, USD and JPY, it will only look at the EURUS
現在20%OFF! 初心者やエキスパートトレーダーのためのベストソリューション! このダッシュボードソフトウェアは、28の通貨ペアで動作しています。それは私達の主要な指標(高度な通貨の強さ28と高度な通貨インパルス)の2に基づいています。それは全体の外国為替市場の大きい概観を与えます。それは、すべての(9)時間枠で28の外国為替ペアのための高度な通貨の強さの値、通貨の動きの速度と信号を示しています。チャート上で1つのインディケータを使用して市場全体を観察し、トレンドやスキャルピングの機会をピンポイントで見つけることができたら、あなたのトレードがどのように改善されるか想像してみてください。 このインディケータには、強い通貨と弱い通貨の識別、潜在的な取引の識別と確認がより簡単になるような機能が搭載されています。このインディケータは、通貨の強さや弱さが増加しているか減少しているか、また、すべての時間枠でどのように機能しているかをグラフィカルに表示します。 新機能として、現在の市場環境の変化に適応するダイナミックなマーケットフィボナッチレベルが追加され、すでに当社のAdvan
This indicator scans and displays currency pairs that have recently aligned moving averages on a given timeframe. You can configure which pairs the indicator will scan. It also includes all types of alert options. Bullish MA Alignment =  MA1>MA2>MA3>MA4>MA5 Bearish MA Alignment =  MA1<MA2<MA3<MA4<MA5 Features Attach to one chart and scans all the currency pairs configured and visible in the Market Watch Window It can monitor all the available timeframes from M1 to MN1 and sends alerts on ever
Market Meeter
Hapu Arachchilage Tharindu Lakmal
Market Meter is designed for explore various trends in current trading symbol.  with Market Meter  you can get a clear idea about the trends running on different time frames of current symbol. This indicator uses separate window to display its data. Every time when a new trend occurred, Indicator shows it with displaying an arrow on related text area. It's very important to identify the trends of higher time frames when you trading lower time frames. Let the Market Meter  to do the work for you.
BinaryPRO- is a multi-currency and multi-timeframe signal indicator, created according to the author's algorithm. It produces high-quality and timely trading signals in the form of arrows on any financial assets traded on Meta Trader 4. It is a good alternative to paid signal services. The indicator can be used with any broker (with 4/5-digit quotes). The received trading signals can and should be used when trading binary options and cryptocurrency. Advantages of BinaryPRO: accurately shows th
Forex Gump
Andrey Kozak
2.83 (6)
Forex Gump is a fully finished semi-automatic trading system. In the form of arrows, signals are displayed on the screen for opening and closing deals. All you need is to follow the instructions of the indicator. When the indicator shows a blue arrow, you need to open a buy order. When the indicator shows a red arrow, you need to open a sell order. Close orders when the indicator draws a yellow cross. In order to get the most effective result, we recommend using the timeframes H1, H4, D1. There
Multiple Indicators for Major Currencies The purpose of this indicator is to save time to detect more good trading opportunities by scanning all 28 cross currency pairs of AUD, CAD, CHF, EUR, GBP, JPY, NZD and USD in the same time. There are 5 indicators included in this indicator which are CCI, RSI, Stochastic, MACD and the different between plusDI and minusDI of ADX (PlusDI-MinusDI). The indicator can help in determining the following properties of each currency depending on which indicator
トレンドトレーディング は、タイミングのプルバックとブレイクアウトにより、市場で起こっているトレンドから可能な限り利益を得るように設計された指標です。確立されたトレンドの中で価格が何をしているかを分析することにより、取引の機会を見つけます。 [ インストールガイド | 更新ガイド | トラブルシューティング | よくある質問 | すべての製品 ] 自信を持って効率的に金融市場を取引する むち打ちにならずに確立されたトレンドから利益を得る 収益性の高いプルバック、ブレイクアウト、早期の逆転を認識する この指標は、独自の品質とパフォーマンスを分析します 複数時間枠のダッシュボードを実装します インジケーターは再描画されていません 電子メール/音声/視覚アラートを実装します 確立されたトレンドは多くの取引機会を提供しますが、ほとんどのトレンド指標はそれらを完全に無視しています。インジケーターの解釈はかなり簡単です: (1) トレンドの変化 (2) トレンドの方向への後退 (3) トレンドの方向へのブレイクアウト 赤いダッシュ は下降トレンド中の修正です 青いダッシュ は上昇ト
インジケータMTFクリスタリウム矢印は、半自動取引システムであります. これは、すべての通貨ペアで動作します。  インジケータは、三つのルールを使用しています:1)我々は唯一のトレンドで取引、2)"誰もが販売しているときに購入し、誰もが買うときに販売する"、3)価格  インジケータMTF矢印は、内蔵の指標を使用して、複数の時間枠全体のクリスタリウムフィルタルール。 トレンドは、選択した時間間隔で一致した場合、インジケータは、市場に参入するための矢印を与えます。 それからあなた自身の決定をする。 購入する-緑の矢印、売る-赤い矢印。 指標では、ロットを変更したり、EAの取引時間とシャットダウン時間を設定することができます。 また、作業期間と時間フィルタを変更することができます。 ビープ音が鳴ってる  推薦された働く期間D1。 フィルタH1とH4。  設定: TF働く期間(推薦されたD1) Cci_cperiodcomment CCIレベルアップ CCIレベルDn CCI価格 SARステップ SAR最大値 TFのFilter1–(推薦されたH1
Was: $249  Now: $99   Market Profile defines a number of day types that can help the trader to determine market behaviour. A key feature is the Value Area, representing the range of price action where 70% of trading took place. Understanding the Value Area can give traders valuable insight into market direction and establish the higher odds trade. It is an excellent addition to any system you may be using. Blahtech Limited presents their Market Profile indicator for the MetaTrader community. Ins
Think of the rarest pair you can think of. And I assure you that this indicator can compute it's strength. This Currency Meter will literally calculate any currency pairs, either it is the Major Pairs, Metals, CFD's, Commodities, Crypto Currency like Bitcoin/BTC or Ethereum/ETH and even stocks. Just name it and you will get it! There is no currency pair this Currency Meter can solve. No matter how rare or exotic is that currency, it will always be solved by this Currency meter which on a real-ti
Currency Power Meter shows the power of major currencies against each other. The indicator shows the relative strength of currency/pair at the current moment in a period of time (H4, daily, weekly, monthly). It is useful for day traders, swing traders and position traders with suitable period options. Currency power is the true reason of market trend: The strongest currency against the weakest currency will combine into a most trending pair. As we know, trend makes money and all traders love tre
Gann Square of 144
Taras Slobodyanik
4.33 (6)
The Gann Box (or Gann Square) is a market analysis method based on the "Mathematical formula for market predictions" article by W.D. Gann. This indicator can plot three models of Squares: 90, 52(104), 144. There are six variants of grids and two variants of arcs. You can plot multiple squares on one chart simultaneously. Parameters Square — selection of a square model: 90 — square of 90 (or square of nine); 52 (104) — square of 52 (or 104); 144 — universal square of 144; 144 (full) — "full"
Cloud Eyes is an advanced moving average alert that   will easily monitor the price action based on set moving averages to multiple open charts.  Objective: To monitor multiple open charts and notify traders conveniently in a single display panel when using the moving averages to enter/exit a trades. Features: Monitor price action in two timeframes at the same time Supports simple, exponential, smoothed, linear weighted moving averages Trigger an alert based on candle size (full/body length) Ca
CCI Currency Strength Meter uses CCI (Commodity Channel Index) to monitor how strong a currency is, or in other words, if it's being bought or sold by the majority compared to the other currencies. If you load this indicator on a chart, it will first display the strength-lines of the currencies (base and counter currency of the chart) with changeable solid lines. Also, you can add up to five additional currencies to the "comparison pool," that already has the base and the profit (counter) curren
Marketfx Profile
Mahmoud Helmy Sedik Mohamed Mansour
A   Market Profile   is an intra-day charting technique (price vertical, time/activity horizontal) devised by J. Peter Steidlmayer, a trader at the   Chicago Board of Trade   (CBOT), ca 1959-1985. Steidlmayer was seeking a way to determine and to evaluate   market value   as it developed in the day time frame. The concept was to display price on a vertical axis against time on the horizontal, and the ensuing graphic generally is a bell shape--fatter at the middle prices, with activity trailing o
インディケータは現在のクオートを作成し、これを過去のものと比較して、これに基づいて価格変動予測を行います。インジケータには、目的の日付にすばやく移動するためのテキスト フィールドがあります。 オプション: シンボル - インジケーターが表示するシンボルの選択; SymbolPeriod - 指標がデータを取る期間の選択; IndicatorColor - インジケータの色; HorisontalShift - 指定されたバー数だけインディケータによって描画されたクオートのシフト; Inverse - true は引用符を逆にします。false - 元のビュー。 ChartVerticalShiftStep - チャートを垂直方向にシフトします (キーボードの上下矢印)。 次は日付を入力できるテキストフィールドの設定で、「Enter」を押すとすぐにジャンプできます。
Daily Average - Retracement Dashboard   is an indicator that allows you to monitor more than one currency pairs at one time. This indicator is mainly for strategy that trade price retracement based on Resistance3/4 or Support 3/4. After apply this indicator to the chart window, it will hide the chart and display the currency pairs in a table form. There are several data shown on the table that will help trader know when to analyze the currency and do trade using retracement. The indicator will s
This multicurrency indicator is the Lite version of the Cosmic Diviner Reversal Zone Pro indicator. The indicator is based on original formulas for analyzing the volatility and price movement strength. This allows determining the overbought and oversold states of instruments with great flexibility, as well as setting custom levels for opening buy or sell orders when the overbought or oversold values of the instruments reach a user-defined percentage. A huge advantage of Reversal Zone Lite is the
Currency Strength Meter is the easiest way to identify strong and weak currencies. This indicator shows the relative strength of 8 major currencies + Gold: AUD, CAD, CHF, EUR, GBP, JPY, NZD, USD, XAU. Gold symbol can be changed to other symbols like XAG, XAU etc. By default the strength value is normalised to the range from 0 to 100 for RSI algorithm: The value above 60 means strong currency; The value below 40 means weak currency; This indicator needs the data of all 28 major currency pair
"The trend is your friend" is one of the best known sayings in investing, because capturing large trendy price movements can be extremely profitable. However, trading with the trend is often easier said than done, because many indicators are based on price reversals not trends. These aren't very effective at identifying trendy periods, or predicting whether trends will continue. We developed the Trendiness Index to help address this problem by indicating the strength and direction of price trend
The Signal Strength Meter is a Multi-Currency, Dual Timeframe Interactive Indicator, which calculates the strength of buy and sell signals, and displays a score for each symbol on a display board. Get a 7-Day Free Trial Version:  Click  Here  (Full Access to The Indicator for 7 Days) Check Video Below For Complete Demonstration, and User Manual here . Key Features: Allows you to see multiple currency signals from one chart Analyses the signals from more than a dozen classic indicators Identi
Fisher Yur4ik Indicator - Unlock Precise Trading Insights Explore a world of precision in trading with the "Fisher Yur4ik Indicator." This advanced tool is designed to provide traders with accurate insights into price trends, allowing for well-informed decisions and enhanced profitability. Basic Details : Indicator Type : Fisher Yur4ik Indicator Key Metrics : Real-time analysis of price trends and potential turning points. Customization : Fully customizable settings to align with your unique tra
The indicator displays the data of the Stochastic oscillator from a higher timeframe on the chart. The main and signal lines are displayed in a separate window. The stepped response is not smoothed. The indicator is useful for practicing "manual" forex trading strategies, which use the data from several screens with different timeframes of a single symbol. The indicator uses the settings that are identical to the standard ones, and a drop-down list for selecting the timeframe. Indicator Parame
About testing Mode: 1.To get the best usage experience please use the tick data to test and adjust the test speed to proper speed (tick price jump quickly but K bars scroll slowly)!!! 2.Click "Indicator Properties"-> Click "Reset" before testing the indicator to restore the default parameters of the indicator. 1. Compound Drawings (1) Line segment with arrow (2) Continuous line segment (broken line) (3) Parallelogram (4) Polygon (5) Profit and loss ratio measurement tools 2.     Backtracking
このプロダクトを購入した人は以下も購入しています
Reversal First Impulse levels (RFI)    INSTRUCTIONS        RUS       -       ENG              R ecommended to use with an indicator   -   TREND PRO -  Version MT5 A key element in trading is zones or levels from which decisions to buy or sell a trading instrument are made. Despite attempts by major players to conceal their presence in the market, they inevitably leave traces. Our task was to learn how to identify these traces and interpret them correctly. Main functions: Displaying active zones
まず第一に、この取引インジケーターは再描画されず、再描画されず、遅延しないことを強調する価値があります。これにより、手動取引とロボット取引の両方に理想的なものになります。 ユーザーマニュアル:設定、入力、戦略。 アトミックアナリストは、価格の強さとモメンタムを利用して市場でより良いエッジを見つけるためのPA価格アクションインジケーターです。ノイズや誤ったシグナルを除去し、取引ポテンシャルを高めるための高度なフィルターを備えています。複雑なインジケーターの複数のレイヤーを使用して、アトミックアナリストはチャートをスキャンし、複雑な数学的計算をシンプルなシグナルと色に変換します。これにより、どのような初心者トレーダーでも理解して使用し、一貫した取引の決定を行うことができます。 「アトミックアナリスト」は、新規および経験豊富なトレーダー向けにカスタマイズされた包括的な取引ソリューションです。プレミアムインジケーターとトップノッチの機能を1つの取引戦略に組み合わせ、すべてのタイプのトレーダーにとって汎用性のある選択肢にします。 デイリートレーディングとスキャルピング戦略:高
Enigmera
Ivan Stefanov
5 (3)
エニグメラ:市場の中核 https://www.enigmera.com はじめに このインディケータと取引システムは、金融市場に対する驚くべきアプローチです。ENIGMERAは、フラクタルサイクルを使用して、サポートとレジスタンスレベルを正確に計算します。本格的な蓄積局面を示し、方向性と目標を示します。 トレンド中でも調整中でも機能するシステムです。 どのように作動するのか? ENIGMERAは、支持線・抵抗線、目標線、乖離線の3つのラインで構成されています。このシステムは、過去のデータを現在と未来に外挿する典型的な市場指標とは異なり、現在の完全な画像を提供します。支持線上にある場合、それは本当の支持を意味し、抵抗線上にある場合、それは本当の抵抗を意味する。ある水準が破られた場合、それはトレンドの変化を意味する。再描画はしない。 市場は常に進化しているため、ENIGMERAはその評価ツールを適応させ、定期的に戦略を修正しています。  これにより、すべてのシナリオが徹底的に評価されることが保証されます。この市場指標の独自性は、その能力を見れば明らかです。  ENIGM
Please send me Direct message on MQL5 CHAT after purchasing the Indicator for Training and Installation Support There are some additional files that is important to use with the Indicator . So be sure to contact me after purchasing the Indicator So that I can add you for training and support . If you find any difficulty with installation then send me Direct message here So that I can connect with you via Anydesk or Teamview for the product installation. " Smart Order Block Indicator " to find
ECM Elite Channel is a volatility-based indicator, developed with a specific time algorithm, which consists of finding possible corrections in the market. This indicator shows two outer lines, an inner line (retracement line) and an arrow sign, where the channel theory is to help identify overbought and oversold conditions in the market. The market price will generally fall between the boundaries of the channel. If prices touch or move outside the channel, it's a trading opportunity. The
Indicator : RealValueIndicator Description : RealValueIndicator is a powerful tool designed specifically for trading on the EURUSD pair. This indicator analyzes all EUR and USD pairs, calculates their real currency strength values, and displays them as a single realistic value to give you a head start on price. This indicator will tell you moves before they happen if you use it right. RealValueIndicator allows you to get a quick and accurate overview of the EURUSD currency pair tops and bottoms,
Gold Channel is a volatility-based indicator, developed with a specific timing algorithm for the XAUUSD pair, which consists of finding possible corrections in the market. This indicator shows two outer lines, an inner line (retracement line) and an arrow sign, where the theory of the channel is to help identify overbought and oversold conditions in the market. The market price will generally fall between the boundaries of the channel. If prices touch or move outside the channel it is a tra
Introduction to X3 Chart Pattern Scanner X3 Cherart Pattern Scanner is the non-repainting and non-lagging indicator detecting X3 chart patterns including Harmonic pattern, Elliott Wave pattern, X3 patterns, and Japanese Candlestick patterns. Historical patterns match with signal patterns. Hence, you can readily develop the solid trading strategy in your chart. More importantly, this superb pattern scanner can detect the optimal pattern of its kind. In addition, you can switch on and off individu
TrendMaestro
Stefano Frisetti
5 (3)
note: this indicator is for METATRADER4, if you want the version for METATRADER5 this is the link:  https://www.mql5.com/it/market/product/108106 TRENDMAESTRO ver 2.4 TRENDMAESTRO recognizes a new TREND in the bud, he never makes mistakes. The certainty of identifying a new TREND is priceless. DESCRIPTION TRENDMAESTRO identifies a new TREND in the bud, this indicator examines the volatility, volumes and momentum to identify the moment in which there is an explosion of one or more of these data a
SNR LEVEL INDICATOR Accurate Snr level indicator will only display Fresh Levels that are close to the Current Market Price. This indicator is very accurate in mapping Support & resistance levels. there is an alert feature when the price TOUCHES the SNR LEVEL, WHEN CLOSE CANDLE BREAK/REJECT SNR LEVEL. INDICATOR MARKING :: - SUPPORT LEVEL == V SHAPE - RESISTANCE LEVEL == APEX LEVEL - GAP RESISTANCE & GAP SUPPORT == OPEN CLOSE CANDLE - SUPPORT BECAME RESISTANCE & RESISTANCE BECAME SUPPORT INDIC
もちろんです。以下は、提供いただいたテキストの日本語への翻訳です: MT4用の天文学指標をご紹介します:究極の天体トレーディングコンパニオン トレーディング体験を天空の高みに高める準備はできていますか?私たちの革命的なMT4用の天文学指標をご紹介します。この革新的なツールは、複雑なアルゴリズムの力を借りて、類まれなる天文学的洞察と精密な計算を提供します。 あなたの指先で宇宙の情報を: 宝のような天文学的データが明らかになる包括的なパネルをご覧ください。惑星の地理的/太陽中心座標、太陽と地球の距離、星の大きさ、伸び、星座、黄道座標および赤道座標、さらには水平座標まで、それぞれが綿密に計算され美しく表示されています。指標によって生成される垂直線は時間値に対応し、トレーディングの旅に宇宙の視点を提供します。 惑星のラインと関係: グラフを飾る惑星のラインの魔法を体験し、スケールと角度をカスタマイズできます。直感的なコントロールパネルを介して各惑星のラインの表示を簡単に切り替えることができます。指定された時刻範囲内での合会、六分会、四分会、三分会、対会、逆行の指標で天体の関係の芸術を発見してく
収益性の高い取引機会を簡単に特定するのに役立つ強力な外国為替取引インジケーターをお探しですか?ビースト スーパー シグナル以外に探す必要はありません。 この使いやすいトレンドベースのインジケーターは、市場の状況を継続的に監視し、新しいトレンドを検索したり、既存のトレンドに飛びついたりします。ビースト スーパー シグナルは、すべての内部戦略が一致し、互いに 100% 合流したときに売買シグナルを発するため、追加の確認は不要です。シグナル矢印アラートを受け取ったら、単に売買します。 購入後、プライベート VIP グループに追加されるようにメッセージを送ってください! (完全な製品購入のみ)。 購入後、最新の最適化されたセット ファイルについてメッセージを送ってください。 MT5バージョンは こちらから入手できます。 Beast Super Signal EA は こちらから 入手できます。 コメント セクションをチェックして、最新の結果を確認してください。 ビースト スーパー シグナルは、1:1、1:2、または 1:3 のリスクと報酬の比率に基づいて、エントリ
Volatility Trend System - a trading system that gives signals for entries. The volatility system gives linear and point signals in the direction of the trend, as well as signals to exit it, without redrawing and delays. The trend indicator monitors the direction of the medium-term trend, shows the direction and its change. The signal indicator is based on changes in volatility and shows market entries. The indicator is equipped with several types of alerts. Can be applied to various trading
NAM Order Blocks
NAM TECH GROUP, CORP.
5 (1)
MT4マルチタイムフレームオーダーブロック検出インジケーター。 特徴 -チャートコントロールパネルで完全にカスタマイズ可能で、完全な相互作用を提供します。 -必要な場所でコントロールパネルを表示および非表示にします。 -複数の時間枠でOBを検出します。 -表示するOBの数量を選択します。 -さまざまなOBユーザーインターフェイス。 -OBのさまざまなフィルター。 -OB近接アラート。 -ADRの高線と低線。 -通知サービス(画面アラート|プッシュ通知)。 概要 注文ブロックは、金融機関や銀行からの注文収集を示す市場行動です。著名な金融機関と中央銀行が外国為替市場を牽引しています。したがって、トレーダーは市場で何をしているのかを知る必要があります。市場が注文ブロックを構築するとき、それは投資決定のほとんどが行われる範囲のように動きます。 注文の構築が完了すると、市場は上向きと下向きの両方に向かって急激に動きます。注文ブロック取引戦略の重要な用語は、機関投資家が行っていることを含むことです。それらは主要な価格ドライバーであるため、機関投
How to use Pair Trading Station Pair Trading Station is recommended for H1 time frame and you can use it for any currency pairs. To generate buy and sell signal, follow few steps below to apply Pair Trading Station to your MetaTrader terminal. When you load Pair Trading Station on your chart, Pair Trading station will assess available historical data in your MetaTrader platforms for each currency pair. On your chart, the amount of historical data available will be displayed for each currency pai
The indicator " ZigZag on Trend " is an assistant in determining the direction of price movement, as well as a calculator of bars and points. It consists of a trend indicator, which follows the price direction by the trend line presented in the form of a zigzag and a counter calculating the number of bars traversed in the direction of the trend and the number of points on the vertical scale. (calculations are carried out by the opening of the bar) The indicator does not redraw. For convenience,
Currently Price 20% OFF ( for unlimited use )   BONUS  AUX VIP Club 2024 : Include  EA Airbag  and  Load Data History  to enhance the performance of this tool to its maximum potential  Click Here to Download Files   ( for users only )   Hello World! Introducing.. SMCpro VIP tool and Indicator for MetaTrader 4, designed to revolutionize your trading experience with the ICT Smart Money Concept. This system is meticulously crafted to empower traders with advanced insights and precision in
Step into the realm of Forex trading with confidence and precision using XQ, a cutting-edge Forex indicator designed to elevate your trading game to unprecedented heights. Whether you're a seasoned trader or just stepping into the world of currency exchange,   XQ Forex Indicator   empowers you with the insights and signals needed to make informed trading decisions. The signal conditions are a combination of three indicators, and XQ Forex Indicator only display  medium and long-term trends . The
Cycle Sniper
Elmira Memish
4.39 (36)
NEW YEAR SALE PRICE FOR LIMITED TIME!!! Please contact us after your purchase and we will send you the complimentary indicators to complete the system Cycle Sniper is not a holy grail but when you use it in a system which is explained in the videos, you will feel the difference. If you are not willing to focus on the charts designed with Cycle Sniper and other free tools we provide, we recommend not buying this indicator. We recommend watching the videos about the indiactor and system before pu
Full Forex Market View Dashboard
Opengates Success International
5 (2)
FULL FOREX MARKET VIEWダッシュボードインジケーター これは、トレーダーが市場で何が起こっているかを完全に把握できるようにするために作成されたカスタム指標です。 リアルタイム データを使用して市場にアクセスし、取引を成功させるために必要なあらゆる情報を表示します。 インストール: このインジケーターをウィンドウ チャートに添付する前に、MT4 のマーケット ウォッチ パネルに移動し、不要な通貨ペアまたは取引しないすべての通貨ペアを非表示にして、残りをそこに残します。 その理由は、FFMV ダッシュボードが MT4 の気配値表示に表示されるすべての通貨ペアを表示するためです。 最大 30 通貨ペア以下を表示できます。 MT4 の気配値表示でそれ以上だと、FFMV ダッシュボードのフォントと画像がぼやけて変形します。 正しく表示されません。 使用法:      個人取引の場合      バスケット取引の場合 (方法についてはスクリーンショットを参照してください)      複数注文取引にも使用可能      独自の取引システムなどから
Cyclical indicator for trading and predicting the direction of the market. Shows the cyclical behavior of the price in the form of an oscillator. Gives signals for opening deals when rebounding from the upper and lower boundaries of the oscillator. In the form of a histogram, it shows the smoothed strength of the trend. Will complement any trading strategy, from scalping to intraday. The indicator does not redraw. Suitable for use on all symbols/instruments. Suitable time frames for short-term
回帰取引を意味する専門的かつ定量的なアプローチを実装する独自の指標。これは、価格が予測可能かつ測定可能な方法で迂回して平均に戻るという事実を利用しており、非定量的な取引戦略を大幅に上回る明確な出入りルールを可能にします。 [ Installation Guide | Update Guide | Troubleshooting | FAQ | All Products ] 明確な取引シグナル 驚くほど簡単に取引できます カスタマイズ可能な色とサイズ パフォーマンス統計を実装します ほとんどの取引戦略を上回ります 適切なSLおよびTPレベルを表示します 電子メール/音声/視覚アラートを実装します 使い方 インディケータは、より高い時間枠からの完全にカスタマイズ可能な移動平均の周りの標準偏差を測定し、トレンドフォローアプローチを使用して正確に取引を見つけます。取引は、現在のチャートの価格アクションに飛び込むことによって見つけられ、価格が選択したより高い時間枠から計算された平均価格帯に戻ったときに閉じられます。それがコード化される方法のために、指標は高ボラティリティと強いトレンドの
The Volume by Price Indicator for MetaTrader 4 features Volume Profile and Market Profile TPO (Time Price Opportunity). Volume and TPO histogram bar and line charts. Volume Footprint charts. TPO letter and block marker collapsed and split structure charts. Session filtering and grouping. Static, dynamic and flexible range segmentation and compositing methods with relative and absolute visualizations. Graphical layering, positioning and styling options to suit the user's analytic and aesthetic n
Indicatorul MOTANO Bună ziua! 24 de ore - REDUCERE PREȚ! Profita! Tocmai am terminat indicatorul MOTANO după multă muncă. Este un indicator de săgeată. Merge perfect pe M15, aproape orice pereche. Săgețile indică intrările de cumpărare și vânzare, iar o țintă de profit de 5,10 sâmburi asigură un profit sigur. Un profit și mai mare poate fi stabilit, în funcție de situație. Dar cuvintele sunt de prisos. Testați-l și trageți propriile concluzii. Notă Este posibil ca acești ind
驚異的なFXインジケーター「Miraculous」をご紹介します。完璧な結果を得るための1時間足を含むすべてのタイムフレームで効果的に機能する、最強の強力な特殊MT4フォレックスインジケーターです。 すべてのタイムフレームで優れた結果を提供する最高のFXインジケーターを探し続けるのに疲れましたか?これ以上探す必要はありません!「Miraculous」フォレックスインジケーターをご紹介します。このインジケーターは、トレーディングの経験を変革し、収益を新たなレベルに引き上げるために設計されました。 先進のテクノロジーと長年にわたる緻密な開発に基づいて構築された「Miraculous」フォレックスインジケーターは、FX市場における力と正確さの頂点となります。この素晴らしいツールは、すべてのレベルのトレーダーのニーズを満たすように設計されており、一貫した収益性を追求する上で比類のない優位性を提供します。 「Miraculous」フォレックスインジケーターの他との違いは、その非常に適応性にあります。デイトレーダー、スウィングトレーダーであろうと、長期ポジションを好む方であろうと、このインジケータ
[ MT5 Version ] Only the next 10 units at current price! Final price: $299 Are you tired of spending months on demo or live accounts to test your trading strategies? The Backtesting Simulator is the ultimate tool designed to elevate your backtesting experience to new heights. Utilizing Metatrader historical symbol information, it offers an unparalleled simulation of real market conditions. Take control of your testing speed, test ideas quickly or at a slower pace, and witness remarkable improvem
3 Indicators in 1 indicator Strategy based on price action Made specifically for the best forex currency pairs Can be used in the best time frame of the market at a very reasonable price This indicator is basically 3 different indicatos . But we have combined these 3 indicators in 1 indicator so that you can use 3 indicators at the lowest price. All three strategies are based on price action. But based on different trends. Long term, medium term and short term Attributes : No repaintin
現在20%OFF! このダッシュボードは、複数のシンボルと最大9つのタイムフレームで動作するソフトウェアの非常に強力な部分です。 このソフトは、弊社のメインインジケーター(ベストレビュー:Advanced Supply Demand)をベースにしています。    Advanced Supply Demand ダッシュボードは、素晴らしい概要を提供します。それは示しています。  ゾーン強度評価を含むフィルタリングされた需給値。 ゾーン内/ゾーンへのPips距離。 ネストされたゾーンがハイライトされます。 選択されたシンボルの4種類のアラートを全ての(9)時間枠で提供します。 それはあなたの個人的なニーズに合わせて高度に設定可能です。 あなたの利益! すべてのトレーダーにとって最も重要な質問です。 市場に参入するのに最適なレベルはどこか? 成功のチャンスとリスク/リターンを得るために、強力な供給/需要ゾーン内またはその近くで取引を開始します。 損切りの最適な位置はどこですか? 最も安全なのは、強力な供給/需要ゾーンの下/上にストップを置くことで
Backtest with good trend detection results from January 2023 EURUSD Time frame: m15, m30, H1 AUDUSD Time frame: m15, m30 NASDAQ Time frame: m15 S&P 500 Time frame: m15, m30 XAUUSD Time frame: m30 BTCUSD Time frame: H4 These are just some of the assets tested (Please note that past results are no guarantee of future results). Note that this is not a complete strategy, you can use this indicator as an entry trigger after your analysis by setting stop loss and take profit values ​​that you d
Max Payneは、矢印の形でシグナルを与える反転/トレンドシグナルインジケーターです。このインジケーターは、同じバーの終値でシグナルを出します。このインジケーターは、異なる期間でチャート上に複数回ドロップして、シグナルの2倍/3倍の確認を取得できます。 このインジケーターは、あらゆる取引スタイルに合わせて高度に調整できますが、再描画やバックペイントは一切行われません。購入後には、使用したテンプレートとともにスクリーンショットに表示される完全なシステムが表示されます。 ----------------- 取引方法: トレンドフィルター(購入後に得られるペイントレンド)が方向に一致している間、同じバーでトリプル確認が得られるまで待ちます 取引を開始し、買い取引の場合は金色の矢印 (テンプレート) より下、売り取引の場合は金色の矢印 (テンプレート) より上にストップロスを設定します。終了シグナルは最初の反対側の白い点のシグナル (テンプレート) です。 ----------------- パラメーター : 信号周期:矢印周期 フィルター: 信号フィルター 距離 : ローソクからの矢印
作者のその他のプロダクト
Aurum Apex Mt4 EA
Martin Alejandro Bamonte
Aurum Apex EAの説明 Aurum Apex EAは、MT4プラットフォーム向けに設計された強力な100%自動化された取引ツールです。リアルタイムで市場を分析し、さまざまな取引の機会を検出します。 すべてのレベルのトレーダーに適したAurum Apex EAは、リスクパラメータを介して調整可能な3つのリスクモードを提供します: リスク = 0.1(低リスク): 金の動きに慣れていない新規トレーダーに最適です。この設定では、驚きを最小限に抑えながら信頼を築きます。 リスク = 0.2(中リスク): 金取引に精通した経験豊富なトレーダーにお勧めです。利益の可能性とドローダウンの間で最適なバランスを実現します。 リスク = 0.3(高リスク): 1日数時間しかロボットを操作しない上級トレーダー向けです。この設定は、EAを3〜4時間後に無効にする人に適しています。USDやBTCの重要なニュースイベント中は注意が必要です。 ECNまたはゼロスプレッド口座で最低$1000から始めることをお勧めし、M1のタイムフレームでXAUUSDペアのみを取引します。ただし、Aurum Apexは利用
BullseyeSignal – NoRepaint は、名前が示すように、いかなる状況でも再描画されないシグナルです。シグナルは画像に表示された同じローソク足に表示されます。外為、暗号通貨、株式、指数、先物などの高ボラティリティ市場に最適です。 購入には緑の矢印、販売には赤の矢印のみが表示されますが、その背後にはより簡潔な取引体験を提供するために多くの指標が協力しています。 これは正確なエントリーを提供するために特別に設計されています。 多くのエントリーではなく、指標がトレンドの変化を示し、前のトレンドの反対方向に0レベルを超えたときに特定のエントリーを提供します。より正確な取引を実現するために、指標はトレンドの変化を確認するために最初のプルバックを待ち、偽の逆転を回避します。したがって、前のトレンドのブレイクとプルバックの確認後にシグナルが発行されます。 これは非常に慎重な取引アプローチです。 したがって、これらのヒントに従うことが重要です(初心者および上級トレーダーの両方がこの戦略を使用できます): ニューヨーク、ロンドン、または両市場の重複を使用することをお勧めします。
NextCandlePredictor インジケーター NextCandlePredictorは、再描画しない、色が変わらない、動かない、消えない、遅延がないアラート付きのシグナルインジケーターです。あらゆるタイムフレームで次のキャンドルまたはその次のキャンドルの方向を識別するのに役立ちます。ニューヨーク、ロンドン、またはその両方の重なり合う高ボラティリティ市場に特にお勧めです。 主な特徴: タイムフレームの汎用性: M1からH1以上のあらゆるタイムフレームで迅速かつ正確なシグナルを提供します。 明確な買い/売りシグナル: ADXのDI+とDI-ラインを使用して明確な買いと売りのシグナルを生成し、最良のトレード判断を下せるようにします。 直感的な視覚化: シグナルはチャート上に緑色(買い)と赤色(売り)の矢印で直接表示され、迅速かつ簡単に読み取れます。 カスタマイズ可能な設定: 分析するバーの数とアラートオプションを好みとトレード戦略に応じて調整できます。使用するTFに応じた提案表を以下で確認してください。 即時およびオプションのキャンドル終了時アラート: デフォルトでは、ADX条件が
「Scalping Signal No Repaint No Lag」は、どのチャートにドラッグしても、テンプレートや他のインジケーターをロードする必要なく、必要なすべてのインジケーターを自動的にロードする市場で唯一のインジケーターです。提供された画像とまったく同じようにチャートを自動的に設定します。このインジケーターはリペイントや遅延のないシグナルを保証し、すべての通貨ペアおよび時間枠(TF)でのスキャルピング戦略に最適です。 機能 インジケーターの自動ロード :インジケーターを任意のチャートにドラッグすると、追加の必要なインジケーターがすべて自動的にロードされ、設定された好みに応じてチャートが設定されます。ただし、設定からパラメータを変更することもできます。 チャートの可視化 :日本のローソク足や特定の色を使用して、視覚化を改善するためにチャートのプロパティを調整します。背景やローソク足の色は必要に応じて変更できます。 シグナル生成 :2つの移動平均線の差およびRSIとそのEMAのクロスオーバーを使用して、買いと売りのシグナルを生成し、チャートに矢印で表示します。 トレンドの可視化
Clear Breakout
Martin Alejandro Bamonte
「Breakout Buy-Sell」インジケーターは、異なる市場セッション(東京、ロンドン、ニューヨーク)での価格ブレイクアウトに基づいて、潜在的な売買機会を識別し、強調するために設計されています。このインジケーターは、トレーダーが買いゾーンと売りゾーン、および利益確定(TP)とストップロス(SL)レベルを明確に視覚化するのに役立ちます。 使用戦略 インジケーターは以下のように使用できます: 初期設定 :市場セッションを選択し、GMTオフセットを調整します。 市場の視覚化 :各セッションの開始時に描かれるブレイクアウトボックスを観察します。これらのボックスは期間の高値と安値を示します。 売買シグナル :ボックスの高値を超えた場合は買いシグナルと見なされます。安値を下回った場合は売りシグナルと見なされます。 リスク管理 :TP1、TP2、TP3、およびSLレベルを使用してポジションを管理します。TPレベルは異なる利益目標のために設計されており、SLは不利な動きに対する保護を保証します。 応用戦略 このインジケーターを最大限に活用するために、以下の戦略が推奨されます: ロンドンセッション
主な特徴: M15タイムフレームでGBPUSDに最適化: GBPUSDペア専用に設計およびテストされています。 推奨最低口座残高: 低いドローダウンを確保するために、最低$1000の口座残高が必要です。 スプレッドの互換性: 利益を最大化するために、低スプレッドまたはECN口座での使用が最適です。 リスク管理: エクスポネンシャルロット機能を1.0に設定することで無効にするオプションを含み、取引ニーズに応じて調整可能です。 カスタマイズ可能なパラメータ: 調整可能なパラメータの範囲を提供し、ユーザーがEAを自分の取引スタイルとリスク許容度に合わせて調整できるようにします。 GBPUSD Pip Hunter EAのパラメータ説明 MM(マネーマネジメントの切り替え) 説明: マネーマネジメント機能を有効または無効にするための切り替え。 オプション: いいえ: マネーマネジメントを無効にします。 はい: マネーマネジメントを有効にします。 MMType 説明: 使用するマネーマネジメントの種類を指定します。 オプション: いいえ: マネーマネジメントを無効にします。 はい: マネーマネジ
MTFMA(マルチタイムフレーム移動平均)インジケーターは、異なる時間枠で複数の移動平均(MA)を使用して、メインチャートとは別のウィンドウで買いと売りのシグナル(リペイントしない)を提供します。これは、短時間枠でのスキャルピングや長時間枠での長期取引の両方に適しており、多用途で解釈が簡単です。 なぜマルチフレームなのか? マルチフレームという用語は、インジケーターが複数の時間枠のデータを使用および組み合わせる能力を指します。MTFMAは、4つのカスタマイズ可能な移動平均(MA)に基づいてシグナルを計算して表示します。各MAは、異なる期間、計算方法、および価格タイプに調整できるため、トレーダーは1つのチャートで短期および長期のトレンドの組み合わせを見ることができます。 重要なポイント: 多用途性:分から月まで、あらゆる時間枠で使用可能。スキャルピングから長期取引まで適しています。 リペイントしない:シグナル(上矢印または下矢印)が生成されると、その色は変わらず、トレーダーが生成されたシグナルに基づいて取引判断を行うことができます。 簡単な解釈:買いと売りのシグナルは、下部インジケーター
フィルタ:
レビューなし
レビューに返信