Ultimate Pivot Points
- 指标
- Abbas Shojaee
- 版本: 1.10
- 更新: 25 五月 2024
### 介绍 MetaTrader 5 的终极枢轴点水平指标
Ultimate_Pivot_Levels 是一种多功能工具,旨在通过准确绘制枢轴点水平来增强您的交易体验。它允许您手动输入所需的值或使用众所周知的枢轴点计算方法来创建枢轴点水平。它在背景中绘制这些水平,并允许您自定义水平、区域的大小和颜色,同时在每个新柱状图中保持您的调整。无论您是新手交易者还是经验丰富的专业人士,此指标都能为您提供灵活性和精确度,使您能够做出明智的交易决策。
### 主要特点
1. **多种枢轴点计算方法**:Ultimate_Pivot_Levels 指标支持多种枢轴点计算方法,允许您选择最适合您的交易策略的方法:
- **手动值**:输入您的自定义枢轴点水平,或从所需的频道或网站复制粘贴。
- **标准方法**:基于前一周期的高、低和收盘价格的经典枢轴点计算方法。
- **Camarilla 方法**:以其独特公式而闻名的流行方法。
- **Woodie 方法**:一种变体,更多地考虑了收盘价。
- **DeMark 方法**:由 Tom DeMark 开发的方法,专注于特定的市场条件。
- **斐波那契方法**:使用斐波那契比率来计算枢轴点水平。
2. **线条和矩形区域绘制**:该指标允许您在枢轴点水平上绘制线条或矩形。
3. **可自定义**:您可以自定义矩形的颜色、样式和宽度,以匹配您的图表美学。此级别的自定义确保您的图表保持整洁易读。使用 KeepUserAdjustedAreas 功能,您对枢轴点水平的任何手动调整都会被保留,即使时间框架发生变化。这确保您的自定义分析保持完整。
4. **可调节时间框架**:该指标可以根据不同的时间框架(如每小时、每天或每周)计算枢轴点水平。这种灵活性允许您分析多个时间框架并全面了解市场。
5. **可调节时区**:由于外汇市场是24小时开放的,所以决定每个24小时周期的开盘、收盘、高点和低点的时间一直存在争议。然而,大多数交易者同意,当枢轴点调整为 GMT 或东部时间(纽约 - EST)时,预测最为准确。您可以通过设置 Time Zone Adjustment 来进行此类调整。
6. **多个枢轴指标**:您可以在图表上使用多个 Ultimate_Pivots 指标实例来添加更多水平,或跟踪多个时间框架的枢轴。例如,添加基于 D1 周期的第一个实例和基于 H4 周期的第二个实例。
7. **易于集成**:Ultimate_Pivot_Levels 指标设计为可以轻松集成到您现有的交易设置中。其直观的输入设置使其易于配置和使用。
### 输入参数和自定义
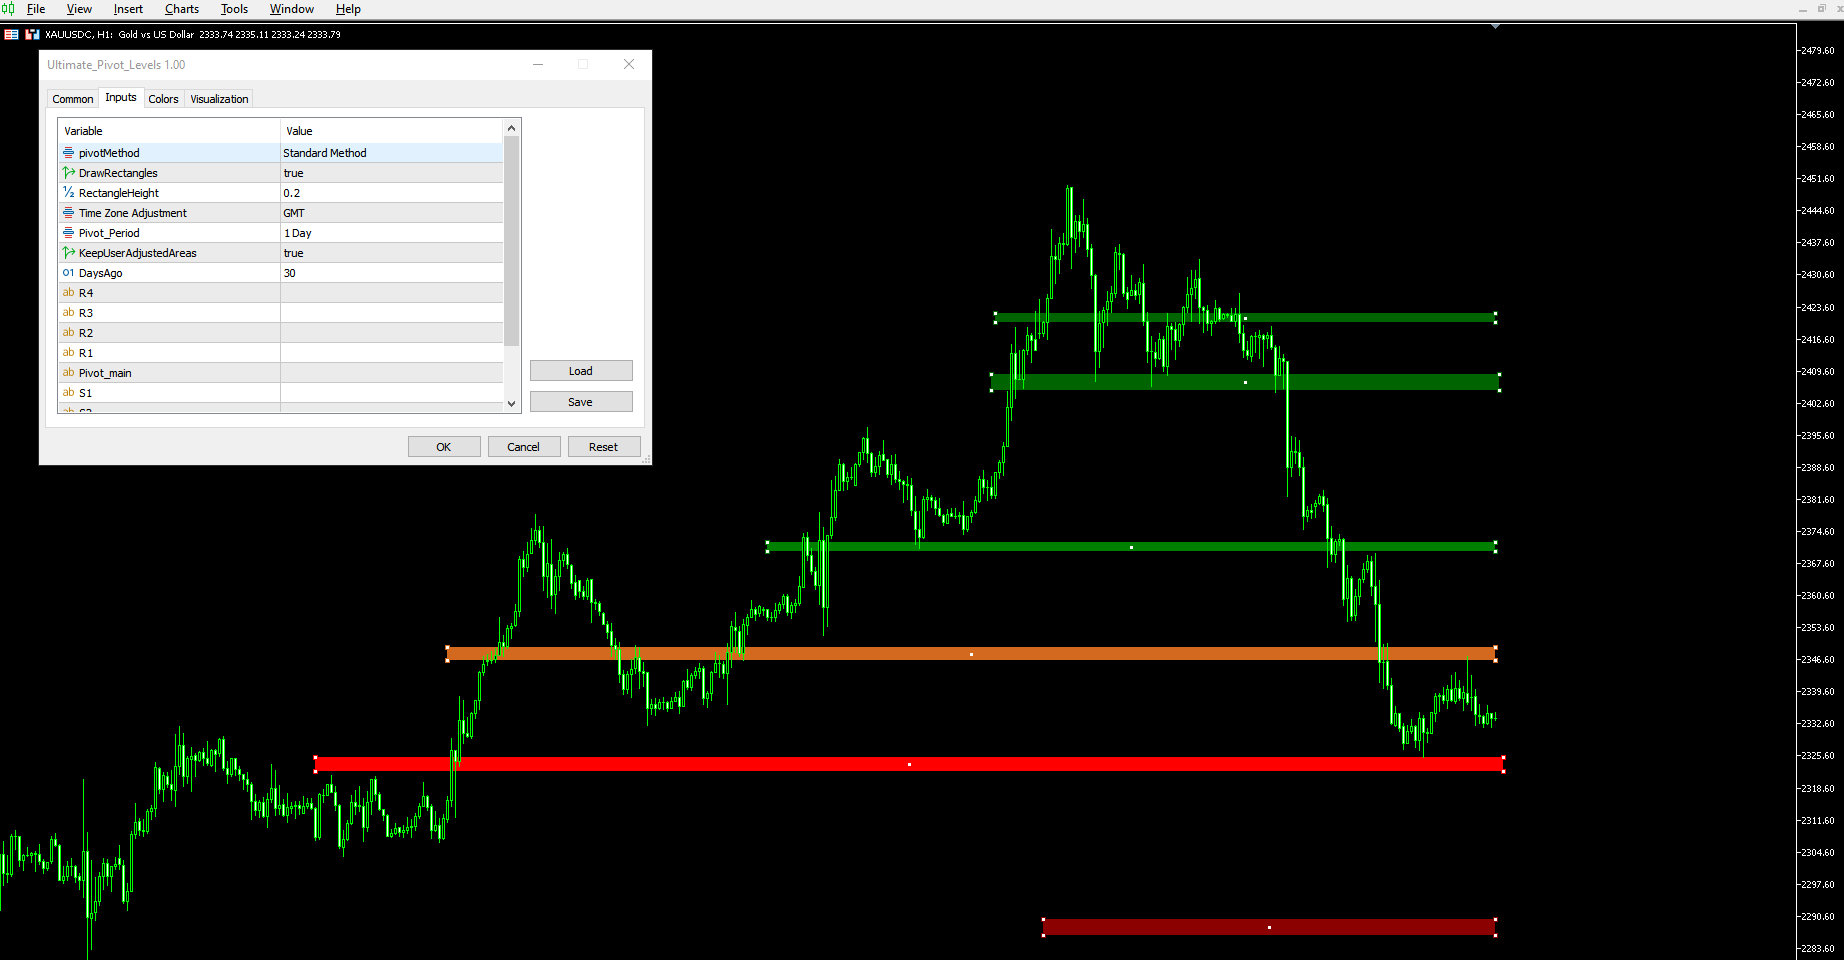
**输入参数**
1. **枢轴点计算方法**
- **手动**:使用用户指定的手动值。
- **标准**:使用标准枢轴点计算方法。
- **斐波那契**:将斐波那契水平纳入枢轴点计算中。
- **Camarilla**:使用 Camarilla 方程计算更敏感的水平,适合日内交易。
- **Woodie**:应用 Woodie 的公式,更加注重前一周期的收盘价。
- **DeMark**:特色是 Tom DeMark 的枢轴点,专注于最近的价格行为。
- **描述**:根据您的交易策略选择计算枢轴点的方法。
2. **绘制矩形**
- 切换以在枢轴点水平周围绘制矩形以获得更好的可视化效果。设置为 false 时,枢轴点水平用线条表示。
3. **矩形高度**
- 调整枢轴点水平周围矩形的高度。较大的值增加矩形的厚度,提高可见性,但覆盖更多的图表空间。
4. **时区调整**
- **不调整**:使用本地时间查找前一周期的高点、低点、收盘价和开盘价以进行枢轴点计算。
- **纽约东部时间(EST)**:调整枢轴点计算以与纽约市场时间(EST)对齐。
- **格林威治标准时间(GMT)**:调整枢轴点计算为格林威治标准时间(GMT)。
- **描述**
5. **枢轴周期**:选择时间框架(例如 M1、M5、H1、H4、D1、W1),用于获取高点、低点、收盘价和开盘价以进行枢轴点计算。此选择确定每个枢轴点涵盖的时间跨度。
6. **保持用户调整的区域**:启用后,用户对枢轴区域边界(如调整矩形大小)的任何修改将在会话和图表重新加载期间保留,从而允许持久的自定义设置。
Ultimate_Pivot_Levels 指标是依靠枢轴点进行交易策略的交易者的强大工具。其灵活性、易用性和自定义选项使其成为任何交易者工具包中的有价值的补充。现在从 MetaTrader 5 市场下载它,让您的交易更上一层楼!
Ultimate_Pivot_Levels 是一种多功能工具,旨在通过准确绘制枢轴点水平来增强您的交易体验。它允许您手动输入所需的值或使用众所周知的枢轴点计算方法来创建枢轴点水平。它在背景中绘制这些水平,并允许您自定义水平、区域的大小和颜色,同时在每个新柱状图中保持您的调整。无论您是新手交易者还是经验丰富的专业人士,此指标都能为您提供灵活性和精确度,使您能够做出明智的交易决策。
### 主要特点
1. **多种枢轴点计算方法**:Ultimate_Pivot_Levels 指标支持多种枢轴点计算方法,允许您选择最适合您的交易策略的方法:
- **手动值**:输入您的自定义枢轴点水平,或从所需的频道或网站复制粘贴。
- **标准方法**:基于前一周期的高、低和收盘价格的经典枢轴点计算方法。
- **Camarilla 方法**:以其独特公式而闻名的流行方法。
- **Woodie 方法**:一种变体,更多地考虑了收盘价。
- **DeMark 方法**:由 Tom DeMark 开发的方法,专注于特定的市场条件。
- **斐波那契方法**:使用斐波那契比率来计算枢轴点水平。
2. **线条和矩形区域绘制**:该指标允许您在枢轴点水平上绘制线条或矩形。
3. **可自定义**:您可以自定义矩形的颜色、样式和宽度,以匹配您的图表美学。此级别的自定义确保您的图表保持整洁易读。使用 KeepUserAdjustedAreas 功能,您对枢轴点水平的任何手动调整都会被保留,即使时间框架发生变化。这确保您的自定义分析保持完整。
4. **可调节时间框架**:该指标可以根据不同的时间框架(如每小时、每天或每周)计算枢轴点水平。这种灵活性允许您分析多个时间框架并全面了解市场。
5. **可调节时区**:由于外汇市场是24小时开放的,所以决定每个24小时周期的开盘、收盘、高点和低点的时间一直存在争议。然而,大多数交易者同意,当枢轴点调整为 GMT 或东部时间(纽约 - EST)时,预测最为准确。您可以通过设置 Time Zone Adjustment 来进行此类调整。
6. **多个枢轴指标**:您可以在图表上使用多个 Ultimate_Pivots 指标实例来添加更多水平,或跟踪多个时间框架的枢轴。例如,添加基于 D1 周期的第一个实例和基于 H4 周期的第二个实例。
7. **易于集成**:Ultimate_Pivot_Levels 指标设计为可以轻松集成到您现有的交易设置中。其直观的输入设置使其易于配置和使用。
### 输入参数和自定义
**输入参数**
1. **枢轴点计算方法**
- **手动**:使用用户指定的手动值。
- **标准**:使用标准枢轴点计算方法。
- **斐波那契**:将斐波那契水平纳入枢轴点计算中。
- **Camarilla**:使用 Camarilla 方程计算更敏感的水平,适合日内交易。
- **Woodie**:应用 Woodie 的公式,更加注重前一周期的收盘价。
- **DeMark**:特色是 Tom DeMark 的枢轴点,专注于最近的价格行为。
- **描述**:根据您的交易策略选择计算枢轴点的方法。
2. **绘制矩形**
- 切换以在枢轴点水平周围绘制矩形以获得更好的可视化效果。设置为 false 时,枢轴点水平用线条表示。
3. **矩形高度**
- 调整枢轴点水平周围矩形的高度。较大的值增加矩形的厚度,提高可见性,但覆盖更多的图表空间。
4. **时区调整**
- **不调整**:使用本地时间查找前一周期的高点、低点、收盘价和开盘价以进行枢轴点计算。
- **纽约东部时间(EST)**:调整枢轴点计算以与纽约市场时间(EST)对齐。
- **格林威治标准时间(GMT)**:调整枢轴点计算为格林威治标准时间(GMT)。
- **描述**
5. **枢轴周期**:选择时间框架(例如 M1、M5、H1、H4、D1、W1),用于获取高点、低点、收盘价和开盘价以进行枢轴点计算。此选择确定每个枢轴点涵盖的时间跨度。
6. **保持用户调整的区域**:启用后,用户对枢轴区域边界(如调整矩形大小)的任何修改将在会话和图表重新加载期间保留,从而允许持久的自定义设置。
Ultimate_Pivot_Levels 指标是依靠枢轴点进行交易策略的交易者的强大工具。其灵活性、易用性和自定义选项使其成为任何交易者工具包中的有价值的补充。现在从 MetaTrader 5 市场下载它,让您的交易更上一层楼!
用户没有留下任何评级信息