• 概述
  • 评论
  • 评论
  • 新特性

MTF Precise Price Action Arrow Filtered Model T

交易者您好。

介绍我最好的交易工具。


MTF PPAAF T 型。

多时间范围精确价格行为箭头过滤模型 T。 

这个交易工具是我多年来制作各种交易工具后最好的作品。

为什么这个交易工具是最好、最可靠的? 

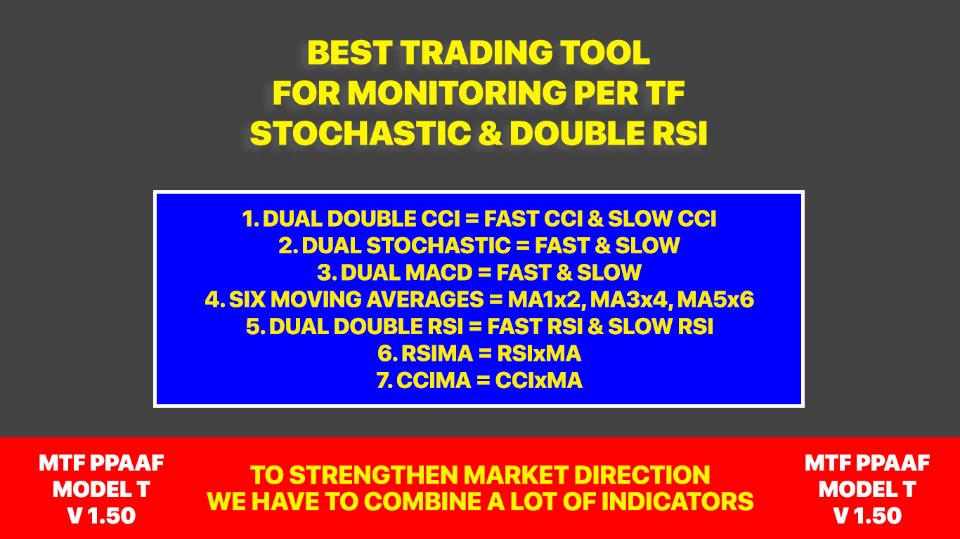
1. 该工具使用6个指标: 

🔹双倍 CCI = 快 CCI x 慢 CCI
🔹双随机 = 快随机(快随机主线 x 快随机信号线)& 慢随机(慢随机主线 x 慢随机信号线) 
🔹双MACD=快速MACD(快速MACD主线x快速MACD信号线)&慢速MACD(慢速MACD主线x慢速MACD信号线)
🔹六条移动平均线 = MA 1 x MA 2 、MA 3 x MA 4 和 MA 5 x MA 6
🔹Dual Double RSI = 快速 DRSI(快速 DRSI 主线 x 快速 DRSI 信号线)& 慢速 DRSI(慢速 DRSI 主线 x 慢速 DRSI 信号线)
🔹RSIMA = RSI x MA

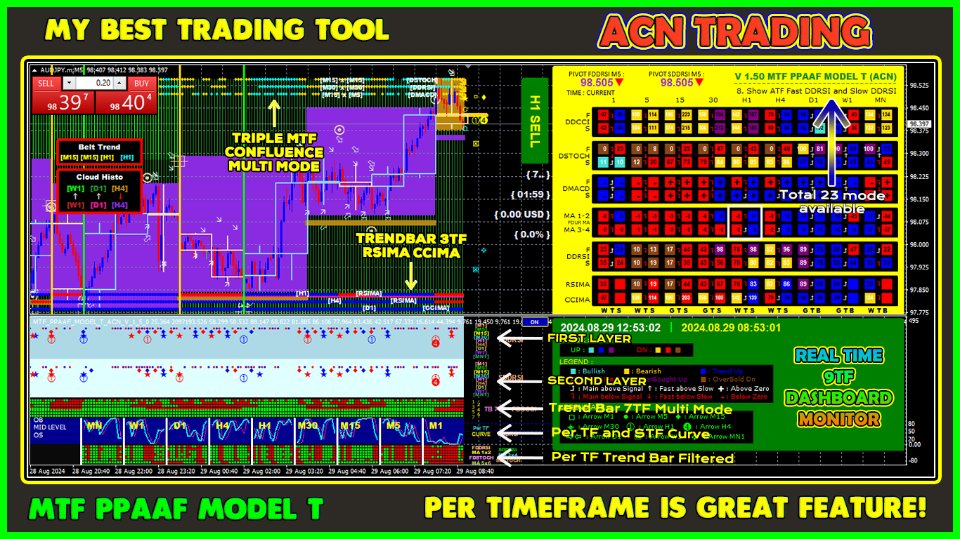
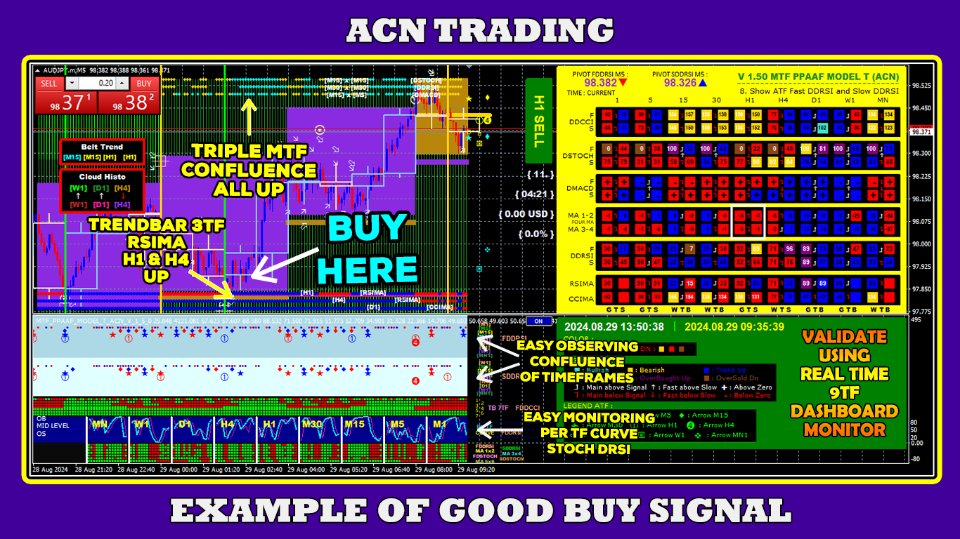
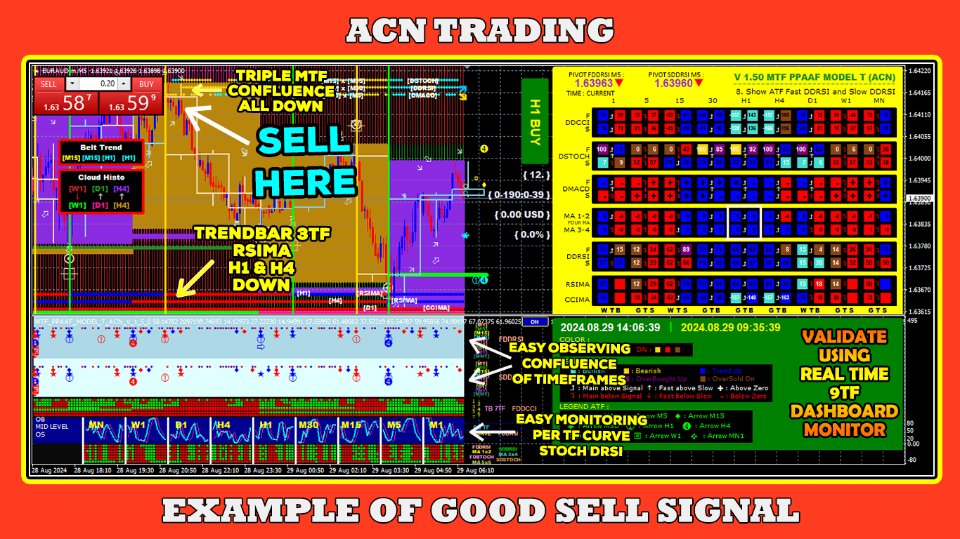
2. 实时9TF仪表板监控(第一个仪表板)。


该仪表板将为您提供有关上述 6 个指标数据的实时信息。 
主线是在信号线之上还是之下。 
是正向上升还是负向下降。
是否在 OBOS 级别。 
在较低时间范围内进行交易时监控较高时间范围的市场结构很容易。 

3. 第一个仪表板配备了各种功能:

🔹有 20 种配色方案可供选择。 如果你觉得无聊,你可以轻松更换它。
🔹当前本地电脑时间和经纪人时间。
🔹枢轴值。
🔹重播系统。 
🔹TSPI。 

4. 23种模式可供选择。

🔹模式1:可以显示MA 1x2和MA 3x4的ATF交叉箭头
🔹模式2:可以显示FAST DSTOCH和FAST DDRSI的ATF交叉箭头
🔹模式3:可以显示FAST DSTOCH和SLOW DDRSI的ATF交叉箭头
🔹模式4:可以显示SLOW DSTOCH和FAST DDRSI的ATF交叉箭头
🔹模式5:可以显示SLOW DSTOCH和SLOW DDRSI的ATF交叉箭头
🔹模式6:可以显示FAST DSTOCH和SLOW DSTOCH的ATF交叉箭头
🔹模式7:可以显示FAST DDRSI和SLOW DDRSI的ATF交叉箭头
🔹模式8:可以显示FAST DSTOCH和MA 1x2的ATF交叉箭头
🔹模式9:可以显示FAST DSTOCH和MA 3x4的ATF交叉箭头
🔹模式10:可以显示SLOW DSTOCH和MA 1x2的ATF交叉箭头
🔹模式11:可以显示SLOW DSTOCH和MA 3x4的ATF交叉箭头
🔹模式12:可以显示FAST DDRSI和MA 1x2的ATF交叉箭头
🔹模式13:可以显示FAST DDRSI和MA 3x4的ATF交叉箭头
🔹模式14:可以显示SLOW DDRSI和MA 1x2的ATF交叉箭头
🔹模式15:可以显示SLOW DDRSI和MA 3x4的ATF交叉箭头
🔹模式16:可以显示DCCI和FAST DSTOCH的ATF交叉箭头
🔹模式17:可以显示DCCI和SLOW DSTOCH的ATF交叉箭头
🔹模式18:可以显示DCCI和FAST DDRSI的ATF交叉箭头
🔹模式19:可以显示DCCI和SLOW DDRSI的ATF交叉箭头
🔹模式20:可以显示DCCI和FAST DMACD的ATF交叉箭头
🔹模式21:可以显示DCCI和SLOW DMACD的ATF交叉箭头
🔹模式22:可以显示MA 1x2和MA 5x6的ATF交叉箭头
🔹模式23:可以显示MA 3x4和MA 5x6的ATF交叉箭头

5.重播系统。

此功能现在不仅适用于第一个仪表板,还适用于 Per TF Stoch DRSI 曲线。 
这真是太棒了。
使用此功能,您可以回到特定日期和时间。 
例如,分析三天前特定日期和时间为何出现强劲抛售很容易。 

6. TSPI = 时间利差利润信息。 

此功能将为您提供实时交易期间的时间、点差和盈亏的真实数据。

7. 当前本地计算机时间和经纪人时间。

此功能将告诉您您的计算机时间和经纪人时间的实时时间。

8.第二个仪表板。

🔹 11 种可用配色方案包括

🔹 第 1 层、第 2 层

🔹 趋势栏 5TF 多模式

🔹 MTF 双曲线

🔹 根据 TF Stoch DRSI 曲线

🔹 每个 TF 趋势条按 MA 1x2、MA 3x4 和 MA 5x6 过滤


9. 第 1 层和第 2 层。

监控所有时间范围 (ATF) 交叉箭头非常重要。 
这就是为什么这个工具配备了两层。 
第一个 ATF 交叉箭头位于第 1 层。
而第二个 ATF 交叉箭头位于第 2 层。

10.趋势栏五时间范围多模式。

🔹模式一:基于DCCI
🔹模式2:基于DSTOCH
🔹模式3:基于DMACD
🔹模式4:基于DRSI
🔹模式5:基于MA1x2
🔹模式6:基于MA3x4
🔹模式7:基于MA5x6
对于时间范围,我喜欢使用 M5、M15、M30、H1 和 H4。
当 5TF 趋势条从 M5 到 H4 全部显示相同颜色时,则存在强烈的买入/卖出信号。

11. 根据 TF Stoch DRSI 曲线。

这确实是一个视觉监控的好功能。
您可以实时查看 Stoch DRSI 是否仍然向上交叉或已从 M1 向下交叉到 MN。 
通过此功能,我们可以知道正确的入场时间。 
您也可以将回放系统应用于 Per TF Stoch DRSI 曲线。 
这是很棒的功能!
您还可以查看每个 TF 的趋势条:
🔹DRSI 1
🔹DRSI 2
🔹MA 1x2
🔹MA 3x4
🔹STOCH 1
🔹STOCH 2

🔹MA 5x6

12. MTF 双 Stoch DRSI 曲线。


使用此功能您可以选择激活双随机和双双 RSI 的 MTF 曲线。 

双 DRSI 快速 M5 和慢速 M15 参数默认打开。 


13. 在图表窗口上。


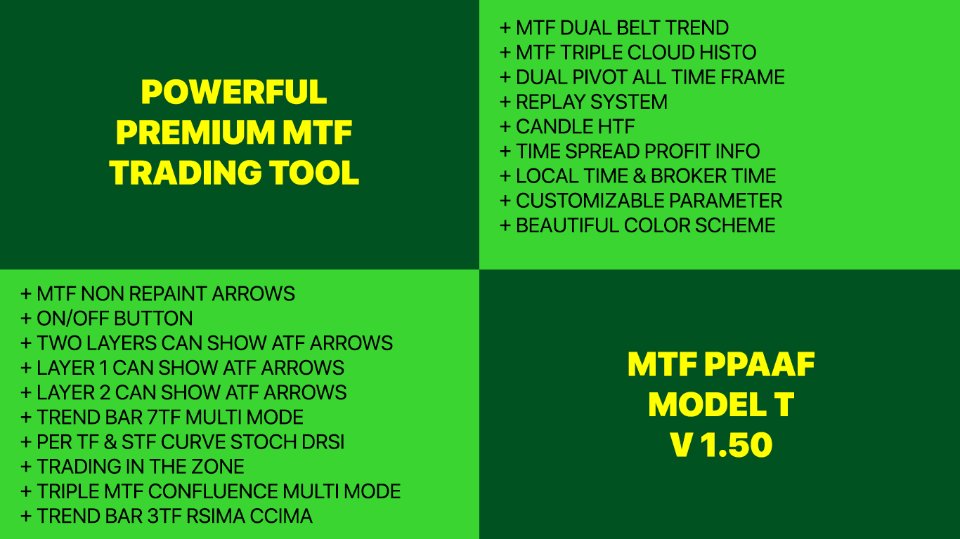
🔹 双MTF腰带趋势


🔹Confluence MTF 多模式


🔹 双 MTF 云直方图


14.双MTF带趋势。


皮带趋势基本上基于两条移动平均线的交叉。 

参数、时间范围、箭头和颜色均可定制。 


15.Confluence MTF 多模式。


汇合意味着如果 TF 1 和 TF 2 存在交集,则会出现箭头。 

需要明确的是,如果 TF 1 向下且 TF 2 向下,则会出现向下箭头。 

同样,如果 TF 1 向上且 TF 2 向上,则会出现向上箭头。

🔹模式1:基于双双RSI

🔹模式2:基于双随机

🔹模式3:基于双MACD

并且有垂直线汇合,使检查更加清晰。 


16. 双 MTF 云历史。


云历史也基本上基于两个移动平均线的交叉。 

参数、时间范围、历史颜色均可定制。 


17. 蜡烛高时间框架。


监控较高时间范围的市场结构,同时打开较低时间范围的图表很容易。

默认情况下蜡烛 HTF 设置为 H1。 


18. 区内交易 (TITZ)。


🔹基于MA3 x MA4的垂直线TITZ。

🔹基于MA1 x MA2的水平线TITZ。

🔹基于 MA1 x MA2 的枢轴值水平线 TITZ。

🔹基于 MA3 x MA4 买入卖出 TITZ 状态。

参数、时间范围、颜色均可定制。 


充分利用今天的促销活动。 我应该以 2,500 美元的价格出售这款经过多年研究的复杂产品。


+ Zoom 会议可供该产品的购买者使用。


立即下载并开始赚钱!


谢谢。

推荐产品
PTW NON REPAINT TRADING SYSTEM + HISTOGRAM Non-Repainting ,   Non-Redrawing   and   Non-Lagging  Trading System. Does the following: - Gives Accurate Entry and Exit Points - Scalping, Day and Swing Trading  - 95% Accuracy  - Targets, where to take profits. - Shows Trends, Support and resistance levels - Works on All Brokers - Works on All Currencies, CFDs and Stocks - It does not place trades for you, it only shows you what trades to place. - It works on All Timeframes - It is for Trend or ra
Reversal Overlap Bot is an automated trading strategy. No technical indicators are used in the work. At the beginning of trading, the first order is placed in a certain direction (at your option). When you open a new candle, this order is closed if it is in profit. Otherwise, the next order opens in the opposite direction. Orders are closed when profit is reached. If there are unprofitable orders on the chart, the robot will close one of them. When closing loss-making orders, the profit covers t
This trading expert advisors is an clone & upgrade of  "EA Rough Duster ", also trades best on GBPNZD minute 5 timeframe. Maintains a constant account growth and runs best on low spread and commission based accounts. Uses Martingale & perfect hedging to recover unprofitable positions ensuring no loss. Its consistent profit curves,low DrawDowns & risk proves the record for itself in reliability and consistency plus its unique market analysis ensures quick extraction of profits by scalping the mar
FTC Neuro
Aliaksandr Ausiyevich
欢迎来到创新交易解决方案的世界! 我们提请您注意我们的高级交易顾问  Ftc Neuro ,在最新的宏观经济统计数据和现代神经网络计算的基础上工作。 在复杂算法的帮助下分析市场情况,顾问使用先进的人工智能算法识别经济信息中的隐藏模式。 它为您提供最专业的交易体验,为进入和退出交易提供独特的积分。 每个人都知道,高质量的交易始终是风险和利润之间的平衡。 我们开发了一个独特的风险管理系统,我们的顾问仔细管理它们,以保证您的资金安全。 自动化您的交易策略和简化复杂的决策与我们的FTC神经交易顾问! 获得增加资本的机会,最大限度地降低风险! 而这一切-在未来的舒适和信心。 立即试用我们的交易顾问,让自己沉浸在专业和高质量的交易世界中! 在顾问的工作中,制定了两种独立和独立的算法-根据宏观经济统计数据计算运动方向和根据神经网络计算运动方向。 根据宏观经济统计数据计算运动方向是根据一个公式进行的,该公式包括该国的主要宏观经济数据,并将这些计算的数据传输到制定的宏观经济指标。 在图表上显示的信息板中,此计算由名称Direct表示。 在计算特定国家(例如加拿大)的货币的移动方向后,将此计
Kilimanjaro EA
Botond Ratonyi
5 (1)
Check out my youtube channel about forex trading robots:  https://www.youtube.com/channel/UCL_p6fuQtNkg-1rRY69t5Ig Message me on telegram if you have any questions:  https://t.me/BRobotTrader H1 TIMEFRAME Updates and improvements(2021.08.12): USE THE SET FILES FROM THE COMMENT SECTION! This is the biggest update in the life of the KILIMANJARO EA, it got new features and NEW engine, plus many new parameters to optimize and play around with. ---It got the official TheNomadTrader
Oscillator helps determine the direction of the market Shows the direction of the price movement and is painted in the appropriate color. Allows you to conduct trend and counter trend trading It works on all timeframes, on any currency pairs, metals and cryptocurrency Can be used when working with binary options Distinctive features Does not redraw; Simple and clear settings; It works on all timeframes and on all symbols; Suitable for trading currencies, metals, options and cryptocurrency (Bitco
Radar Fibo 123
Carlos Augusto Cedeno Rocha
https://www.mql5.com/es/signals/1654340 使用此工具,它将帮助您自动运行获胜的 SL 形成一个斐波那契雷达斐波那契 123 策略,以最少的彩票入场作为支撑和阻力 对支撑和阻力中的一切都采取积极的态度。 Shǐyòng cǐ gōngjù, tā jiāng bāngzhù nín zìdòng yùnxíng huòshèng de SL xíngchéng yīgè fěi bō nà qì léidá fěi bō nà qì 123 cèlüè, yǐ zuìshǎo de cǎipiào rù chǎng zuòwéi zhīchēng hé zǔlì duì zhīchēng hé zǔlì zhōng de yīqiè dōu cǎiqǔ jījí de tàidù. 他应用自动关闭和自动锁定。您正在寻找每月最低和最高收入的地方。 次月活跃。 Tā yìngyòng zìdòng guānbì hé zìdòng suǒdìng. Nín zhèngzài xúnzhǎo měi yuè zuìdī hé zuìgāo shōur
This is a correlation hedge type indicator which helps trade the obscure relationship between crude oil and natural gas markets. Which is overall an unknown trading concept to most traders, yet a very impressive one. The usual market risk is mittigated through the smooth trend of hedge tading, as well as the leading signals the indicator provides! Pros: low risk trading, normal profits, no need to be right about either market Cons:  requires large capital ----------------------------------
Premium M15
Raphael Schwietering
Dear Investor, I am a full-time system developer since 2010, having developed thousands of trading systems in the last 11 years. My main goal when developing a strategy is long-term growth. All my systems have to pass strict criteria in terms of backtests, out-of-sample validations on unseen symbols, Monte Carlo simulations on different data feeds, slippage, and increased spreads.  It: Trades the EURUSD M15 with a focus on long-term growth. Opens trades at bar and uses no martingale nor any gri
Jobot Basic Martingale
Jakkarin Chinsuwan
This EA can run on every currencies pairs recommend EURUSD, USDJPY, EURJPY, GBPUSD Timeframe 30 Minute (M30) The important advantage of this EA is that you can start to trade with $1000 min imum initial Deposit. And the robot can support your manual transactions on EURUSD. ACCOUNT LEVERAGE: 1:100 ACCOUNT (Stop Out): 50% or less ACCOUNT TYPE: Real account ACCOUNT MODE: Hedging account Take Profit: Automatically Stop Loss: Automatically LOT size: Manual first order
Golden Move 2
Damian Mateusz Wojtowicz
The best indicator out there, try it yourself! Please leave your positive comments and reviews! Settings: AlertConfirmation: truns on and off alerts CalculatedBars: how many bars will be calculated Distance : arrow distance Buffers: Buffer0 (Arrow Buy) Buffer1 (Arrow Sell) Buffer2 (Empty) Buffer3 (Empty) Buffer4(Buy value == 1) Buffer5(Sell value ==1)
According to my 18+ years of trading experience, it is too naive to believe that you will get rich by buying a junk EA and let it run automatically without any fundamental knowledge in investment. For those who want to be serious about investing they should buy this EA and train themselves as professional traders with appropriate minimal intervention to the EA. User friendly Interface. On panel fat finger protection. High speed for sending   manual  orders. Auto follow up for manual orders pla
Please download User Guide / set files / Strategy Tester Report from here: https://www.mql5.com/en/blogs/post/689449 Twins Grid System is a powerful and flexible tool for experienced trader. This system is consist of 2 full grids: Grid A and Grid B, each full grid contains 4 basic grid: BuyLimits Grid, SellLimits Grid, BuyStops Grid and SellStops Grid. There are 31 system parameters, 22 parameters for each basic grid. It’s able to create various kinds of grid strategies. Features (1) Some grid
Fisher Steels
Ivan Simonika
The   Fisher Steel  bot implements the maximum of the HFT definitions. The expert system goes through the entire history and all currency pairs with a single setting. If there is a commission on the account, it must be converted into the equivalent of the spread and fill in the Commission field. Both virtual and real stop losses are used. Normal working conditions: The lower the commission and the spread, the greater the profit. The more latency your broker has in the amount of the Internet c
Vision Fx v
Samuel Nancwat Isaac
隆重推出 Vision fx EA,这是一款先进的交易机器人,旨在利用外汇市场中短期和长期反转模式的动态相互作用。 与其他机器人不同,该 EA 避免了网格或套利策略,确保了安全且经过计算的交易体验。 Vision fx EA 适合各种技能水平的交易者,无论是经验丰富的交易者还是初学者。 这种多功能的交易系统具有丰富的功能,包括防止点差升高以及提供固定或自动手数交易的自由。 建议: 货币对:所有外汇对,但推荐欧元美元 时间范围:M5 最低存款:$100 账户类型:ECN、Raw 或 Razor,点差极低。 经纪商:IC Markets、Pepperstone with Raw 和 Razor 的点差最低 重要提示:使用低点差帐户以获得最佳结果非常重要! 批量大小:我们有自动批量大小,但您可以更改为您喜欢的大小 Lóngzhòng tuīchū Vision fx EA, zhè shì yī kuǎn xiānjìn de jiāoyì jīqìrén, zhǐ zài lìyòng wàihuì shìchǎng zhōng duǎnqí hé chángqí fǎn
I will support only my client. สำหรับลูกค้า Parameters General Trade Settings Money Management  Lot : Fixed (can change) Strategies  - M1-D1 Strategies it is fixed with MA, Bollinger band, Candlestick Levels Close Functions  - M1-D1 Strategies Close by Money Profit  - Close Total Open Profit, Close Total Open Profit Short, Close Total Open Profit Long, Close Profit/Loss Today MagicNumber  - individual magic number. The EA will only manage position of the chart symbol with this magic number.
This system never paints.   This system created by using Envolpes bands and reverse bar count.   This indicator is only working in M5 period.   This system is for long term and profitable.   Signals are shown as arrows. as an optional limit orders.   You can set a voice alarm or email notification.   You can fins our other products from link : https://www.mql5.com/en/users/drbastem/seller   Also, you can ask all your questins from email : haskayafx@gmail.com or mobile : +90 530 867 5076 or @Meh
Genotype mt4
Tatiana Savkevych
Genotype : Your reliable guide in the world of Forex Genotype is an advanced Forex trading bot specifically designed for traders seeking efficient and automated trading. This innovative tool offers a wide range of features and capabilities to enable traders to effectively manage their trades and strategies. Special offer for early adopters: price reduced, but will be increased in the future. Tools for work: EURUSD, AUDCAD, AUDCHF, AUDJPY, AUDNZD, AUDSGD, AUDUSD, CADCHF, CADJPY, GBPSEK, GBPS
Boost binary option profesional
Sebastian Alejandro Merino Sepulveda
Binarias & Forex (+90% Ratio-Win Next Candle) Espere que el precio llegue a una buena zona (fuerte) sea soporte, resistencia, zona de oferta o demanda, fibonacci level key, cifra redonda. Haciendo lo anterior definitivamente habrá una reversión en el precio y obtendrá su ITM en primera vela dando una efectividad del 100% siguiendo la tendencia. Es muy importante estar atento a las noticias fundamentales en el mercado y estas no afecten tu trading. Sesiones comerciales: cualquiera (24 horas).
Golden Range 2
Damian Mateusz Wojtowicz
Golden Range 2 is one of the top entry indicators securing its future with its results.  Indicator settings: Points = how precise pattern detection is AlertConfirmation = turn on(true) off(false) alert CalculatedBars = how many bars will be calculated Please leave Positive comments, reviews. Buffer 0 Buy Arrow, Buffer 1 Sell Arrow, Buffer2 Buy Signal(Value:1/0), Buffer3 Sell Signal(Value:1/0)  Buy Green, Sell Red
This Expert Advisor has Three Trading Strategies: TRADING_STRATEGY_ONE - Intra Day / Short Term Trading Strategy. TRADING_STRATEGY_TWO - Mid Term / Long Term Trading Strategy. TRADING_STRATEGY_THREE - SMART__NEWS__TRADER - High Impact News Trading Strategy With 25 Years NFP History Trading in GBPUSD, EURUSD &  AUDUSD. NOTE: Default Settings Already Optimized For GBPUSD. Other symbols require optimization. Much and careful work has been done to package this E.A. all together. Having tested it w
Mongol Indicator2
Sumiyabazar Buyanjargal
It's a variation of mid of HH and LL since it compares the higher of HH or LL against a period and twice the number of bars back to avoid whipsaws. I used to display this against lines on a chart, but made a histogram out of it and it looks interesting. It looks good at gauging trend strength and general turns (see image below). The name of the indicator is BAM, which is an acronym for "Below and Above Mid". Ways to use it: 1. To see general trend on longer TFs (more than 30 ba
ANOVA Seeking
Mano Boonsok
**Multi-Strategy EA with Advanced Statistical Analysis (ANOVA & R-squared)** **Core Statistical Framework:** 1. **ANOVA Analysis:**    - One-way ANOVA: For trend direction significance    - Two-way ANOVA: For market variable interactions    - P-value thresholds < 0.15 for trade validation 2. **R-squared Analysis:**    - ATR R² (Strong correlation ≥ 0.75)    - Standard Deviation R² (Moderate: 0.50-0.74)    - EMA R² (Weak: 0.25-0.49)    - Combined R² for overall market state    - Determines s
EPriceJPY
Ngo Yung Lau
EPriceJPY is a auto-trading EA focused on USDJPY. Trading Concept The operation concept of EPriceJPY is based on an algorithm that tries to determine the Trend. To be more specific, EPriceJPY works with its own calculation logic based on simulation. It is trying to find out the Top or Bottom in a Trend, and open the Short or Long Position accordingly. Don't expect EPriceJPY to open the trade on the highest or lowest level, because EPriceJPY will trade only when the Top/Bottom can be confirmed.
Meat EA
Roman Kanushkin
5 (1)
The Meat EA is a fully automatic, 24-hour trading system. It trades based on analysis of market movement on the basis of a built-in indicator and the Moving Average trend indicator. The system is optimized for working with the EURUSD currency pair on the M30 timeframe. It is recommended to use an ECN/STP broker with low spread, low commission and fast execution. Signal monitoring Working currency pair/timeframe: EURUSD M30. Advantages never trades against the market; the higher the risk, the h
The indicator scans for TD Combo signals in multiple timeframes for the all markets filtered and shows the results on Dashboard. Key Features Dashboard can be used for all markets It can scan for signals on MN1, W1, D1, H4, H1, M30, M15 ,M5, M1 timeframes Parameters UseMarketWatch: Set true to copy all symbols available in market watch MarketWatchCount : Set the number of symbols that you want to copy from the market watch list. CustomSymbols: Enter the custom symbols that you want to be availa
Forex Play
Ivaylo Petkov
Forex Play EA is an automated Expert Advisor based on smart algorithm and some standard indicators like Bollinger Bands, Stand Deviation etc. Money management - automatic lot calculation based on your risk per trade or manually set; Broker SPY Module (Hidden Take Profit and Stop Loss); Spread and Slippage Protection; High Trading Frequency; Flexible input options to use on different currency pairs; This system uses no grid, no martingale, no arbitrage, no hedges; Parameters Distance from BB fo
指标就像婆婆,话多,话多,而且经常说得不恰当。 该指标除了为我们提供有关我随后列出的参数的进入信号外,还监控小时时间框架的趋势,OSMA 了解进入方向,RSI 感知任何超买或超卖情况,ATR 用于趋势的波动率和 ADX。 不建议新手使用该指标。 只有这些参数的人为判断,结合进场信号,才能使指标真正有效。 建议在合适的时间 (9.30-11 15.30-17 20-22 GMT+2) 在指数和主要外汇交易所使用它,时间范围为 5 分钟。 对于对所产生的信号缺乏成熟和严格判断的新手,不建议使用它。 该指标依赖于简单移动平均线的标准差,这些标准差在历史上构成了可能的关键水平,以在 SL 或 TP 中关闭订单。 开幕式完全基于:      (仅适用于外汇)检查基础货币对其他汇率的强度      相对于前一根蜡烛的收盘价,价格对我们有利      OSMA 参数是:      Max Risk in cash : 每笔交易的基础货币的最大风险      与...比较:仅适用于外汇。 比较WhatchList或整个平台的变化      等待关闭蜡烛:仅在前一根蜡烛收盘时
ATC AlgoZone Indicator
Ameur Boudenne
5 (2)
Algo Trading Indicaor  With this indicator , you’ll have zones and trends that hight probability the price will reverse from it. so will gives you all the help that you need  Why should you join us !?  1-This indicator is logical since it’s working in previous days movement , to predict the future movements. 2-Algo trading indicator will help you to draw trends which is special and are too strong than the basics trend , trends will change with the frame time that you work on . 3-We can
Destiny Master
Victor Adhitya
Your destiny is in your hand, This EA design to control your RISK PER TRADE so even you using the martingale system you can control your drawdown. Every failure of your entry will partial hedge with this ea, so the floating loss will reduce and the drawdown can be controlled. You need Broker with this requirement spesification : - Hedging Account (dont use Netting Account) - Big leverage  - NO SWAP  - NO COMMISION - NO Hidden Cost - Margin Hedge = 0 - Low spread  - Low slippage
该产品的买家也购买
Oni Scalper
Goh Cheng Wai
5 (2)
Dear Onis, This Indicator is used for   GBPUSD, US30 and GOLD on 1-Min Chart . For US30 , Depending on your broker, Minimum Lot Size will differ from 0.01 to 1.0 lots. My Current Account is trading at 1.0 lots at $1 per point . Please check with your Broker what's the Margin Required for your Minimum lot sizes before you trade on your Real account. I have Forward Tested the indicator for around 6 months before releasing it to the public. ( No Demo is available for the Indicator, Strategy
訂閱指標注意事項 此信號只支援電腦版MT4 不支援MT5、手機、平板 指標只顯示當日進場箭頭 非直播指標顯示歷史箭頭 (直播為展示用) 指標為交易輔助性質 非EA自動交易 無跟單功能 指標只標示進場位置 無出場(止盈)指示 進場止損點位設定30-50 PIPS 或是前高前低做為防守 止損不需拉太遠 紅色箭頭為多方進場訊號 綠色箭頭為空方進場訊號 撐阻力強度用箭頭大小表示 此指標適用於波段策略 不適合當沖策略盤整 多空反轉時不適用 指標載入後 右下角都會預設顯示盤整 載入指標一小時後 才會顯示多空 加入Youtube頻道會員 可參加每個月一次實體抽獎活動(台灣以外地區,獎品折現金用Paypal匯出) 每月抽獎時間為非農數據公布當週的週末盤勢分析(2100) 得獎者必須抽獎時在線上,逾期不候
这是最赚钱的指标。它的表现非常出色。无论市场上有什么兴趣,你都能看到。 几乎在所有情况下,它都只会给你一个长期的市场观点,但不要被愚弄,以为它是受事件约束的。不是这样的。它能找到市场上最大的利益所在,并将其展示给你。别忘了,最大的资金(利益)每天都不会在市场上出现。这是您没有遇到过的情况。月租金可能会给您一到两个信号,仅此而已。但当我们谈论大资金时,他们就是这样行事的。 如果您想了解更多,请点击这里。 这是最赚钱的指标。它的表现非常出色。无论市场上有什么兴趣,你都能看到。 几乎在所有情况下,它都只会给你一个长期的市场观点,但不要被愚弄,以为它是受事件约束的。不是这样的。它能找到市场上最大的利益所在,并将其展示给你。别忘了,最大的资金(利益)每天都不会在市场上出现。这是您没有遇到过的情况。月租金可能会给您一到两个信号,仅此而已。但当我们谈论大资金时,他们就是这样行事的。 如果您想了解更多,请点击这里。
Robot Choppiness
Diego Mauricio Padilla Mendez
3 (2)
Choppines 機器人作為指標載入到 MT4 指標資料夾中 建議使用5分鐘的蠟燭計時,建議的機器人到期時間為5分鐘。 機器人可設定為向 MT2、MX2、PRICEPRO 平台發送訊號。要發送訊號,您必須使用我們要使用的平台的連接器程式。 若要在連接器上安裝,請執行下列程序(隨附映像描述 MT2 平台連接器的配置):  1.- 在 MT4 平台上載入任何貨幣對 2.- 將蠟燭放在 M5 時間上 3.- 載入或拖曳 Robot-Chopiness.ex4 檔案到螢幕上開啟的貨幣對。 4.- 將MT2 連接器(MX2,或PRICEPRO,一次一個)載入到螢幕上,設定檔名稱、訊號名稱、買入緩衝區(0)、賣出緩衝區(1),設定機器人到期時間= 5 分鐘。 5.- 將此配置保存在模板中,以便模板將其自動加載到您要使用的所有貨幣對中。 波動機器人也可以在場外交易市場工作,您現在可以使用我們的指標來操作綜合指數
Automatic, live & interactive picture of all trendlines. Assign push, email and sound alerts to the lines of your choice and be informed about price rollback, breakout, rollback after breakout, number of rollbacks, line expiration by double breakout. Correct, drag or delete the lines and interactively tune the line system. https://youtu.be/EJUo9pYiHFA . Chart examples https: //www.mql5.com/en/users/efficientforex Price Interaction Events All events are effective immediately and only after on
The indicator displays the probable ( Support and resistance ) levels. The indicator draws horizontal and trend levels of support and resistance. The indicator settings: Trends - the mode for displaying trend lines or horizontal lines of support and resistance Yes - display trend lines only No - display horizontal lines only UseResource - use the resources built into the indicator. Yes - use the ZigZag indicator from the resources of the product. No - use a custom ZigZag indicator. HistoryBar -
The indicator of a Professional Trader is an arrow indicator for predicting the direction of price movement. I have been working on this indicator since 2014. You can use this indicator as your main indicator, use its entry signals, and use it as your only indicator to find entry points. About the product: Recommended TF [H4-D1-W1]   . The indicator predicts the direction of the next candle. Fits a variety of tools; Flexibility in settings for different instruments and intervals through the
THE GRAFF III
Antonin Skaryd
The [GRAFF] III manual trading system is based on multiple MetaTrader (MT4) indicators. Together, the entire PACK of GRAFF III indicators makes an advanced trading tool. The system consists of over 20 different custom-built indicators which have been carefully selected and tested in the long term to produce strong and efficient trading signals. The particular indicators are based on different mathematical formulas, so the entire system is calibrated to remove false signals from its own indicator
You can fins our other products from link : https://www.mql5.com/en/users/drbastem/seller   Also, you can ask all your questins from email : haskayafx@gmail.com or mobile : +90 530 867 5076 or @MehmetBastem    on telegram application This indicator is used to determine the trend. Standard Osma indicator is used. It has the indicator warning system: beep, e-mail and has three types of alerts, including messages to mobile phone. It shows the best performance on the chart of 5 minutes. When the
You can fins our other products from link : https://www.mql5.com/en/users/drbastem/seller   Also, you can ask all your questins from email : haskayafx@gmail.com or mobile : +90 530 867 5076 or @MehmetBastem    on telegram application This indicator is used to determine the trend. Standard Three Moving Average and ADX indicators are used. It has the indicator warning system (audio, e-mail) and three types of alerts, including messages to mobile phone. It shows the best performance on M5. When
This indicator is used to determine the trend. Standard Three Moving Average and ADX indicators are used. It has the indicator warning system (audio, e-mail) and three types of alerts, including messages to mobile phone. It shows the best performance on M5. When the trend value reaches the value set, the warning system is activated. This indicator works only with Forex symbols. Inputs SoundAlarm = true - Sound Alert Sendmail=true - Send an e-mail in case of a buy or sell signal Sendnotificatio
You can fins our other products from link : https://www.mql5.com/en/users/drbastem/seller   Also, you can ask all your questins from email : haskayafx@gmail.com or mobile : +90 530 867 5076 or @MehmetBastem    on telegram application This indicator is used to determine the trend. Standard MACD indicator is used. It has the indicator warning system: beep, e-mail and has three types of alerts, including messages to mobile phone. It shows the best performance on the chart of 5 minutes. When the
Smooth price for Monarch MT4
Konstantin Gruzdev
3.67 (3)
The Smooth Price technical indicator is used for plotting a smoothed line as close to the price of the financial instrument as possible, and serves to eliminate its noise components. The indicator is part of the Monarch trading system, but here it is presented as an independent technical analysis tool. The indicator is based on the cluster digital filter , which, unlike the ClusterSMA , is applied directly to the price time series. Smooth Price does not redraw (except the very last, zero bar) an
该指标提供了一种基于'回归通道工具'概念的强大市场分析方法。通过利用此工具,交易员可以在图表上对回归通道获得出色的控制,从而使他们能够做出更明智的交易决策。 '回归通道工具'是交易员工具箱中的一个强大工具。它旨在为价格趋势和潜在支撑和阻力水平提供有价值的见解。该工具特别适用于在趋势内部可视化修正波动,提供了对价格动态的综合视图。 以下是更详细地了解使用此指标的关键功能和优势: 通道水平和支撑/阻力: 该指标的主要优势之一是其能够生成作为动态支撑和阻力区域的通道水平。这些水平在确定潜在的入场和出场点方面至关重要,增强了交易策略的精确性。 修正波动水平: 通过启用修正波动水平,交易员可以在更大的趋势内识别潜在的修正。这个功能有助于识别回撤,并帮助交易员利用有利的价格波动。 直接控制: 该指标的控制面板允许无缝地操纵回归通道。交易员可以微调填充和射线选项等设置,提供符合其分析风格的通道定制视图。 更高时间框架分析: 为了获得更广泛的视角,该指标具有从更高时间框架加载数据的功能。这个功能可以帮助交易员评估不同时间尺度上的趋势和通道,促进对市场动态的更全面了解。 如何使用: 设置趋势线: 首先,
Green Wall Arrows
Daniel Luchinger
1 (1)
The Name Green Wall : Arrows hits a lot of TP, by changing the idea of non using SL as something bad, but instead use Small TP and a lot of free Margin and Patience. Use micro TP and a lot of Free Margin with this indicator on Forex. It also can be used with Binary Options. This strategy is intended to be traded Manually. This Indicator runs on Open Bar, arrows will delete when price are against it. The only Indicator Parameter is Alerts true/false, all the rest is included inside the code. Arro
Golden Monowave
Ahmed Mohamed Ali
Golden Monowave is monowave indicator, the monowave theory is one of Elliott wave approach and one of most complicate and accurate method. Golden Monowave can shortcut many major steps to identify and describe the monowave. It works on any timeframe and with any trading instrument, including currencies, indices, futures, etc. Input Parameters initial_Bars - set the initial number of bars to calculate. wave_color - select the color of the wave. label_color - select the color of labels. temp_lab
Ticks Size
Viktor Kolmakov
This indicator displays in a separate window the difference between the number of points which increased the price, and the number of points that decreased the price during the time interval specified in the settings. The time interval for calculation is expressed as the number of bars of the chart the indicator is attached to. This approach allows you to evaluate the movement direction (growth or fall) of the instrument's price, the strength of the movement and the size of the movement in point
NostradamusMT4
Andrey Spiridonov
1 (1)
NostradamusMT4 is a powerful indicator from the set of professional trader. The indicator is based on Andrei Spiridonov's original price calculation method (ESTIMATED PRICE) for the current candle price. Advantages The indicator does not redraw. It works on any timeframes. Works with any trading instruments. Perfectly suitable for scalping and trading binary options. Parameters Color - color of the ESTIMATED PRICE FUTURE line. How to work with the indicator The indicator forms the ESTIMATE
BinaryIndicator
Andrey Spiridonov
BinaryIndicator is a highly accurate indicator for trading binary options. It shows excellent results in scalping. This indicator is based in multifactor analysis of trend indicators, as well as confirmation oscillators, which in the end gives an increased accuracy of signals. Advantages of the indicator Increased accuracy of signals. Excellent results when trading binary options with a short expiration time from M30 to M1 . It works on any timeframes. Works with any trade symbols. Parameter
BinaryScalping
Andrey Spiridonov
BinaryScalping is a professional indicator for trading binary options and scalping. The algorithm of the indicator is based on the calculation of pivot points for each time period separately, the location of the price of the trading instrument relative to the pivot points is analyzed and the probability of a trading operation is calculated. The indicator has a built-in filter of trading signals based on the global trend. The indicator is installed in the usual way and works with any trading inst
This is the FXTraderariel PowerTrend . It compute a trendfollowing system based on it own algorithm. It gives you a buy or sell signal based on the trend. It based on the Supertrend, but our Version is not repainting. Furthermoore we added some Improvements and you can get an Arrow, Push or Alert when the trend changes. Depending on the settings it and trading style, it can be used for scalping or long-term trading . The indicator can be used on every time frame , but we advise to use it on H1
REX complete 3in1
Christophe Godart
This is the complete REX package. It consists of the lite, pro and ULTRA version.  Perfect for beginners and intermediates. REX complete is 100% non repaint. The strategy is based on a mix of different strategies, statistics, including pivot points, oscillators and patterns.  As the trading idea consists of a variety of some classic indicators like Momentum, Williams Percent Range, CCI, Force Index, WPR, DeMarker, CCI, RSI and Stochastic, it is clear that the fundamental indicators have being
BinaryUniversal
Andrey Spiridonov
BinaryUniversal is a signal indicator for binary options and Forex. In its work, the indicator uses a complex algorithm for generating signals. Before forming a signal, the indicator analyzes volatility, candlestick patterns, important support and resistance levels. The indicator has the ability to adjust the accuracy of the signals, which makes it possible to apply this indicator for both aggressive and conservative trading. The indicator is set in the usual way, it works on any time period and
Sweet Waffle
Christophe Godart
The arrows are calculated with: -     2 Parabolic  parameters -     2 ADX parameters -     4 Stochastic parameters We recommend to combine it with Parabolic, ZigZag or Elliot waves indicator. Always trade the trend! If you make sure to draw your trend lines and support/resistance zones you will just have to wait for the signal to appear. Take the trade. For Binary Options it is advisable to set the expiry time to 5-15 min in M1 chart. THIS INDICATOR IS ZERO REPAINT Best assets to trade: -
Let´s try to make some real money! Call me profit addicted. I thought why not try to make THE dream come reality. With discipline, a clear strategy and this indicator I focus on entering the perfect trades. This indicator is very easy to use as you will get perfect entry points for Put or Call trades. The arrows are calculated with: -     Momentum  parameters -     Candle stick patterns -     Fundamental Price action We recommend to combine it with Parabolic, ZigZag or Elliot waves indic
SystemPro
Andrey Spiridonov
SystemPro - a professional indicator, is a full-fledged, self-sufficient author's strategy for working in the Forex market. A unique algorithm for analyzing the foreign exchange market is based on the calculation of reference points for three different time periods. Thus, the indicator simultaneously analyzes the long-term, medium-term and short-term price behavior before issuing a signal. The indicator is set in the usual way and works with any trade symbols. Advantages of the indicator It i
Floating Nest
Dzmitry Chentsou
1. What is Floating Nest? This indicator is designed to automate the construction of decision zones (can act as support-resistance levels) according to the Floating Socket strategy. The same indicator allows you to significantly reduce the time when analyzing the behavior of prices in decision areas on historical data. It works on any currency pairs. Time frame: M1-H1. The NEST trading system (Nest) is notable for its simplicity and efficiency when trading currencies, stocks, indice
Dark Sniper
Dmitriy Kashevich
Dark Sniper pointer indicator.  Complete absence of redrawing   The percentage of correct indicator forecasts depends on your settings; the default is period 7 (performed better) The arrow indicates the direction of the next candle and the possible direction of the trend in the future.  Suitable for small timeframes m1 and m5  It is recommended to open transactions from 1 to 2 candles.  The signal appears on the current candle. Open a trade on the next one since the signal is being ge
Pisces TheProfitZone
Nuttawut Khiawkiri
Pisces TheProfitZone "Pisces TheProfitZone MT4 Indicator Powered byFxGangster" This indicator will calculate new support and resistant zone everyday, and that give us a trading zone such as thats telling us TP and SL, So it still telling us for where should the price will go reach? Fore Example. Uptrend : If Price can stay upper a Line and price close higher above a Line, then the price will continue go up to reach next Line. Downtrend : If Price can't pass to stay upper a Line and the pr
作者的更多信息
[V 1.00] MTF NRPA 5 移动平均 RTD 已发布! 非重绘箭头实时仪表板。 如果您正在寻找最好的移动平均线指标,那么您来对地方了。 通常人们会设置两条移动平均线,因为两条移动平均线的交点(交叉)将决定下一个价格趋势的方向。 如果快速移动平均线与慢速移动平均线相交且快 > 慢则趋势向上。 相反,如果快速移动平均线与慢速移动平均线相交且快 < 慢,则趋势向下。 两条均线的缺点是看不到长期趋势。 这就是我开发此交易工具的原因。 解释如下: 在这个交易工具中,我使用了五个移动平均线。 是的,五个! 默认情况下,我将 MA 1 和 MA 2 设置在较大的时间范围内,即 H1。 MA 1 和 MA 2 的交集意味着 H1 时间帧上有趋势变化。 然后 MA 3 和 MA 4 我在当前时间范围(小)上设置,例如,您在 M5 上打开图表。 MA 3 和 MA 4 的交叉点表示当前时间范围 (M5) 有趋势变化。 然后为了确认趋势运动,我在当前时间范围内设置了 MA 5。 这个交易工具有很多令人惊奇的东西: 您可以根据自己的喜好更改五个 MA 的时间范围。 您可以
在一个窗口中分析货币对的多个时间范围可能会让您感到困惑。 要分析多个时间范围,您需要可靠的指标。 其中之一是使用 9TF MACD 曲线。 我夜以继日地工作,以创建简单但可靠的代码,并在一个指标中涵盖所有九个时间范围。 让我们看一下该指标的一些优点: 彩色直方图。 每个时间范围内的曲线颜色各不相同。 指示 MACD 主线和信号线交叉的箭头。 (注意:忽略出现的最后一个箭头!) 临界水平线。 实时 9TF 仪表板监视器。 9TF 仪表板监视器计算非常准确,即使您从一个时间范围更改为另一个时间范围也是如此。 监控哪条曲线高于临界水平,哪条曲线低于临界水平。 监控曲线是否主要 MACD 高于信号 MACD,反之亦然。 监控曲线是否有主 MACD 和信号 MACD 之间的交叉。 监视当前信号与先前信号的移动。 在上升或下降的过程中。 (注意:这是剥头皮非常重要的功能!) 一个非常重要的趋势栏功能,用于发现长期趋势。 改变颜色的能力。 能够选择要显示的曲线。 能够选择要显示的直方图。 能够选择显示哪个箭头。 能够将 9TF 仪表板显示器放置在您想要的位置。 只需单击一下按钮
在一个窗口中分析货币对的多个时间范围可能会让您感到困惑。 要分析多个时间范围,您需要可靠的指标。 其中之一是使用 9TF STOCH RSI。 我夜以继日地工作,以创建简单但可靠的代码,并在一个指标中涵盖所有九个时间范围。 让我们看一下该指标的一些优点: 彩色直方图。 每个时间范围内的曲线颜色各不相同。 指示 STOCHASTIC 主线和信号线交叉的箭头。 (注意:忽略出现的最后一个箭头!) OBOS水平线。 实时 9TF 仪表板监视器。 9TF 仪表板监视器计算非常准确,即使您从一个时间范围更改为另一个时间范围也是如此。 监控哪条曲线高于超买水平,哪条曲线低于超卖水平。 监测主 STOCH 是否高于信号 STOCH 的曲线,反之亦然。 监控主 STOCH 和信号 STOCH 之间是否有交叉的曲线。 监视当前信号与先前信号的移动。 在上升或下降的过程中。 (注意:这是剥头皮非常重要的功能!) 监测 RSI 线的运动。 一个非常重要的趋势栏功能,用于发现长期趋势。 改变颜色的能力。 能够选择要显示的曲线。 能够选择要显示的直方图。 能够选择显示哪个箭头。 能够将 9
Analyzing multiple time frames of a currency pair in one window can make you confused. To analyze multiple time frames, you need reliable indicators. One of them is using 9TF RSI MA . I've been working day and night to create code that is simple but reliable and covers all nine time frames in just one indicator .  Let's look at some of the advantages of this indicator: Colorful histogram . The color of the curve in each timeframe is different from one another.  Arrows indicating the crossing of
Analyzing multiple time frames of a currency pair in one window can make you confused. To analyze multiple time frames, you need reliable indicators. One of them is using 9TF MACD Limited Bar . I've been working day and night to create code that is simple but reliable and covers all nine time frames in just one indicator .  Attention! When first installed, the indicator does not look intact. Changing the timeframe will solve the problem. Let's look at some of the advantages of this indicator: C
Analyzing multiple time frames of a currency pair in one window can make you confused. To analyze multiple time frames, you need reliable indicators. One of them is using 9TF STOCH RSI LIMITED BAR . I've been working day and night to create code that is simple but reliable and covers all nine time frames in just one indicator .  Attention! When first installed, the indicator does not look intact. Changing the timeframe will solve the problem. Let's look at some of the advantages of this indicat
在一个窗口中分析货币对的多个时间范围可能会让您感到困惑。 要分析多个时间范围,您需要可靠的指标。 其中之一是使用 9TF Double RSI Double MA。 我夜以继日地工作,以创建简单但可靠的代码,并在一个指标中涵盖所有九个时间范围。 让我们看一下该指标的一些优点: 双 RSI,即 RSI 更快和 RSI 更慢。 双 MA,即更快的 MA 和更慢的 MA。 10 配色方案。 每个时间范围内的曲线颜色各不相同。 RSI 的 OBOS 水平线。 实时 9TF 仪表板监视器。 9TF 仪表板监视器计算非常准确,即使您从一个时间范围更改为另一个时间范围也是如此。 监控哪条 RSI 曲线高于超买水平,哪条低于超卖水平。 监控曲线是否 MA 快线高于 MA 慢线,反之亦然。 监控曲线是否有 MA 快线和 MA 慢线之间的交叉。 监视当前信号与先前信号的移动。 在上升或下降的过程中。 (注意:这是剥头皮非常重要的功能!) 一个非常重要的趋势栏功能,用于发现长期趋势。 改变颜色的能力。 能够选择要显示的曲线。 能够仅显示 RSI、仅 MA、仅显示仪表板等。 能够将 9T
在一个窗口中分析货币对的多个时间范围可能会让您感到困惑。 要分析多个时间范围,您需要可靠的指标。 其中之一是使用 9TF Double CCI Double MA。 我夜以继日地工作,以创建简单但可靠的代码,并在一个指标中涵盖所有九个时间范围。 让我们看一下该指标的一些优点: 双 CCI,即 CCI 更快和 CCI 更慢。 双 MA,即更快的 MA 和更慢的 MA。 10 配色方案。 每个时间范围内的曲线颜色各不相同。 CCI 的 OBOS 水平线。 实时 9TF 仪表板监视器。 9TF 仪表板监视器计算非常准确,即使您从一个时间范围更改为另一个时间范围也是如此。 监控哪条 CCI 曲线高于超买水平,哪条低于超卖水平。 监控曲线是否 MA 快线高于 MA 慢线,反之亦然。 监控曲线是否有 MA 快线和 MA 慢线之间的交叉。 监视当前信号与先前信号的移动。 在上升或下降的过程中。 (注意:这是剥头皮非常重要的功能!) 一个非常重要的趋势栏功能,用于发现长期趋势。 改变颜色的能力。 能够选择要显示的曲线。 能够仅显示 CCI、仅 MA、仅显示仪表板等。 能够将 9T
可以使用准确的 CCI 指标。 仪表板趋势栏智能级别 9TF 双 CCI。 双 CCI,即快速 CCI 和慢速 CCI 为什么需要第二个 CCI? 使用额外的指标将使我们在实时交易中更有说服力 9TF 快速 CCI 曲线 9TF 慢速 CCI 曲线 9TF实时CCI角度 9TF实时CCI值 9TF 实时 CCI 方向/相位 9TF 趋势栏 计算趋势条的新算法 开/关按钮。 只需单击一下即可显示/隐藏指标非常有用 实时 9TF 仪表板监视器 只能显示趋势栏 只能显示 CCI 曲线 只能显示仪表板 能够选择要显示的 CCI 曲线 能够选择趋势的箭头类型 能够选择 obos 线条样式 能够显示/隐藏图例 能够增加/减少栏的数量 能够选择配色方案级别 能够选择多达 10 种仪表板趋势栏配色方案 能够改变 CCI 曲线的颜色 该指标经历了一系列的试验。 编程代码是用心编写的。 使用最好的 DTSL 9TF 双 CCI 交易指标进行自信的输入。 立即获取并像专业人士一样进行交易。 谢谢你。
提供准确的 RSI 指标。 仪表板趋势栏智能级别 9TF 双 RSI。 双 RSI,即快速 RSI 和慢速 RSI 为什么需要第二个 RSI? 使用额外的指标将使我们在实时交易中更有说服力 9TF 快速 RSI 曲线 9TF 慢速 RSI 曲线 9TF实时RSI角度 9TF实时RSI值 9TF 实时 RSI 方向/相位 9TF 趋势栏 计算趋势条的新算法 开/关按钮。 只需单击一下即可显示/隐藏指标非常有用 实时 9TF 仪表板监视器 只能显示趋势栏 只能显示 RSI 曲线 只能显示仪表板 能够选择要显示的 RSI 曲线 能够选择趋势的箭头类型 能够选择 obos 线条样式 能够显示/隐藏图例 能够增加/减少栏的数量 能够选择配色方案级别 能够选择多达 10 种仪表板趋势栏配色方案 能够改变 RSI 曲线的颜色 该指标经历了一系列的试验。 编程代码是用心编写的。 使用最好的 DTSL 9TF 双 RSI 交易指标自信地入场。 立即获取并像专业人士一样进行交易。 谢谢你。
提供准确的 MACD 指标。 仪表盘趋势栏智能级别 9TF 双 MACD。 双 MACD,即快速 (MACD 1) 和慢速 (MACD 2) 为什么需要第二个 MACD? 使用额外的指标将使我们在实时交易中更有说服力 9TF 快速 MACD 1 曲线 9TF 慢 MACD 2 曲线 9TF实时MACD角度 9TF实时MACD值 9TF 实时 MACD 方向提供准确的 MACD 指标。 仪表盘趋势栏智能级别 9TF 双 MACD。 双 MACD,即快速 (MACD 1) 和慢速 (MACD 2) 为什么需要第二个 MACD? 使用额外的指标将使我们在实时交易中更有说服力 9TF 快速 MACD 1 曲线 9TF 慢 MACD 2 曲线 9TF实时MACD角度 9TF实时MACD值 9TF实时MACD方向/相位 9TF 趋势栏 计算趋势条的新算法 开/关按钮。 只需单击一下即可显示/隐藏指标非常有用 实时 9TF 仪表板监视器 只能显示趋势栏 只能显示 MACD 曲线 只能显示仪表板 能够选择要显示的 MACD 曲线 能够选择趋势的箭头类型 能够选择 obos 线条样式 能够显示
提供准确的随机指标。 仪表板趋势栏智能级别 9TF 双随机。 双随机,即快速随机和慢速随机 为什么需要第二个随机指标? 使用额外的指标将使我们在实时交易中更有说服力 9TF 快速随机曲线 9TF 慢速随机曲线 9TF实时随机角度 9TF实时随机值 9TF 实时随机方向/相位 9TF 趋势栏 计算趋势条的新算法 开/关按钮。 只需单击一下即可显示/隐藏指标非常有用 实时 9TF 仪表板监视器 只能显示趋势栏 只能显示随机曲线 只能显示仪表板 能够选择要显示的随机曲线 能够选择趋势的箭头类型 能够选择 obos 线条样式 能够显示/隐藏图例 能够增加/减少栏的数量 能够选择配色方案级别 能够选择多达 10 种仪表板趋势栏配色方案 能够改变随机曲线的颜色 该指标经历了一系列的试验。 编程代码是用心编写的。 使用最好的 DTSL 9TF 双随机交易指标进行自信的入场。 立即获取并像专业人士一样进行交易。 谢谢你。
如果您经常因为只使用一种指标而亏损交易,那么请尝试此交易工具。 该交易工具使用多个指标。 我经常观察只使用 RSI 指标的交易者。 很多时候,市场超卖但仍然下跌,或者市场超买但仍然上涨。 因此,您需要使用多个指标。 隆重推出新版本 V 3.40 MTF PPAAF:多时间框架精确价格行为箭头过滤。 该交易工具使用各种指标来加强市场走势的方向。 该交易工具中使用的第一个指标是双随机指标。 在这里,我使用两种随机指标,即快速随机指标和慢速随机指标。 在快速随机指标中,有一条快速随机指标主线和一条快速随机指标信号线。 同样,在慢随机指标中,有一条慢随机指标主线和一条慢随机指标信号线。 主线和信号线的交叉/交叉将形成向上和向下箭头。 第二个指标是Double RSI,即快速RSI和慢速RSI。 两者相交将形成一个向上和向下的箭头。 第三个指标是Double CCI,即快速CCI和慢速CCI。 两者相交将形成一个向上和向下的箭头。 第四个指标是双MACD。 与双随机指标类似,这里有快速 MACD 和慢速 MACD。 在快速 MACD 中,有一条快速 MACD 主线和一条快速 M
[V 1.00] MTF NRPA 5 RSI RTD 已发布! 非重绘箭头实时仪表板。 如果您厌倦了使用各种 RSI 指标但发现它们不准确,那么试试这个工具。 通常人们只设置 1 个 RSI 来确定一个时间范围内的 OBOS 水平。 坏消息是您无法同时看到不同时间范围内的 OBOS 水平和趋势。 这就是我开发此交易工具的原因。 解释如下: 在这个交易工具上,我使用了五个 RSI。 是的,五个! 默认情况下,我在较大的时间范围内设置 RSI 1 和 RSI 2,即 M30。 RSI 1 和 RSI 2 的交集意味着 M30 时间框架上有趋势变化。 然后我在当前(小)时间范围内设置 RSI 3 和 RSI 4,例如您在 M5 上打开图表。 RSI 3 和 RSI 4 的交集意味着当前时间帧 (M5) 有趋势变化。 然后为了确保趋势运动,我在更高的时间框架 (H1) 上设置了 RSI 5。 当 RSI 5 越过 50 水平(您可以设置时间范围和 OBOS 水平)时,箭头将出现。 这个交易工具有很多令人惊奇的东西: 您可以根据自己的意愿更改五个 RSI 时间范围。
Introducing the advanced trading tools of 2023. MTF PPAAF Model S. This is sub window version of my best trading tool : MTF Precise Price Action Arrow Filtered.  Click here to learn more about MTF PPAAF . This trading tool is equipped with various powerful features : MTF = Multi Time Frame = Time Frame can be changed. On/off button. Non Repaint Arrows.  Customizable parameter, color etc.  Can show all time frame (ATF) crossover arrows of fast stochastic main line & fast stochastic signal line (
If you are curious about the position of the stochastic, RSI, CCI curve, whether it is at the OBOS level or not, then this trading tool is for you. Introducing the advanced trading tools of 2024. ATF Trend Following Trend Bar OBOS. This indicator is similar to MTF PPAAF Model S but have two layers.  Click here to learn more about MTF PPAAFS . This trading tool is equipped with various powerful features : MTF = Multi Time Frame = Time Frame can be changed. On/off button. Customizable parameter,
使用此交易工具,您可以同时扫描 15 个市场。 介绍新的交易指标 2024: ️ 仪表板多货币多时间框架随机。 我创建这个交易工具至少有两个原因: 首先,我厌倦了只观察一个市场。 其次,我不想失去进入另一个市场的时机。 这就是为什么我想同时了解其他市场状况。 因此,我需要一台可以同时扫描多个市场状况的扫描仪。 我经常寻找随机主线>(或<=)随机信号线从M1到H4(或只是M1到M30)的市场。 如果您同意我的分析,那么这就是您一直在寻找的交易指标。 不要错过市场状况满足上述要求的时刻。 这是一个随机扫描仪或仪表板,具有许多出色的功能: 可显示随机主线数据 可显示随机信号线数据 可以显示随机主线和信号线的位置(信号线上方主线或信号线下方主线) 可以显示随机主线和信号线的数据水平(看涨、看跌、趋势向上、趋势向下、超买但仍向上、超卖但仍向下) 可显示从M1到MN1的实时数据 可显示15种货币对的数据(多币种外汇/商品/加密货币/股票) 可定制参数 可定制颜色 OBOS 级别 漂亮的20仪表板配色方案 配备开/关货币对转换器 配备蜡烛高时间框架 配
使用此交易工具,您可以同時掃描 15 個市場。 介紹新的交易指標 2024: ️ 儀表板多貨幣多時間框架雙 CCI。 我創建這個交易工具至少有兩個原因: 首先,我厭倦了只觀察一個市場。 其次,我不想失去進入另一個市場的機會。 這就是為什麼我想同時了解其他市場狀況。 因此,我需要一台可以同時掃描多個市場狀況的掃描器。 我經常尋找快速 CCI 線 >(或 <=)慢速 CCI 線從 M1 到 H4(或只是 M1 到 M30)的市場。 如果您同意我的分析,那麼這就是您一直在尋找的交易指標。 不要錯過市場狀況滿足上述要求的時刻。 這是一個隨機掃描器或儀表板,具有許多出色的功能: 可顯示快速CCI線數據 可顯示慢速CCI線數據 可顯示快CCI線和慢CCI線的位置(快線在慢線上方或快線在慢線下方) 可顯示快速CCI線和慢速CCI線的數據水準(看漲、看跌、趨勢向上、趨勢向下、超買但仍向上、超賣但仍向下) 可顯示從M1到MN1的即時數據 可顯示15種貨幣對的資料(多幣種外匯/商品/加密貨幣/股票) 可自訂參數 可自訂顏色 OBOS 級別 漂亮的20儀表板配
使用此交易工具,您可以同时扫描 15 个市场。 介绍新的交易指标 2024: ️ 仪表板多货币多时间框架双 RSI。 我创建这个交易工具至少有两个原因: 首先,我厌倦了只观察一个市场。 其次,我不想失去进入另一个市场的机会。 这就是为什么我想同时了解其他市场状况。 因此,我需要一台可以同时扫描多个市场状况的扫描仪。 我经常寻找快速 RSI 线 >(或 <=)慢速 RSI 线从 M1 到 H4(或只是 M1 到 M30)的市场。 我还经常寻找从 M1 到 M30 超卖/超买的市场。 如果您同意我的分析,那么这就是您一直在寻找的交易指标。 不要错过市场状况满足上述要求的时刻。 这是一个随机扫描仪或仪表板,具有许多出色的功能: 可以显示快速RSI线的数据 可以显示慢速RSI线的数据 可以显示快速RSI线和慢速RSI线的位置(快线在慢线上方或快线在慢线下方) 可以显示快速RSI线和慢速RSI线的数据水平(看涨、看跌、趋势向上、趋势向下、超买但仍向上和超卖但仍向下) 可显示从M1到MN1的实时数据 可显示15种货币对的数据(多币种外汇/商品/加
筛选:
无评论
回复评论
版本 1.60 2024.09.20
In this new Version V 1.60 :
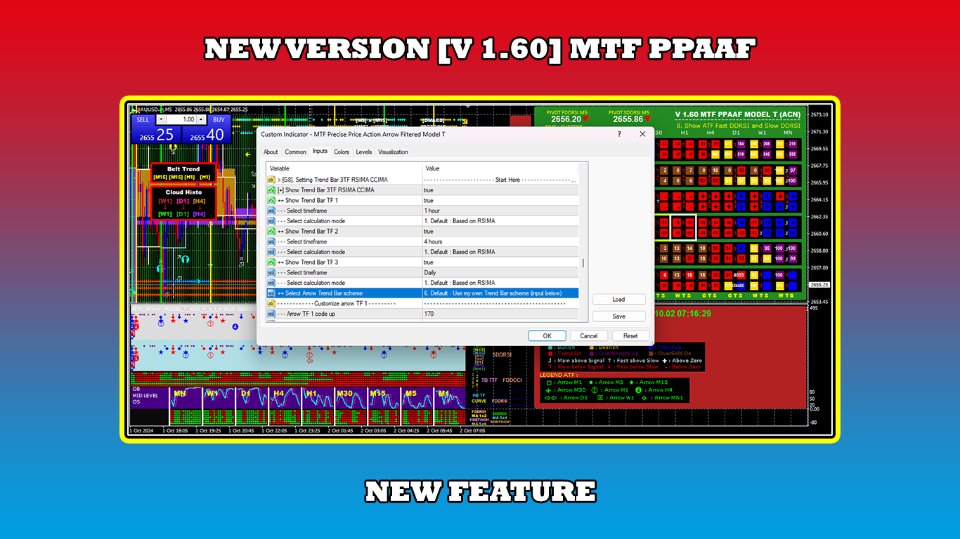
- Adding Dual Pivot ATF display type
- Replay system applicable to dual pivot ATF
- Adding Trend Bar 3TF RSIMA CCIMA arrows scheme
版本 1.50 2024.08.26
In this new Version V 1.50 :
- Adding Dual Double CCI
- Adding DDCCI calculation mode (fast/slow)
- Adding Mode : Show ATF RSIMA & CCIMA
版本 1.40 2024.08.13
In this new Version V 1.40 :
- Deconstruct from the beginning
- Adding CCIMA indicator
- Adding triple MTF cloud histo
- Adding triple MTF confluence multi mode
- Adding trend bar 3TF RSIMA/CCIMA
- Adding dual pivot all time frame
- Adding color level scheme
- Adding mode 24 : Show ATF Fast DMACD and Slow DMACD
- Adding mode 25 : Show ATF RSIMA and CCIMA
- Optimizing the loading time
版本 1.30 2024.06.17
In this new Version V 1.30 :
- Adding wait to buy and wait to sell trading in the zone feature (this is great feature!)
- Adding location of confluence arrows
- Adding cloud histogram calculation mode
版本 1.20 2024.06.12
In this new Version V 1.20 :
- Changing the trend bar 5TF to 7TF
- Adding angle value feature of four MA
版本 1.10 2024.05.28
In this new Version V 1.10 :
- Deconstruct from beginning
- Adding Slow DDRSI
- Adding 23 Mode
- Adding Layer 1 & Layer 2
- Adding Trend Bar 5TF Multi Mode
- Adding Dual MTF Belt Trend
- Adding Dual MTF Cloud Histo
- Adding Confluence MTF Multi Mode
- Fixing TSPI
- Fixing Candle HTF
- Fixing Trading in The Zone