• Aperçu
  • Avis
  • Commentaires
  • Nouveautés

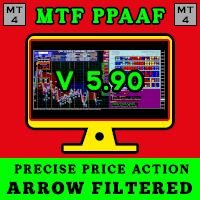
MTF Precise Price Action Arrow Filtered Model T

Bonjour les commerçants.

Présentation de mon meilleur outil de trading.


FIM PPAAF Modèle T.

Flèche d'action de prix précise sur plusieurs délais filtrée Modèle T. 

Cet outil de trading est mon meilleur travail après des années de création de divers outils de trading.

Pourquoi cet outil de trading est-il le meilleur et le plus fiable ? 

1. Cet outil utilise 6 indicateurs : 

🔹Double CCI = CCI rapide x CCI lent
🔹Double stochastique = stochastique rapide (ligne principale stochastique rapide x ligne de signal stochastique rapide) et stochastique lente (ligne principale stochastique lente x ligne de signal stochastique lente) 
🔹Dual MACD = MACD rapide (ligne principale MACD rapide x ligne de signal MACD rapide) et MACD lent (ligne principale MACD lente x ligne de signal MACD lente)
🔹Six moyennes mobiles = MA 1 x MA 2, MA 3 x MA 4 et MA 5 x MA 6
🔹Dual Double RSI = DRSI rapide (ligne principale DRSI rapide x ligne de signal DRSI rapide) et DRSI lent (ligne principale DRSI lente x ligne de signal DRSI lente)
🔹RSIMA = RSI x MA

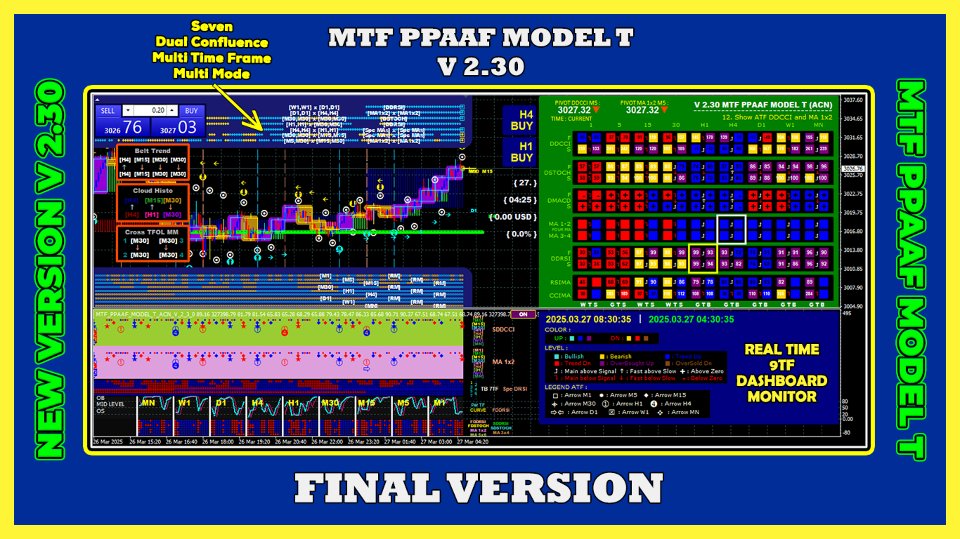
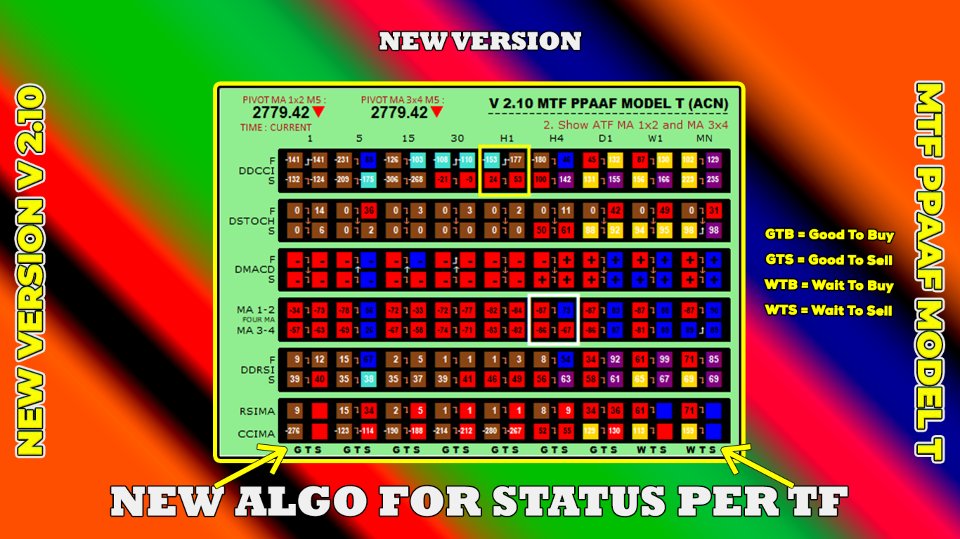
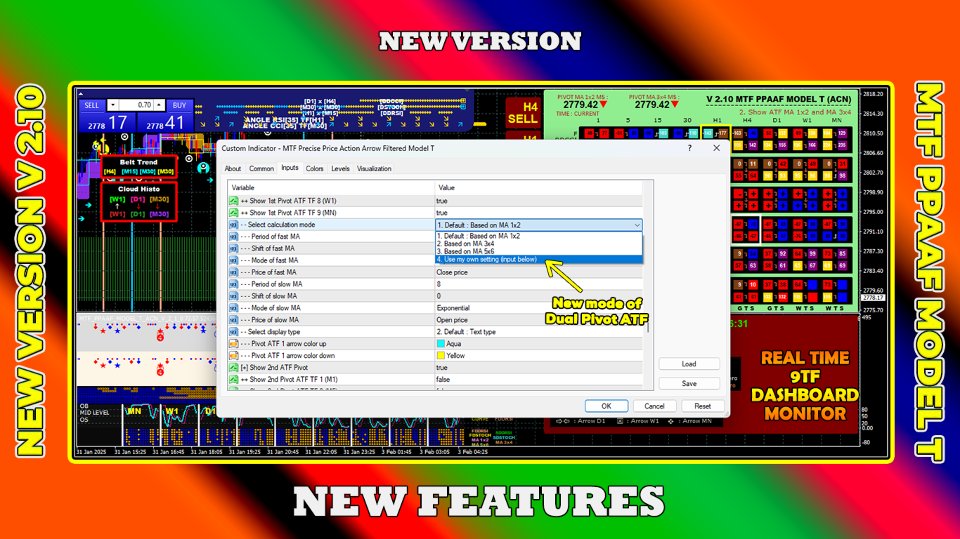
2. Moniteur de tableau de bord 9TF en temps réel (premier tableau de bord).


Ce tableau de bord vous donnera des informations en temps réel sur les données des 6 indicateurs ci-dessus. 
La ligne principale est-elle au-dessus ou en dessous de la ligne de signal. 
Est-ce que cela augmente positivement ou diminue négativement.
Est-ce au niveau OBOS ou non. 
Il est facile de surveiller la structure du marché sur des délais plus longs tout en négociant sur des délais plus courts. 

3. Le premier tableau de bord est doté de diverses fonctionnalités :

🔹Il existe 20 combinaisons de couleurs disponibles. Si vous vous ennuyez, vous pouvez le remplacer facilement.
🔹Heure actuelle de l'ordinateur local et heure du courtier.
🔹Valeur pivot.
🔹Système de relecture. 
🔹TSPI. 

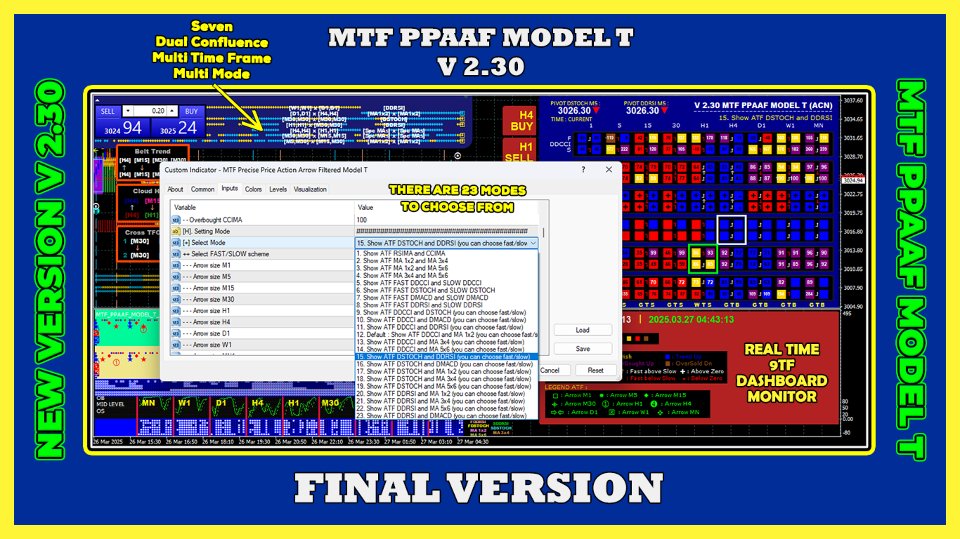
4. 23 modes au choix.

🔹Mode 1 : Vous pouvez afficher les flèches de croisement ATF de MA 1x2 et MA 3x4
🔹Mode 2 : Vous pouvez afficher les flèches de croisement ATF de FAST DSTOCH et FAST DDRSI
🔹Mode 3 : Vous pouvez afficher les flèches de croisement ATF de FAST DSTOCH et SLOW DDRSI
🔹Mode 4 : Vous pouvez afficher les flèches de croisement ATF de SLOW DSTOCH et FAST DDRSI
🔹Mode 5 : Vous pouvez afficher les flèches de croisement ATF de SLOW DSTOCH et SLOW DDRSI
🔹Mode 6 : Vous pouvez afficher les flèches de croisement ATF de FAST DSTOCH et SLOW DSTOCH
🔹Mode 7 : Vous pouvez afficher les flèches de croisement ATF de FAST DDRSI et SLOW DDRSI
🔹Mode 8 : Vous pouvez afficher les flèches de croisement ATF de FAST DSTOCH et MA 1x2
🔹Mode 9 : Vous pouvez afficher les flèches de croisement ATF de FAST DSTOCH et MA 3x4
🔹Mode 10 : Vous pouvez afficher les flèches de croisement ATF de SLOW DSTOCH et MA 1x2
🔹Mode 11 : Vous pouvez afficher les flèches de croisement ATF de SLOW DSTOCH et MA 3x4
🔹Mode 12 : Vous pouvez afficher les flèches de croisement ATF de FAST DDRSI et MA 1x2
🔹Mode 13 : Vous pouvez afficher les flèches de croisement ATF de FAST DDRSI et MA 3x4
🔹Mode 14 : Vous pouvez afficher les flèches de croisement ATF de SLOW DDRSI et MA 1x2
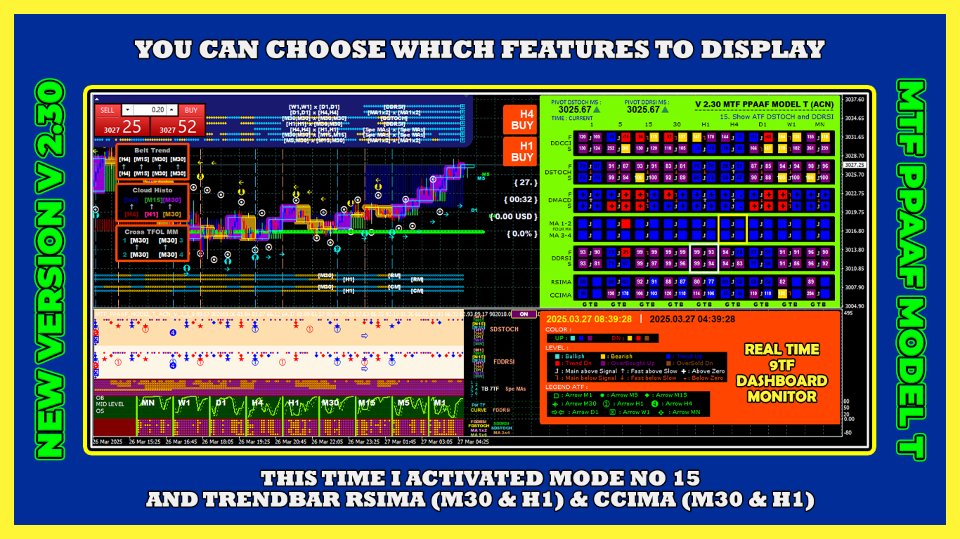
🔹Mode 15 : Vous pouvez afficher les flèches de croisement ATF de SLOW DDRSI et MA 3x4
🔹Mode 16 : Vous pouvez afficher les flèches de croisement ATF de DCCI et FAST DSTOCH
🔹Mode 17 : Vous pouvez afficher les flèches de croisement ATF de DCCI et SLOW DSTOCH
🔹Mode 18 : Vous pouvez afficher les flèches de croisement ATF de DCCI et FAST DDRSI
🔹Mode 19 : Vous pouvez afficher les flèches de croisement ATF de DCCI et SLOW DDRSI
🔹Mode 20 : Vous pouvez afficher les flèches de croisement ATF de DCCI et FAST DMACD
🔹Mode 21 : Vous pouvez afficher les flèches de croisement ATF de DCCI et SLOW DMACD
🔹Mode 22 : Vous pouvez afficher les flèches de croisement ATF de MA 1x2 et MA 5x6
🔹Mode 23 : Vous pouvez afficher les flèches de croisement ATF de MA 3x4 et MA 5x6

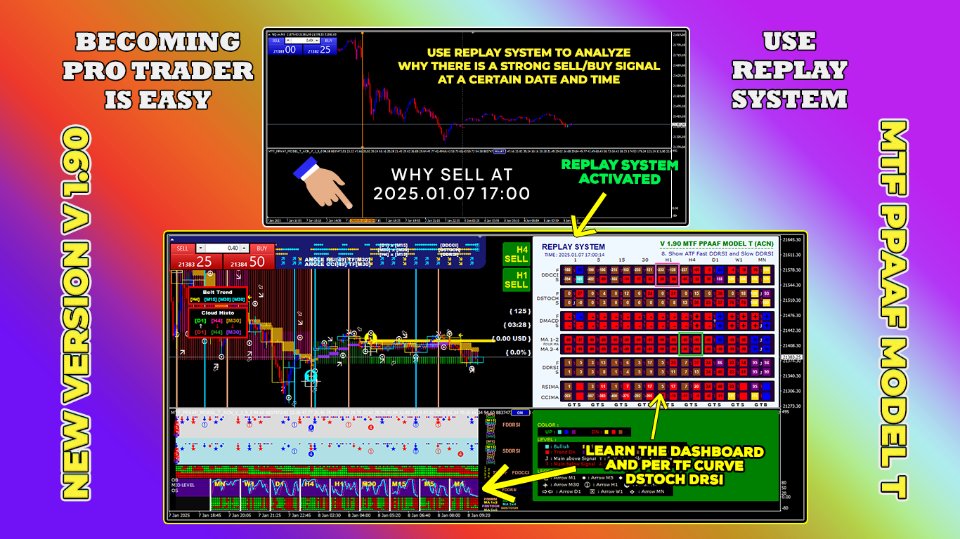
5. Système de relecture.

Cette fonctionnalité est désormais applicable non seulement sur le premier tableau de bord mais également sur la courbe Per TF Stoch DRSI. 
C'est vraiment génial.
Grâce à cette fonctionnalité, vous pouvez remonter le temps à une date et une heure spécifiques. 
Il est facile d'analyser pourquoi il y a une forte vente il y a trois jours à une date et une heure spécifiques. 

6. TSPI = Informations sur les bénéfices sur l'étalement temporel. 

Cette fonctionnalité vous donnera des données réelles sur le temps, le spread et les profits/pertes lors du trading en direct.

7. Heure locale actuelle de l'ordinateur et heure du courtier.

Cette fonctionnalité vous indiquera l'heure réelle de votre ordinateur et celle de votre courtier.

8. Le deuxième tableau de bord.

🔹 11 combinaisons de couleurs disponibles

🔹 Couche 1, couche 2

🔹 Barre de tendance 5TF Multi Mode

🔹 Double courbe MTF

🔹 Par courbe TF Stoch DRSI

🔹 Barre de tendance par TF filtrée par MA 1x2, MA 3x4 et MA 5x6


9. La couche 1 et la couche 2.

La surveillance de toutes les flèches de croisement de périodes (ATF) est très importante. 
C'est pourquoi cet outil est équipé de deux couches. 
Les premières flèches de croisement ATF se situent au niveau de la couche 1.
Tandis que les deuxièmes flèches de croisement ATF se situent à la couche 2.

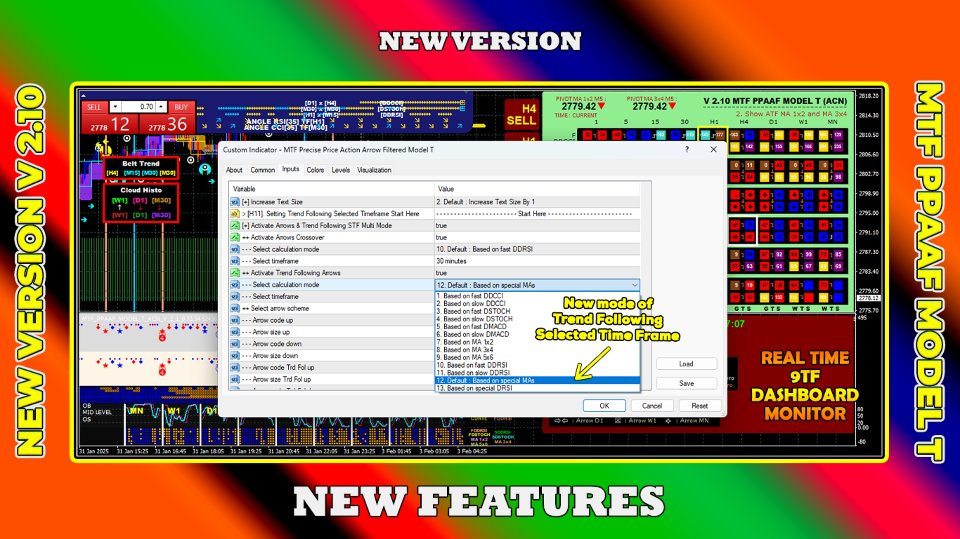
10. Barre de tendance, cinq modes multi-périodes.

🔹Mode 1 : Basé sur DCCI
🔹Mode 2 : Basé sur DSTOCH
🔹Mode 3 : Basé sur DMACD
🔹Mode 4 : Basé sur DRSI
🔹Mode 5 : Basé sur MA1x2
🔹Mode 6 : Basé sur MA3x4
🔹Mode 7 : Basé sur MA5x6
Pour les délais, j'aime utiliser M5, M15, M30, H1 et H4.
Lorsque les barres de tendance 5TF affichent toutes la même couleur de M5 à H4, il y a alors un signal d'achat/vente fort.

11. Selon la courbe TF Stoch DRSI.

C'est vraiment une bonne fonctionnalité pour surveiller visuellement.
Vous pouvez voir en direct si le Stoch DRSI est toujours à la hausse ou s'il est passé de M1 à MN. 
Avec cette fonctionnalité, nous connaissons la bonne heure d’entrée. 
Vous pouvez également appliquer le système de relecture à la courbe Per TF Stoch DRSI. 
C'est une fonctionnalité intéressante !
Vous pouvez également voir la barre de tendance par TF de :
🔹DRSI 1
🔹DRSI2
🔹MA 1x2
🔹MA 3x4
🔹STOCK 1
🔹STOCH 2

🔹MA 5x6

12. Courbe DRSI MTF double Stoch.


En utilisant cette fonctionnalité, vous pouvez choisir d'activer la courbe MTF du double stochastique et du double double RSI. 

Le paramètre Dual DRSI fast M5 et slow M15 est activé par défaut. 


13. Dans la fenêtre graphique.


🔹 Tendance de la ceinture double MTF


🔹 Confluence MTF Multi Mode


🔹 Histogramme cloud double MTF


14. Tendance de la ceinture double MTF.


La tendance de la ceinture est essentiellement basée sur le croisement de deux moyennes mobiles. 

Le paramètre, le délai, la flèche et la couleur sont personnalisables. 


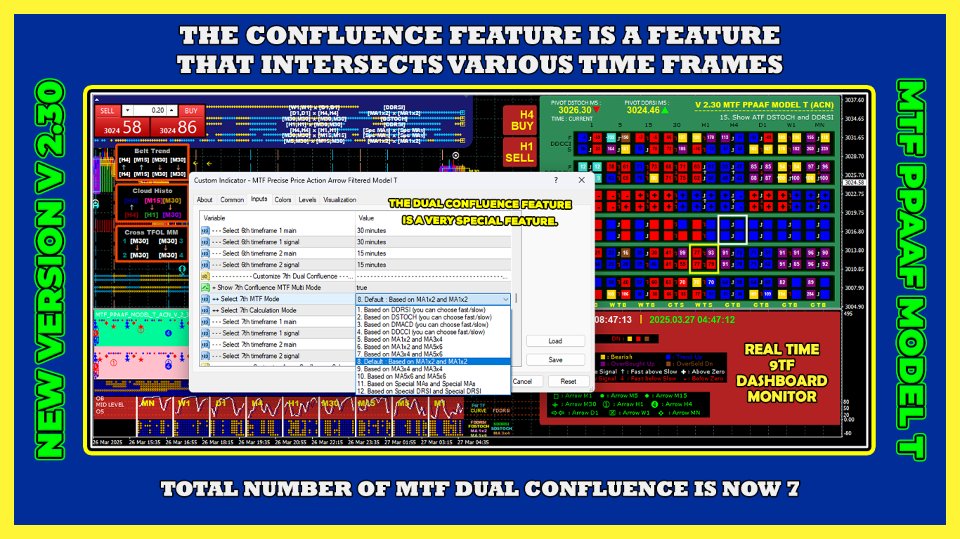
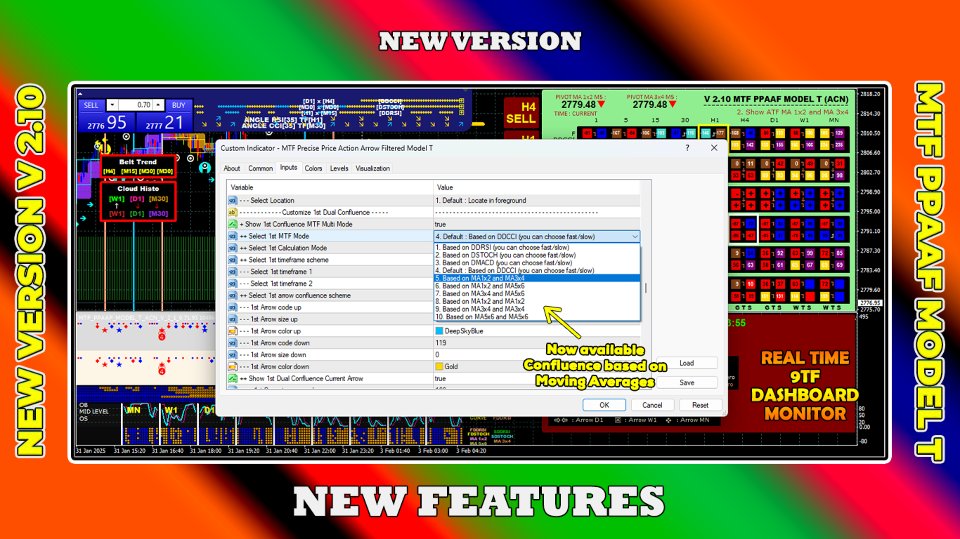
15. Confluence MTF Mode Multi.


Confluence signifie que s'il y a une intersection de TF 1 et TF 2, une flèche apparaîtra. 

Pour être clair, si TF 1 vers le bas et TF 2 vers le bas, alors la flèche vers le bas apparaîtra. 

De même, si TF 1 vers le haut et TF 2 vers le haut, une flèche vers le haut apparaîtra.

🔹Mode 1 : Basé sur Dual Double RSI

🔹Mode 2 : Basé sur le double stochastique

🔹Mode 3 : Basé sur Dual MACD

Et il y a une confluence de lignes verticales pour rendre l'inspection beaucoup plus claire. 


16. Double historique de cloud MTF.


L'historique des nuages est également essentiellement basé sur le croisement de deux moyennes mobiles. 

Le paramètre, la période et la couleur de l'historique sont personnalisables. 


17. Délai élevé de la bougie.


Il est facile de surveiller la structure du marché sur une période plus longue tout en ouvrant le graphique sur une période plus courte.

Par défaut, la bougie HTF est définie sur H1. 


18. Commerce dans la zone (TITZ).


🔹Lignes verticales TITZ basées sur MA3 x MA4.

🔹Lignes horizontales TITZ basées sur MA1 x MA2.

🔹 Valeur pivot des lignes horizontales TITZ basées sur MA1 x MA2.

🔹Achetez Vendez le statut TITZ basé sur MA3 x MA4.

Le paramètre, le délai et la couleur sont personnalisables. 


Profitez de la promotion d'aujourd'hui. Je devrais vendre ce produit sophistiqué issu d'années de recherche au prix de 2 500 $.


+ Des sessions Zoom sont disponibles pour les acheteurs de ce produit.


Téléchargez maintenant et commencez à gagner de l'argent !


Merci.

Produits recommandés
PTW NON REPAINT TRADING SYSTEM + HISTOGRAM Non-Repainting ,   Non-Redrawing   and   Non-Lagging  Trading System. Does the following: - Gives Accurate Entry and Exit Points - Scalping, Day and Swing Trading  - 95% Accuracy  - Targets, where to take profits. - Shows Trends, Support and resistance levels - Works on All Brokers - Works on All Currencies, CFDs and Stocks - It does not place trades for you, it only shows you what trades to place. - It works on All Timeframes - It is for Trend or ra
Reversal Overlap Bot is an automated trading strategy. No technical indicators are used in the work. At the beginning of trading, the first order is placed in a certain direction (at your option). When you open a new candle, this order is closed if it is in profit. Otherwise, the next order opens in the opposite direction. Orders are closed when profit is reached. If there are unprofitable orders on the chart, the robot will close one of them. When closing loss-making orders, the profit covers t
This trading expert advisors is an clone & upgrade of  "EA Rough Duster ", also trades best on GBPNZD minute 5 timeframe. Maintains a constant account growth and runs best on low spread and commission based accounts. Uses Martingale & perfect hedging to recover unprofitable positions ensuring no loss. Its consistent profit curves,low DrawDowns & risk proves the record for itself in reliability and consistency plus its unique market analysis ensures quick extraction of profits by scalping the mar
FTC Neuro
Aliaksandr Ausiyevich
Bienvenue dans le monde des solutions commerciales innovantes! Nous présentons à votre attention notre conseiller commercial avancé FTC Neuro , travaillant sur la base des statistiques macroéconomiques actuelles et des calculs de neuroset modernes. En analysant la situation du marché à l'aide d'algorithmes complexes, le conseiller reconnaît les modèles cachés de l'information économique à l'aide d'algorithmes avancés d'intelligence artificielle. Il vous offre l'expérience de trading la plus pro
Kilimanjaro EA
Botond Ratonyi
5 (1)
Check out my youtube channel about forex trading robots:  https://www.youtube.com/channel/UCL_p6fuQtNkg-1rRY69t5Ig Message me on telegram if you have any questions:  https://t.me/BRobotTrader H1 TIMEFRAME Updates and improvements(2021.08.12): USE THE SET FILES FROM THE COMMENT SECTION! This is the biggest update in the life of the KILIMANJARO EA, it got new features and NEW engine, plus many new parameters to optimize and play around with. ---It got the official TheNomadTrader
Oscillator helps determine the direction of the market Shows the direction of the price movement and is painted in the appropriate color. Allows you to conduct trend and counter trend trading It works on all timeframes, on any currency pairs, metals and cryptocurrency Can be used when working with binary options Distinctive features Does not redraw; Simple and clear settings; It works on all timeframes and on all symbols; Suitable for trading currencies, metals, options and cryptocurrency (Bitco
Radar Fibo 123
Carlos Augusto Cedeno Rocha
https://www.mql5.com/es/signals/1654340 Avec cet outil, il vous aidera à exécuter automatiquement les SL gagnants Formez une stratégie Fibonacci Radar Fibo 123 avec des entrées de loterie minimales comme support et résistance Soyez agressif sur tout ce qui se trouve dans ce support et cette résistance. Il applique la fermeture automatique et se verrouille automatiquement. Où vous recherchez des gains minimum et maximum par mois. Actif le mois suivant.  
Premium M15
Raphael Schwietering
Dear Investor, I am a full-time system developer since 2010, having developed thousands of trading systems in the last 11 years. My main goal when developing a strategy is long-term growth. All my systems have to pass strict criteria in terms of backtests, out-of-sample validations on unseen symbols, Monte Carlo simulations on different data feeds, slippage, and increased spreads.  It: Trades the EURUSD M15 with a focus on long-term growth. Opens trades at bar and uses no martingale nor any gri
Genx AI Fusion
Jyotirmoy Sarkar
Genx AI Fusion EA basé sur GPT 3 . Cette EA est votre compagnon idéal si vous souhaitez une croissance stable de votre investissement ou des sociétés d'accessoires de passage. EA principalement développé pour l’EURUSD. Le solde recommandé est de 10 000 USD et le solde minimum peut être de 5 000 USD pour pouvoir obtenir des rendements constants. Nous évitons les fausses promesses. Ci-dessous, vous verrez à quel montant vous pouvez vous attendre. vous pouvez passer n'importe quelle entreprise d'ac
This EA can run on every currencies pairs recommend EURUSD, USDJPY, EURJPY, GBPUSD Timeframe 30 Minute (M30) The important advantage of this EA is that you can start to trade with $1000 min imum initial Deposit. And the robot can support your manual transactions on EURUSD. ACCOUNT LEVERAGE: 1:100 ACCOUNT (Stop Out): 50% or less ACCOUNT TYPE: Real account ACCOUNT MODE: Hedging account Take Profit: Automatically Stop Loss: Automatically LOT size: Manual first order
According to my 18+ years of trading experience, it is too naive to believe that you will get rich by buying a junk EA and let it run automatically without any fundamental knowledge in investment. For those who want to be serious about investing they should buy this EA and train themselves as professional traders with appropriate minimal intervention to the EA. User friendly Interface. On panel fat finger protection. High speed for sending   manual  orders. Auto follow up for manual orders pla
Please download User Guide / set files / Strategy Tester Report from here: https://www.mql5.com/en/blogs/post/689449 Twins Grid System is a powerful and flexible tool for experienced trader. This system is consist of 2 full grids: Grid A and Grid B, each full grid contains 4 basic grid: BuyLimits Grid, SellLimits Grid, BuyStops Grid and SellStops Grid. There are 31 system parameters, 22 parameters for each basic grid. It’s able to create various kinds of grid strategies. Features (1) Some grid
Fisher Steels
Ivan Simonika
The   Fisher Steel  bot implements the maximum of the HFT definitions. The expert system goes through the entire history and all currency pairs with a single setting. If there is a commission on the account, it must be converted into the equivalent of the spread and fill in the Commission field. Both virtual and real stop losses are used. Normal working conditions: The lower the commission and the spread, the greater the profit. The more latency your broker has in the amount of the Internet c
Vision Fx v
Samuel Nancwat Isaac
Introducing the Vision fx EA, a sophisticated trading robot designed to capitalize on the dynamic interplay of short-term and long-term reversal patterns within the Forex market. Unlike other robots, this EA avoids grid, or arbitrage strategies, ensuring a secure and calculated trading experience. Perfect for traders of all backgrounds, whether seasoned or beginners, the vision fx EA accommodates all skill levels. This versatile trading system comes packed with features, including guarding ag
Golden Range 2
Damian Mateusz Wojtowicz
Golden Range 2 is one of the top entry indicators securing its future with its results.  Indicator settings: Points = how precise pattern detection is AlertConfirmation = turn on(true) off(false) alert CalculatedBars = how many bars will be calculated Please leave Positive comments, reviews. Buffer 0 Buy Arrow, Buffer 1 Sell Arrow, Buffer2 Buy Signal(Value:1/0), Buffer3 Sell Signal(Value:1/0)  Buy Green, Sell Red
I will support only my client. สำหรับลูกค้า Parameters General Trade Settings Money Management  Lot : Fixed (can change) Strategies  - M1-D1 Strategies it is fixed with MA, Bollinger band, Candlestick Levels Close Functions  - M1-D1 Strategies Close by Money Profit  - Close Total Open Profit, Close Total Open Profit Short, Close Total Open Profit Long, Close Profit/Loss Today MagicNumber  - individual magic number. The EA will only manage position of the chart symbol with this magic number.
This system never paints.   This system created by using Envolpes bands and reverse bar count.   This indicator is only working in M5 period.   This system is for long term and profitable.   Signals are shown as arrows. as an optional limit orders.   You can set a voice alarm or email notification.   You can fins our other products from link : https://www.mql5.com/en/users/drbastem/seller   Also, you can ask all your questins from email : haskayafx@gmail.com or mobile : +90 530 867 5076 or @Meh
Genotype mt4
Tatiana Savkevych
Genotype : Your reliable guide in the world of Forex Genotype is an advanced Forex trading bot specifically designed for traders seeking efficient and automated trading. This innovative tool offers a wide range of features and capabilities to enable traders to effectively manage their trades and strategies. Special offer for early adopters: price reduced, but will be increased in the future. Tools for work: EURUSD, AUDCAD, AUDCHF, AUDJPY, AUDNZD, AUDSGD, AUDUSD, CADCHF, CADJPY, GBPSEK, GBPS
Synapse Trader : Un réseau neuronal qui ouvre de nouveaux horizons dans le trading Imaginez un conseiller qui ne se contente pas d’analyser le marché, mais devient votre assistant intelligent, apprenant chaque jour et s’adaptant aux conditions changeantes du marché.   Synapse Trader   est un outil unique basé sur des technologies avancées de réseaux neuronaux, capable de capter les signaux les plus subtils du marché. Ce n’est pas seulement un Expert Advisor, c’est un   réseau neuronal vivant   q
Boost binary option profesional
Sebastian Alejandro Merino Sepulveda
Binarias & Forex (+90% Ratio-Win Next Candle) Espere que el precio llegue a una buena zona (fuerte) sea soporte, resistencia, zona de oferta o demanda, fibonacci level key, cifra redonda. Haciendo lo anterior definitivamente habrá una reversión en el precio y obtendrá su ITM en primera vela dando una efectividad del 100% siguiendo la tendencia. Es muy importante estar atento a las noticias fundamentales en el mercado y estas no afecten tu trading. Sesiones comerciales: cualquiera (24 horas).
CyNeron MT4
Svetlana Pawlowna Grosshans
5 (1)
CyNeron : Le trading de précision rencontre l'innovation de l'IA Signaux :   CyNeron Manuel et fichiers de configuration : Contactez-moi après l'achat pour recevoir le manuel et les fichiers de configuration Prix : Le prix augmente en fonction du nombre de copies vendues Copies disponibles : 5 Analyse instantanée pilotée par l'IA : Une première sur le marché CyNeron est le premier EA sur le marché à intégrer une IA avancée dans une approche de trading révolutionnaire, capturant et traitant des
Mongol Indicator2
Sumiyabazar Buyanjargal
It's a variation of mid of HH and LL since it compares the higher of HH or LL against a period and twice the number of bars back to avoid whipsaws. I used to display this against lines on a chart, but made a histogram out of it and it looks interesting. It looks good at gauging trend strength and general turns (see image below). The name of the indicator is BAM, which is an acronym for "Below and Above Mid". Ways to use it: 1. To see general trend on longer TFs (more than 30 ba
**Multi-Strategy EA with Advanced Statistical Analysis (ANOVA & R-squared)** **Core Statistical Framework:** 1. **ANOVA Analysis:**    - One-way ANOVA: For trend direction significance    - Two-way ANOVA: For market variable interactions    - P-value thresholds < 0.15 for trade validation 2. **R-squared Analysis:**    - ATR R² (Strong correlation ≥ 0.75)    - Standard Deviation R² (Moderate: 0.50-0.74)    - EMA R² (Weak: 0.25-0.49)    - Combined R² for overall market state    - Determines s
EPriceJPY
Ngo Yung Lau
EPriceJPY is a auto-trading EA focused on USDJPY. Trading Concept The operation concept of EPriceJPY is based on an algorithm that tries to determine the Trend. To be more specific, EPriceJPY works with its own calculation logic based on simulation. It is trying to find out the Top or Bottom in a Trend, and open the Short or Long Position accordingly. Don't expect EPriceJPY to open the trade on the highest or lowest level, because EPriceJPY will trade only when the Top/Bottom can be confirmed.
Golden Move 2
Damian Mateusz Wojtowicz
The best indicator out there, try it yourself! Please leave your positive comments and reviews! Settings: AlertConfirmation: truns on and off alerts CalculatedBars: how many bars will be calculated Distance : arrow distance Buffers: Buffer0 (Arrow Buy) Buffer1 (Arrow Sell) Buffer2 (Empty) Buffer3 (Empty) Buffer4(Buy value == 1) Buffer5(Sell value ==1)
Meat EA
Roman Kanushkin
5 (1)
The Meat EA is a fully automatic, 24-hour trading system. It trades based on analysis of market movement on the basis of a built-in indicator and the Moving Average trend indicator. The system is optimized for working with the EURUSD currency pair on the M30 timeframe. It is recommended to use an ECN/STP broker with low spread, low commission and fast execution. Signal monitoring Working currency pair/timeframe: EURUSD M30. Advantages never trades against the market; the higher the risk, the h
Avis important : L'Expert Advisor Fire Wave est spécifiquement conçu pour fonctionner sur la paire GBP/USD en utilisant l'échelle de temps de 5 minutes. Utiliser l'EA sur des échelles de temps plus élevées (comme H1 ou plus) augmente significativement le risque et pourrait entraîner des pertes plus importantes que prévu. Cela est dû aux calculs uniques de la stratégie, optimisés pour le graphique de 5 minutes. Cependant, si vous préférez un risque plus faible avec des rendements moindres, l'EA p
The indicator scans for TD Combo signals in multiple timeframes for the all markets filtered and shows the results on Dashboard. Key Features Dashboard can be used for all markets It can scan for signals on MN1, W1, D1, H4, H1, M30, M15 ,M5, M1 timeframes Parameters UseMarketWatch: Set true to copy all symbols available in market watch MarketWatchCount : Set the number of symbols that you want to copy from the market watch list. CustomSymbols: Enter the custom symbols that you want to be availa
Forex Play
Ivaylo Petkov
Forex Play EA is an automated Expert Advisor based on smart algorithm and some standard indicators like Bollinger Bands, Stand Deviation etc. Money management - automatic lot calculation based on your risk per trade or manually set; Broker SPY Module (Hidden Take Profit and Stop Loss); Spread and Slippage Protection; High Trading Frequency; Flexible input options to use on different currency pairs; This system uses no grid, no martingale, no arbitrage, no hedges; Parameters Distance from BB fo
L'indicateur est comme une belle-mère, qui parle souvent, parle beaucoup et souvent de manière inappropriée. L'indicateur, en plus de nous donner un signal d'entrée sur des paramètres que j'énumérerai ensuite, surveille la tendance du pas de temps horaire, OSMA pour comprendre le sens d'entrée, RSI pour détecter d'éventuelles conditions de surachat ou de survente dont s'abstenir, ATR pour le volatilité et ADX pour la tendance. Indicateur non recommandé pour les débutants. Seul le jugement hu
Les acheteurs de ce produit ont également acheté
Smooth price for Monarch MT4
Konstantin Gruzdev
3.67 (3)
The Smooth Price technical indicator is used for plotting a smoothed line as close to the price of the financial instrument as possible, and serves to eliminate its noise components. The indicator is part of the Monarch trading system, but here it is presented as an independent technical analysis tool. The indicator is based on the cluster digital filter , which, unlike the ClusterSMA , is applied directly to the price time series. Smooth Price does not redraw (except the very last, zero bar) an
Trins
Ivan Simonika
1 (1)
One of the main definitions for monitoring the currency market is the trend. The Trins indicator is designed to display the trend in a visual form. Trend is a stable direction of price movement. To find it, the indicator uses calculations designed to smooth out sharp fluctuations that do not affect the overall picture of price movement. The trend can be increasing (bullish trend) and decreasing (bearish trend). In most cases, the trend is growing for a long time and drops sharply, but in all
Mafaranga
Phillimon Shumbusho
The real market buy/Sell signals, you can trust.  This indicator tracks the trend strength, the market strength, the real current volume, and the price direction to give traders and investors the optimum point for entry in the form of signals. The time frames range from 5 minutes to one (1) hour chart. Trading on higher time frames produce the best outcomes, but also do produce less frequent trades, compared to trading on lower time frames.
Oni Scalper
Goh Cheng Wai
5 (2)
Dear Onis, This Indicator is used for   GBPUSD, US30 and GOLD on 1-Min Chart . For US30 , Depending on your broker, Minimum Lot Size will differ from 0.01 to 1.0 lots. My Current Account is trading at 1.0 lots at $1 per point . Please check with your Broker what's the Margin Required for your Minimum lot sizes before you trade on your Real account. I have Forward Tested the indicator for around 6 months before releasing it to the public. ( No Demo is available for the Indicator, Strategy
La VITESSE DE TRANSACTION est l'indicateur de la plus haute qualité qui montre où et quand les ordres importants s'accumulent sur le marché et quels en sont les avantages. Il détecte les changements de tendance à un stade très précoce. Il s'agit à la fois d'un indicateur et d'un système de trading. Le concept est unique et incroyablement rentable. Sur le marché des changes, le tick volume est appelé de manière assez trompeuse volume. Il s'agit en fait de la variation du prix par unité de temp
Precautions for subscribing to indicator This indicator only supports the computer version of MT4 Does not support MT5, mobile phones, tablets The indicator only shows the day's entry arrow The previous history arrow will not be displayed (Live broadcast is for demonstration) The indicator is a trading aid Is not a EA automatic trading No copy trading function The indicator only indicates the entry position No exit (target profit)  The entry stop loss point is set at 30-50 PIPS Or the front
Automatic, live & interactive picture of all trendlines. Assign push, email and sound alerts to the lines of your choice and be informed about price rollback, breakout, rollback after breakout, number of rollbacks, line expiration by double breakout. Correct, drag or delete the lines and interactively tune the line system. https://youtu.be/EJUo9pYiHFA . Chart examples https: //www.mql5.com/en/users/efficientforex Price Interaction Events All events are effective immediately and only after on
The indicator displays the probable ( Support and resistance ) levels. The indicator draws horizontal and trend levels of support and resistance. The indicator settings: Trends - the mode for displaying trend lines or horizontal lines of support and resistance Yes - display trend lines only No - display horizontal lines only UseResource - use the resources built into the indicator. Yes - use the ZigZag indicator from the resources of the product. No - use a custom ZigZag indicator. HistoryBar -
The indicator of a Professional Trader is an arrow indicator for predicting the direction of price movement. I have been working on this indicator since 2014. You can use this indicator as your main indicator, use its entry signals, and use it as your only indicator to find entry points. About the product: Recommended TF [H4-D1-W1]   . The indicator predicts the direction of the next candle. Fits a variety of tools; Flexibility in settings for different instruments and intervals through the
The [GRAFF] III manual trading system is based on multiple MetaTrader (MT4) indicators. Together, the entire PACK of GRAFF III indicators makes an advanced trading tool. The system consists of over 20 different custom-built indicators which have been carefully selected and tested in the long term to produce strong and efficient trading signals. The particular indicators are based on different mathematical formulas, so the entire system is calibrated to remove false signals from its own indicator
You can fins our other products from link : https://www.mql5.com/en/users/drbastem/seller   Also, you can ask all your questins from email : haskayafx@gmail.com or mobile : +90 530 867 5076 or @MehmetBastem    on telegram application This indicator is used to determine the trend. Standard Osma indicator is used. It has the indicator warning system: beep, e-mail and has three types of alerts, including messages to mobile phone. It shows the best performance on the chart of 5 minutes. When the
You can fins our other products from link : https://www.mql5.com/en/users/drbastem/seller   Also, you can ask all your questins from email : haskayafx@gmail.com or mobile : +90 530 867 5076 or @MehmetBastem    on telegram application This indicator is used to determine the trend. Standard Three Moving Average and ADX indicators are used. It has the indicator warning system (audio, e-mail) and three types of alerts, including messages to mobile phone. It shows the best performance on M5. When
This indicator is used to determine the trend. Standard Three Moving Average and ADX indicators are used. It has the indicator warning system (audio, e-mail) and three types of alerts, including messages to mobile phone. It shows the best performance on M5. When the trend value reaches the value set, the warning system is activated. This indicator works only with Forex symbols. Inputs SoundAlarm = true - Sound Alert Sendmail=true - Send an e-mail in case of a buy or sell signal Sendnotificatio
You can fins our other products from link : https://www.mql5.com/en/users/drbastem/seller   Also, you can ask all your questins from email : haskayafx@gmail.com or mobile : +90 530 867 5076 or @MehmetBastem    on telegram application This indicator is used to determine the trend. Standard MACD indicator is used. It has the indicator warning system: beep, e-mail and has three types of alerts, including messages to mobile phone. It shows the best performance on the chart of 5 minutes. When the
Cet indicateur propose une méthode robuste d'analyse de marché centrée autour du concept de "l'outil de canal de régression". En utilisant cet outil, les traders peuvent obtenir un contrôle exceptionnel sur le canal de régression de leur graphique, ce qui leur permet de prendre des décisions de trading plus éclairées. L'outil de canal de régression est un instrument puissant dans la boîte à outils d'un trader. Il est conçu pour fournir des informations précieuses sur les tendances des prix et le
A simplistic indicator informing a user on RSI divergence by sending messages to mobile device and email. The indicator draws 2 vertical lines, marking two RSI extrema that formed the divergence. You get the alert, open the charts and make a decision. The indicator does not show past divergences, thus when you attach it to a chart for the first time you see nothing. Graphics and alerts will appear as soon as divergences do. Drop it in Tester to see how it works. Parameters: RSIPeriod - number of
Green Wall Arrows
Daniel Luchinger
1 (1)
The Name Green Wall : Arrows hits a lot of TP, by changing the idea of non using SL as something bad, but instead use Small TP and a lot of free Margin and Patience. Use micro TP and a lot of Free Margin with this indicator on Forex. It also can be used with Binary Options. This strategy is intended to be traded Manually. This Indicator runs on Open Bar, arrows will delete when price are against it. The only Indicator Parameter is Alerts true/false, all the rest is included inside the code. Arro
Golden Monowave
Ahmed Mohamed Ali
Golden Monowave is monowave indicator, the monowave theory is one of Elliott wave approach and one of most complicate and accurate method. Golden Monowave can shortcut many major steps to identify and describe the monowave. It works on any timeframe and with any trading instrument, including currencies, indices, futures, etc. Input Parameters initial_Bars - set the initial number of bars to calculate. wave_color - select the color of the wave. label_color - select the color of labels. temp_lab
Ticks Size
Viktor Kolmakov
This indicator displays in a separate window the difference between the number of points which increased the price, and the number of points that decreased the price during the time interval specified in the settings. The time interval for calculation is expressed as the number of bars of the chart the indicator is attached to. This approach allows you to evaluate the movement direction (growth or fall) of the instrument's price, the strength of the movement and the size of the movement in point
NostradamusMT4
Andrey Spiridonov
1 (1)
NostradamusMT4 is a powerful indicator from the set of professional trader. The indicator is based on Andrei Spiridonov's original price calculation method (ESTIMATED PRICE) for the current candle price. Advantages The indicator does not redraw. It works on any timeframes. Works with any trading instruments. Perfectly suitable for scalping and trading binary options. Parameters Color - color of the ESTIMATED PRICE FUTURE line. How to work with the indicator The indicator forms the ESTIMATE
BinaryIndicator
Andrey Spiridonov
BinaryIndicator is a highly accurate indicator for trading binary options. It shows excellent results in scalping. This indicator is based in multifactor analysis of trend indicators, as well as confirmation oscillators, which in the end gives an increased accuracy of signals. Advantages of the indicator Increased accuracy of signals. Excellent results when trading binary options with a short expiration time from M30 to M1 . It works on any timeframes. Works with any trade symbols. Parameter
BinaryScalping
Andrey Spiridonov
BinaryScalping is a professional indicator for trading binary options and scalping. The algorithm of the indicator is based on the calculation of pivot points for each time period separately, the location of the price of the trading instrument relative to the pivot points is analyzed and the probability of a trading operation is calculated. The indicator has a built-in filter of trading signals based on the global trend. The indicator is installed in the usual way and works with any trading inst
Primus Trading Engine is a trading system that combines price action,ratio based indicators & custom indicators to create this leading indicator with a multi-timeframe approach to give you high probability trade setups for forex,CFD cash/futures,metals & binary option to assist in making predictions on what is MOST likely to happen in the market Main Chart Features Price Action Signal-Arrow displayed on a specific bar;NOT buy/sell arrow;DOES NOT repaint;Bullish arrow on a bullish bar,price is l
This is the FXTraderariel PowerTrend . It compute a trendfollowing system based on it own algorithm. It gives you a buy or sell signal based on the trend. It based on the Supertrend, but our Version is not repainting. Furthermoore we added some Improvements and you can get an Arrow, Push or Alert when the trend changes. Depending on the settings it and trading style, it can be used for scalping or long-term trading . The indicator can be used on every time frame , but we advise to use it on H1
This is the complete REX package. It consists of the lite, pro and ULTRA version.  Perfect for beginners and intermediates. REX complete is 100% non repaint. The strategy is based on a mix of different strategies, statistics, including pivot points, oscillators and patterns.  As the trading idea consists of a variety of some classic indicators like Momentum, Williams Percent Range, CCI, Force Index, WPR, DeMarker, CCI, RSI and Stochastic, it is clear that the fundamental indicators have being
BinaryUniversal
Andrey Spiridonov
BinaryUniversal is a signal indicator for binary options and Forex. In its work, the indicator uses a complex algorithm for generating signals. Before forming a signal, the indicator analyzes volatility, candlestick patterns, important support and resistance levels. The indicator has the ability to adjust the accuracy of the signals, which makes it possible to apply this indicator for both aggressive and conservative trading. The indicator is set in the usual way, it works on any time period and
Sweet Waffle
Christophe Godart
The arrows are calculated with: -     2 Parabolic  parameters -     2 ADX parameters -     4 Stochastic parameters We recommend to combine it with Parabolic, ZigZag or Elliot waves indicator. Always trade the trend! If you make sure to draw your trend lines and support/resistance zones you will just have to wait for the signal to appear. Take the trade. For Binary Options it is advisable to set the expiry time to 5-15 min in M1 chart. THIS INDICATOR IS ZERO REPAINT Best assets to trade: -
Let´s try to make some real money! Call me profit addicted. I thought why not try to make THE dream come reality. With discipline, a clear strategy and this indicator I focus on entering the perfect trades. This indicator is very easy to use as you will get perfect entry points for Put or Call trades. The arrows are calculated with: -     Momentum  parameters -     Candle stick patterns -     Fundamental Price action We recommend to combine it with Parabolic, ZigZag or Elliot waves indic
SystemPro
Andrey Spiridonov
SystemPro - a professional indicator, is a full-fledged, self-sufficient author's strategy for working in the Forex market. A unique algorithm for analyzing the foreign exchange market is based on the calculation of reference points for three different time periods. Thus, the indicator simultaneously analyzes the long-term, medium-term and short-term price behavior before issuing a signal. The indicator is set in the usual way and works with any trade symbols. Advantages of the indicator It i
Plus de l'auteur
[V 1.00] MTF NRPA 5 RSI RTD est sorti ! Tableau de bord en temps réel avec flèche non repeinte. Si vous en avez assez d'utiliser divers indicateurs RSI mais que vous constatez qu'ils sont inexacts, essayez cet outil. Habituellement, les gens n'installent qu'un seul RSI pour déterminer le niveau d'OBOS dans un laps de temps. La mauvaise nouvelle est que vous ne pouvez pas voir les niveaux et les tendances OBOS sur différentes périodes à la fois. C'est pourquoi j'ai développé cet outil de tra
L'analyse de plusieurs périodes d'une paire de devises dans une seule fenêtre peut vous rendre confus. Pour analyser plusieurs échelles de temps, vous avez besoin d'indicateurs fiables. L'un d'eux utilise la courbe MACD 9TF. J'ai travaillé jour et nuit pour créer un code simple mais fiable et couvrant les neuf périodes de temps dans un seul indicateur. Regardons quelques-uns des avantages de cet indicateur : Histogramme coloré. La couleur de la courbe dans chaque période est différent
L'analyse de plusieurs périodes d'une paire de devises dans une seule fenêtre peut vous rendre confus. Pour analyser plusieurs échelles de temps, vous avez besoin d'indicateurs fiables. L'un d'eux utilise 9TF STOCH RSI. J'ai travaillé jour et nuit pour créer un code simple mais fiable et couvrant les neuf périodes de temps dans un seul indicateur. Regardons quelques-uns des avantages de cet indicateur : Histogramme coloré. La couleur de la courbe dans chaque période est différente l'u
Analyzing multiple time frames of a currency pair in one window can make you confused. To analyze multiple time frames, you need reliable indicators. One of them is using 9TF RSI MA . I've been working day and night to create code that is simple but reliable and covers all nine time frames in just one indicator .  Let's look at some of the advantages of this indicator: Colorful histogram . The color of the curve in each timeframe is different from one another.  Arrows indicating the crossing of
Analyzing multiple time frames of a currency pair in one window can make you confused. To analyze multiple time frames, you need reliable indicators. One of them is using 9TF MACD Limited Bar . I've been working day and night to create code that is simple but reliable and covers all nine time frames in just one indicator .  Attention! When first installed, the indicator does not look intact. Changing the timeframe will solve the problem. Let's look at some of the advantages of this indicator: C
Analyzing multiple time frames of a currency pair in one window can make you confused. To analyze multiple time frames, you need reliable indicators. One of them is using 9TF STOCH RSI LIMITED BAR . I've been working day and night to create code that is simple but reliable and covers all nine time frames in just one indicator .  Attention! When first installed, the indicator does not look intact. Changing the timeframe will solve the problem. Let's look at some of the advantages of this indicat
L'analyse de plusieurs périodes d'une paire de devises dans une seule fenêtre peut vous rendre confus. Pour analyser plusieurs échelles de temps, vous avez besoin d'indicateurs fiables. L'un d'eux utilise 9TF Double RSI Double MA. J'ai travaillé jour et nuit pour créer un code simple mais fiable et couvrant les neuf périodes de temps dans un seul indicateur. Regardons quelques-uns des avantages de cet indicateur : Double RSI, c'est-à-dire RSI plus rapide et RSI plus lent. Double MA, c
L'analyse de plusieurs périodes d'une paire de devises dans une seule fenêtre peut vous rendre confus. Pour analyser plusieurs échelles de temps, vous avez besoin d'indicateurs fiables. L'un d'eux utilise 9TF Double CCI Double MA. J'ai travaillé jour et nuit pour créer un code simple mais fiable et couvrant les neuf périodes de temps dans un seul indicateur. Regardons quelques-uns des avantages de cet indicateur : Double CCI, c'est-à-dire CCI plus rapide et CCI plus lent. Double MA, c
Un indicateur CCI précis est disponible. Tableau de bord Trend Bar Smart Level 9TF Double CCI. Double CCI, c'est-à-dire Fast CCI & Slow CCI Pourquoi avez-vous besoin d'une deuxième CCI ? L'utilisation d'indicateurs supplémentaires nous convaincra davantage dans le trading en direct Courbe CCI rapide 9TF 9TF Courbe CCI lente Angle CCI en temps réel 9TF Valeur CCI en temps réel 9TF Direction/phase CCI en temps réel 9TF Barre de tendance 9TF Nouvel algo dans le calcul de la barre de tendance Bou
Un indicateur RSI précis est disponible. Dashboard Trend Bar Smart Level 9TF double rsi. Double RSI, c'est-à-dire RSI rapide et RSI lent Pourquoi avez-vous besoin du deuxième RSI? L'utilisation d'indicateurs supplémentaires nous convaincra davantage dans le trading en direct Courbe RSI 9TF Fast Courbe RSI lent 9tf Angle RSI en temps réel 9TF 9tf Valeur RSI en temps réel 9tf Direction / phase RSI en temps réel Barre de tendance 9tf Nouvel algo dans le calcul de la barre de tendance Bouton ON /
Un indicateur MACD précis est disponible. Barre de tendance du tableau de bord Smart Level 9TF Double MACD. Double MACD, c'est-à-dire rapide (MACD 1) et lent (MACD 2) Pourquoi avez-vous besoin d'un deuxième MACD ? L'utilisation d'indicateurs supplémentaires nous convaincra davantage dans le trading en direct Courbe MACD 1 rapide 9TF Courbe MACD 2 lente 9TF Angle MACD en temps réel 9TF Valeur MACD en temps réel 9TF Direction MACD en temps réel 9TF Un indicateur MACD précis est disponible. Ba
Un indicateur stochastique précis est disponible. Barre de tendance du tableau de bord Smart Level 9TF Dual Stochastic. Stochastique double, c'est-à-dire stochastique rapide et stochastique lent Pourquoi avez-vous besoin d'un deuxième stochastique ? L'utilisation d'indicateurs supplémentaires nous convaincra davantage dans le trading en direct Courbe stochastique rapide 9TF 9TF Courbe stochastique lente Angle stochastique en temps réel 9TF 9TF valeur stochastique en temps réel Direction/phase
Si vous perdez souvent des transactions parce que vous n'utilisez qu'un seul indicateur, essayez cet outil de trading. Cet outil de trading utilise plus d'un indicateur. J'observe souvent des traders qui utilisent uniquement l'indicateur RSI. Très souvent, le marché est survendu mais toujours en baisse ou le marché est suracheté mais toujours en hausse. Pour cette raison, vous devez utiliser plusieurs indicateurs. Présentation de la nouvelle version V 3.40 MTF PPAAF : Flèche d'action précise su
[V 1.00] MTF NRPA 5 Moving Average RTD est sorti ! Tableau de bord en temps réel avec flèche non repeinte. Si vous recherchez le meilleur indicateur de moyenne mobile, vous êtes sur la bonne page. Généralement, les gens installeront deux moyennes mobiles car l'intersection des deux moyennes mobiles (le croisement) déterminera la direction de la prochaine tendance des prix. Si la moyenne mobile rapide croise la moyenne mobile lente et rapide> lente, la tendance est à la hausse. Inversement,
Introducing the advanced trading tools of 2023. MTF PPAAF Model S. This is sub window version of my best trading tool : MTF Precise Price Action Arrow Filtered.  Click here to learn more about MTF PPAAF . This trading tool is equipped with various powerful features : MTF = Multi Time Frame = Time Frame can be changed. On/off button. Non Repaint Arrows.  Customizable parameter, color etc.  Can show all time frame (ATF) crossover arrows of fast stochastic main line & fast stochastic signal line (
If you are curious about the position of the stochastic, RSI, CCI curve, whether it is at the OBOS level or not, then this trading tool is for you. Introducing the advanced trading tools of 2024. ATF Trend Following Trend Bar OBOS. This indicator is similar to MTF PPAAF Model S but have two layers.  Click here to learn more about MTF PPAAFS . This trading tool is equipped with various powerful features : MTF = Multi Time Frame = Time Frame can be changed. On/off button. Customizable parameter,
Avec cet outil de trading, vous pouvez analyser 15 marchés simultanément. Présentation du nouvel indicateur de trading 2024 : ️ Tableau de bord multi-devises multi-périodes stochastiques. Il y a au moins deux raisons pour lesquelles j'ai créé cet outil de trading : Premièrement, j'en ai marre de n'observer qu'un seul marché. Deuxièmement, je ne veux pas perdre le moment d’entrée sur un autre marché. C'est pourquoi je souhaite connaître en même temps les autres conditions du marché.
Avec cet outil de trading, vous pouvez analyser 15 marchés simultanément. Présentation du nouvel indicateur de trading 2024 : ️ Tableau de bord multi-devises multi-périodes Double CCI. Il y a au moins deux raisons pour lesquelles j'ai créé cet outil de trading : Premièrement, j'en ai marre de n'observer qu'un seul marché. Deuxièmement, je ne veux pas perdre le moment d’entrée sur un autre marché. C'est pourquoi je souhaite connaître en même temps les autres conditions du marché. Po
Avec cet outil de trading, vous pouvez analyser 15 marchés simultanément. Présentation du nouvel indicateur de trading 2024 : ️ Tableau de bord multi-devises multi-périodes Double RSI. Il y a au moins deux raisons pour lesquelles j'ai créé cet outil de trading : Premièrement, j'en ai marre de n'observer qu'un seul marché. Deuxièmement, je ne veux pas perdre le moment d’entrée sur un autre marché. C'est pourquoi je souhaite connaître en même temps les autres conditions du marché. Po
Filtrer:
Aucun avis
Répondre à l'avis
Version 1.80 2024.11.28
In this new Version V 1.80 :
- Fixing belt trend arrows
- Adding belt trend calculation mode
- Fixing buy sell status trading in the zone when using replay system mode
Version 1.70 2024.11.20
In this new Version V 1.70 :
- Adding calculation mode for trading in the zone (vertical and horizontal)
- Adding Trend Bar 9TF RSIMA CCIMA (complete!)
- Customizing ATF crossover arrows size of layer 1 and layer 2
Version 1.60 2024.09.20
In this new Version V 1.60 :
- Adding Dual Pivot ATF display type
- Replay system applicable to dual pivot ATF
- Adding Trend Bar 3TF RSIMA CCIMA arrows scheme
Version 1.50 2024.08.26
In this new Version V 1.50 :
- Adding Dual Double CCI
- Adding DDCCI calculation mode (fast/slow)
- Adding Mode : Show ATF RSIMA & CCIMA
Version 1.40 2024.08.13
In this new Version V 1.40 :
- Deconstruct from the beginning
- Adding CCIMA indicator
- Adding triple MTF cloud histo
- Adding triple MTF confluence multi mode
- Adding trend bar 3TF RSIMA/CCIMA
- Adding dual pivot all time frame
- Adding color level scheme
- Adding mode 24 : Show ATF Fast DMACD and Slow DMACD
- Adding mode 25 : Show ATF RSIMA and CCIMA
- Optimizing the loading time
Version 1.30 2024.06.17
In this new Version V 1.30 :
- Adding wait to buy and wait to sell trading in the zone feature (this is great feature!)
- Adding location of confluence arrows
- Adding cloud histogram calculation mode
Version 1.20 2024.06.12
In this new Version V 1.20 :
- Changing the trend bar 5TF to 7TF
- Adding angle value feature of four MA
Version 1.10 2024.05.28
In this new Version V 1.10 :
- Deconstruct from beginning
- Adding Slow DDRSI
- Adding 23 Mode
- Adding Layer 1 & Layer 2
- Adding Trend Bar 5TF Multi Mode
- Adding Dual MTF Belt Trend
- Adding Dual MTF Cloud Histo
- Adding Confluence MTF Multi Mode
- Fixing TSPI
- Fixing Candle HTF
- Fixing Trading in The Zone